Anatomy & Physiology: Current Research
Open Access
ISSN: 2161-0940
ISSN: 2161-0940
Research Article - (2019)Volume 9, Issue 3
Background: Maternal age is one of the prime factors in healthy pregnancy outcomes. Extremes of maternal age will lead to adverse effects on the growth trajectory of fetus and placenta. Hence, current study assessed the impact of maternal age with the percentiles of birth weight and placental morphometry.
Materials and Method: Study was conducted on 391 subjects in a teaching hospital of North Karnataka, India for a period of 6 months. Ethical clearance was obtained. Data was collected by using standard pretested proforma. Percentiles of the birth weight and placental morphometry in different maternal age has been expressed in table, and Box plots have been plotted.
Result: Age-wise distribution of 391 mothers reveals that 7.2 percents were less than 20 years of age and 7.6 percent more than 30 years and above, with mean 23.6 and SD 3.7 years. Percentiles of the birth weight and placental morphometry did not show any consistent relationship with increasing groups of age.
Conclusion: The study conveys that in different groups of maternal age percentiles of birth weight exhibited consistent increasing trends only in higher percentiles (75th to 95th) whereas, percentiles of placental morphometry did not exhibit consistent relationship with mother’s age.
Pregnancy; Placenta; Blood; Anaemia; Gynaecology
Fetal growth is regulated by uteroplacental blood flow, placental size, and transfer capacity. When materno-placental supply of nutrition is less than the demand, the fetus tries to adapt by modifying its body composition and endocrine status by selecting the growth of specific organs and undergoes cardiovascular adjustments [1]. Amongst the various factors affecting fetal growth during pregnancy, maternal age has prime role. Mothers with advanced age (>40 years) are more associated with placenta previa [2] whereas, teenage pregnancies are associated with more placenta previa and premature separation of placenta [3].
Many developed countries have exhibited a rise in mother’s age at childbirth in the past decades [4]. Advanced age mothers are at increased risk of adverse pregnancy outcomes. The risks are stillbirth, preterm delivery, macrosomia, extremely large for gestational age and Caesarean section. These risks remained high after adjusting for parity and socio-economic status [5]. One of the reports from the least developed countries specifies that one out of four births will be to an adolescent mother (between 15-19 years) highest in sub-Saharan Africa, Latin America, and Caribbean [6]. Even the young teenage mothers are at high risk during pregnancy and delivery. Yet, the controversy prevails over teenage motherhood may be attributed to biological factors, lifestyle, and socioeconomic conditions [7].
Teenage pregnancy is associated with risk of prematurity, low birth weight, small for gestational age infants, and high rate neonatal mortality. Young mothers are more prone to anemia, urinary tract infection, and hypertension [8]. Both extremes of age groups have their own disadvantages on mother and pregnancy outcomes. Hence, this study specifies the percentile growth trajectory of placenta and new-born in different maternal age groups.
This study was conducted on 391 placentae of consecutive deliveries from the Obstetrics and Gynaecology unit of teaching Hospital from North Karnataka, India, for a period of six months. The approval from the institutional ethics clearance committee was obtained. Informed and written consent was obtained from the subjects. The study includes mothers with consecutive singleton deliveries of gestational age 28 weeks and above. The subjects without antenatal check-up during first trimester and with history of pre-pregnancy systemic and chronic diseases were excluded. The maternal age, placental morphometry, and new-born weight were recorded on a predesigned and pretested pro forma.
Specimen collection, preparation, and assessment of placental morphometry
Placentae were collected soon after separating the baby from the umbilical cord. The collected placentae were examined thoroughly and washed under running tap water, thereafter; membranes were trimmed and stored in 10% formalin.
The weight of each placenta was determined by using a digital baby weighing scale (CS-8316; CE certified) and recorded with an accuracy of 1 g. The maternal surface area of the placenta was calculated using the following formula: Surface area=pdl × ds/4, (where dl is the largest diameter and ds are the smallest diameter) the surface area was recorded with an accuracy of 1 cm2. The volume was recorded using water displacement method, with accuracy of 1 ml [9].
Parameters of mother assessed
Information regarding the age of mothers was recorded from inpatient records. Age was classified into four groups; <20 years, 20- 24 years, 25-29 years, and ≥ 30 years
Parameters of new-born baby assessed
Gestational age, Baby birth weight was measured by using the digital baby weighing scale (CS-8316; CE certified) with an accuracy of 10 g. Birth weight. Statistical analysis was carried out using SPSS, version 16. Percentiles of Birth weight and placental morphometry by maternal age groups have been studied. Box plots were prepared to study the Figure relative distributions of placental morphometry and birth weight in different maternal age groups.
Maternal age was distributed in four groups. Percentile distributions of birth weight and placental morphometry (weight, volume, and surface area) have been studied in different groups of maternal age.
Table 1 reveals that a maximum 58.3 percent of pregnant women were age 20-24 years, 7.3 percent of pregnant women were an age less than 20 years, 26.7 percent of pregnant women were age 25-29 years, and 7.6 percent of pregnant women were of age more than 30 years. The maternal age range was 17 to 35 years with Mean and SD of 23.6 years and 3.7.
| Age in years | Percent (n=391) |
|---|---|
| <20 | 7.38 |
| 20-24 | 58.27 |
| 25-29 | 26.72 |
| 30+ | 7.63 |
| Mean=23.6 SD=3.7 | |
| Range=17 -35 yrs | |
Table 1: Maternal age distribution.
Table 2 reveals that the percentiles of birth weight in women <20 years of age were lower as compared to higher age groups, however, the consistent increasing trends of birth weight were observed in higher percentiles (75th, 90th, and 95th percentiles) of maternal age groups. Table 2 reveals that in the four increasing groups of maternal age 5th percentiles of the placental weight increased consistently from 223 to 306 gm. The similar consistent increasing trends were not observed in higher percentiles except in 50th percentile. Table 2 reveals that in the four increasing groups of maternal age, percentiles of the placental volume did not exhibit any consistent relationship. Table 2 reveals that in the four increasing groups of maternal age 25th percentile of the placental surface area increased consistently from 188.6 to 201 cm sq. The similar consistent increasing trends were observed in 90th and 95th percentiles.
| Age groups | Percent (n=391) | Percentiles | |||||||
|---|---|---|---|---|---|---|---|---|---|
| 5 | 10 | 25 | 50 | 75 | 90 | 95 | |||
| a. Birth weight in gm | |||||||||
| <20 | 7.38 | 1150 | 1800 | 2350 | 2700 | 2900 | 3000 | 3329 | |
| 20-24 | 58.27 | 1750 | 2100 | 2400 | 2700 | 2990 | 3150 | 3300 | |
| 25-29 | 26.72 | 1362 | 2060 | 2400 | 2800 | 3000 | 3336 | 3500 | |
| 30+ | 7.63 | 1765 | 2020 | 2500 | 2775 | 3200 | 3672 | 3809 | |
| b. Placental weight in gm | |||||||||
| <20 | 7.38 | 223.5 | 342 | 403.5 | 431 | 544.5 | 585 | 639 | |
| 20-24 | 58.27 | 273.5 | 320 | 375.5 | 434 | 495.5 | 565 | 588 | |
| 25-29 | 26.72 | 285.9 | 302.8 | 371 | 442 | 508 | 579.4 | 607.1 | |
| 30+ | 7.63 | 306.4 | 352.6 | 401.3 | 480.5 | 531 | 583.6 | 716.8 | |
| c. Placental volume in ml | |||||||||
| <20 | 7.38 | 100 | 270 | 330 | 400 | 480 | 520 | 575 | |
| 20-24 | 58.27 | 240 | 270 | 310 | 380 | 430 | 500 | 520 | |
| 25-29 | 26.72 | 216 | 250 | 300 | 400 | 432.5 | 520 | 560 | |
| 30+ | 7.63 | 226.5 | 246 | 350 | 450 | 492.5 | 518 | 674.5 | |
| d. Placental surface area in sq. cm | |||||||||
| <20 | 7.38 | 112.4 | 175 | 188.6 | 213.7 | 233 | 253.8 | 275.4 | |
| 20-24 | 58.27 | 152 | 165 | 198 | 226.3 | 254.6 | 283.6 | 314.3 | |
| 25-29 | 26.72 | 156.4 | 176 | 200.4 | 226.3 | 253.8 | 298.6 | 324.1 | |
| 30+ | 7.63 | 139.3 | 173.9 | 200.9 | 247.1 | 286.4 | 314.3 | 395.8 | |
Table 2: Birth weight and placental morphometry by maternal age groups.
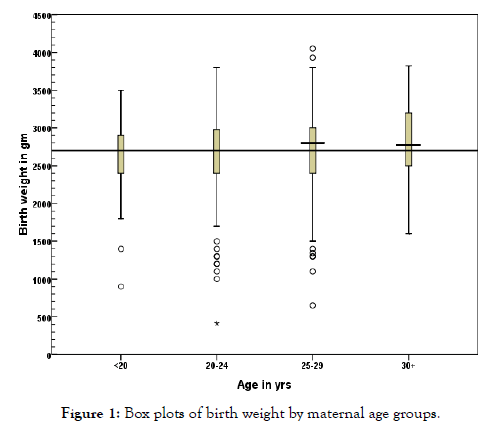
Box plots of birth weight by maternal age groups in Figure 1 reveals that the overall median reference line of birth weight was at 2700 gm. The medians of birth weight in the initial two groups (<20 and 20-24 years) of age were lower than other two groups and they were also coinciding with overall median. The third and fourth groups (25-29 and more than 30 years) median birth weights were higher (2800 gm and 2775 gm) than other groups.

Figure 1. Box plots of birth weight by maternal age groups.
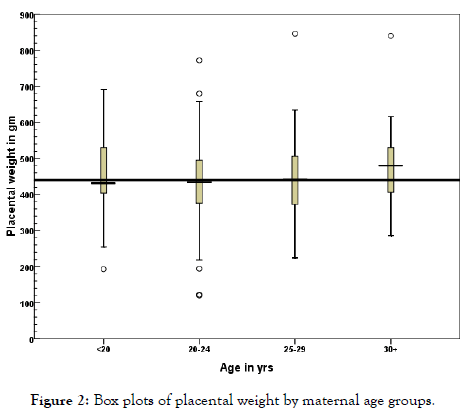
Box plots of placental weight by maternal age in Figure 2 reveals that the overall median reference line of placental weight was at 440 gm. Placental weight exhibited an increasing trend with maternal age groups. The median of placental weight in four groups of maternal age (<20, 20-24, 25-29, 30+) were at 431, 434, 442 and 480.5 gm respectively. The median of third group was nearly coinciding with overall median placental weight.

Figure 2. Box plots of placental weight by maternal age groups.
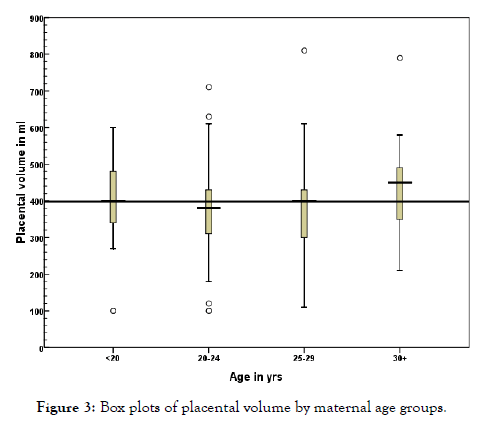
Box plots of placental volume by maternal age in Figure 3 reveal that the overall median reference line of the placental volume was at 400 ml. Placental volume did not exhibit any consistent relation with maternal age. The median of placental volume in four groups of maternal age (<20, 20-24, 25-29, 30+) were at 400, 380, 400 and 450 ml respectively.

Figure 3. Box plots of placental volume by maternal age groups.
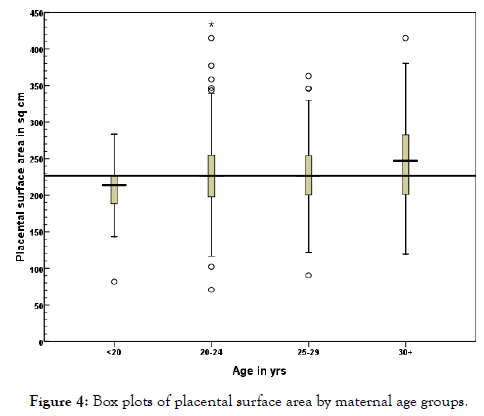
Box plots of placental surface area by maternal age in Figure 4 reveal that the overall median reference line of the placental surface area was at 226 cm sq. The placental surface area did not exhibit any consistent relation with maternal age. The median of placental surface area in four groups of maternal age (<20, 20-24, 25-29, 30+) were at 213.7, 226.3, 226.3 and 247.1 ml respectively. The medians of placental surface area in second and third groups of maternal age were coinciding with overall median.

Figure 4. Box plots of placental surface area by maternal age groups.
In the present study, the age range was from 17-35 years with the mean and SD of 23.6 and 3.7 years. The studies conducted at Croatia [10], Nigeria [11] and Norway [12] specified the age range of pregnant women as 17-42 years, 16-38 yrs and 19-42 years respectively. The age range of the present study was lower than above studies but was in accordance with Mysore Parthenon study [13].
In the present study maximum 84.9 percent were in the age group 20 to 29 years and 7.6 percent were above 30 years of age, whereas another study conducted in Manchester observed 54.9 percent mothers in age group between 20-29 years and 45.1 percent mothers in age group more than 30 years, moreover this study infers that on an average Indian and Asian women were in more younger group during delivery [5].
This study observed 7.4 percent of pregnant women within the age of 20 years (teenagers) and mean maternal age was and SD of 23.6 years and 3.7 whereas a study from Karachi specified 11.1 percent of teenage mothers [8]. In the present study the rate of teenage pregnancy was low, due to the awareness in society regarding teenage marriages and early pregnancy adverse outcomes.
Hayward et al., reported that there was no difference in placental weight between adult and teenage pregnancy [14] This result was consistent with the present study. Maternal growth influences placental function rather than development. Therefore, villous areas, syncytial areas, fibrin content, vascularisation and cell turn over did not differ between growing and non-growing teenagers [15].
The study concludes that in different groups of maternal age the percentiles of birth weight exhibited consistent increasing trends only in higher percentiles (75th to 95th) and maternal age <20 years exhibited lowest birth weight than other groups. Percentiles of placental morphometry did not exhibit a consistent relationship with maternal age, except the 5th and 50th percentile of placental weight and 25th percentile of placental surface area.
The current study results need re-validation in higher settings of society with a large number of population.
Citation: Balihallimath RL, Jayalaxmi MK, Gan AM, Tyagi NK (2019) Percentiles of Pregnancy Outcomes with Maternal Age. Anat Physiol 9:317. doi: 10.35248/2161-0940.19.9.317
Received: 19-Aug-2019 Accepted: 11-Sep-2019 Published: 17-Sep-2019 , DOI: 10.35248/2161-0940.19.9.317
Copyright: © 2019 Balihallimath RL, et al. This is an open-access article distributed under the terms of the Creative Commons Attribution License, which permits unrestricted use, distribution, and reproduction in any medium, provided the original author and source are credited.
Sources of funding : Self Funded