Journal of Oceanography and Marine Research
Open Access
ISSN: 2572-3103
ISSN: 2572-3103
Research Article - (2023)Volume 11, Issue 1
Some aspects of the physiology of the corals Seriatopora hystrix and Lobophyllia corymbosa from the Red sea are described in this paper. The two species were selected on the basis of their different responses to seasonal changes. At the study site, the lowest mean of seawater temperature is 27.42°C and 27.17°C at 5 m and 10 m depths respectively during winter, while the maximum mean of seawater temperature was 32.67°C and 31.17°C in 5 m and 10 m depths respectively during summer. The mean density of the skeleton of both species was identical at 2.5 ± 0.16 (10) g.cm-3 and 2.75 ± 0.05 (10) g.cm-3 respectively. The mean surface area (cm2g-1 skeleton) was higher in L. corymbosa 4.73 ± 2.31 (10) cm2g-1 skeleton than S. hystrix 3.58 cm2 g-1 ± 1.2 (10) cm2g-1 skeleton with no significant difference. The mean dry tissue weight g-1 skeleton in summer at 5 m depth was higher in L. corymbosa 39.6 ± 24.9 (10) mg.d.t.g-1 skeleton than S. hystrix 24.9 ± 16.4 (10) mg.d.t.g-1 skeleton and was significantly different (t-test P ≤ 0.03). While in summer at 10 m depth was higher in L. corymbosa 45.49 ± 14.00 (10) mg.d.t.g-1 skeleton than S. hystrix 24.9 ± 19.6 (10) mg.d.t.g-1 skeleton and was significantly different (t-test P ≤ 0.01). There was a significant seasonal difference in the numbers of zooxanthellae of both the species at two different depths on the basis of biomass and surface area (t-test p<0.005). L. corymbosa, had a lower number of zooxanthellae 0.05 × 10⁵, 0.43 × 10⁵, 0.06 × 10⁵ and 0.46 × 10⁵ mg-1 dry tissue weight than S. hystrix 0.19 ×10⁵, 5.1 ×10⁵, 0.27 × 10⁵ and 9.59 × 10⁵ mg-1 dry tissue weight in two season and two depths respectively. S. hystrix had higher number of zooxanthellae in 5 m depth both in summer and winter respectively (1.2 × 10⁵, 19.09 × 105 cm-2) and in 10 m depth it was 1.6 × 10⁵ and 25.7 × 105 cm-2 in summers and winter than the L. corymbosa. At 5 m depth, the observed zooxanthellae of L. corymbosa were 0.50 × 10⁵ in summer and 3.51 × 105 cm-2 in winter and it was 0.58 × 10⁵ in summer and 4.42 × 105 cm-2 in winter respectively. The mean respiration rate of whole colonies of S. hystrix was higher than that of L. corymbosa at the same depths both in summer and winter. The mean dark respiration rate decreases with increasing depths. The mean photosynthesis vs. irradiance curves of S. hystrix and L. corymbosa were plotted to the hyperbolic tangent function for summer and winter season (5 m and 10 m depths). The growth rate was linear during each period of measurement during summer, the highest mean daily skeletal growth rate of S. hystrix was 2.3 ± 1.3 (20) mg .skel.d-1 in 10 m depth and it was 1.6 ± 0.5 (21) mg .skel.d-1 at 5 m depth. Whilst during winter, the lowest was 1.9 ± 0.96 (20) mg.skel.d-1 at 10 m and also lowest (1.5 ± 0.7 (20) mg .skel. d-1) at 5 m depth. The growth rate of the two species was lower in the winter than in summer.
Coral reefs; Zooxanthellae; Photosynthesis; Dark respiration; Red sea
Coral reefs are one of the most interesting environments due to their enormous biodiversity. Corals, which are members of the phylum Coelenterata, class Anthozoa, sub class Hexacorallia and order Scleractinia, are the dominant species. The Scleractinia has been divided into hermatypic and ahermatypic. The terms are usually used by biologists to distinguish between corals with or without symbiotic algae (zooxanthellae) respectively. The majority of hermatypes is reef building and lives usually in shallow water, whilst the hermatypes are non-reef building, and are often found in deep water.
Hermatypic corals are restricted to tropical and sub-tropical seas where the temperature is not lower than 18°C, with optimal reef development between 25℃ and 29°C this is expressed in latitudinal patterns of coral reefs distribution and diversity. Rising seawater temperature is one of the greatest threats to the persistence of coral reefs. In 1998, an estimation of 16% of the world's living corals were eliminated in a single warming event related to El Nino, during this event, sea temperatures warmed to 2℃-3℃ above long term average summer temperatures and resulted in a catastrophic "bleaching" event that caused significant mortality of many species of coral. The impacts of this thermal event decrease the percent living coral cover of shallow reef worldwide [1].
There are three main metabolic processes in corals:
• Photosynthesis (CO2 consumption and O2 release).
• Respiration (O2 consumption and CO2 release).
• Biogeogenic process of calcification (deposition of CaCO3).
These processes are interconnected in corals.
Zooxanthellae of scleractinian corals have been grouped into clades. In recent studies, clade "D" was found in P. verrucosa from Eastern Pacific reefs, while clade "C" was found in P. damicornis. The work of Baker, et al., suggests that members of clades D may have greater thermal tolerances than clade C in their zoanthid samples of Palythoa caribaeorum. Clade A and B inhabit shallow water colonies, while clade C zooxanthellae are found in deeper water colonies, or in shaded areas of the same individual coral colony [2-4].
The term bleaching refers to the disruption of the coral algae symbiosis caused by the loss of photopigments or endosymbiotic dinoflagellates from the animal tissues. During the phenomenon of bleaching in August 1998 some coral species such as P. damicornis had less resistance against bleaching than P. verrucosa due to the unusual high seawater temperature and calm sea condition. Nakamura, et al., reported that the dark respiration rate of the coral species Acropora pruinosa was higher in winter than in summer, especially in the temperature range from 20℃-30℃. Moreover Coles, et al., showed very high response in metabolic rate with temperature change in corals P. damicornis, Montipora verrucosa, Porites compressa and Fungia scutaria over the range 19°C-31°C in Hawaii and Enewetak.
Through previous studies, it is clear to us that different species of corals have different autotrophic photosynthesis and heterotrophic feeding abilities in addition to different tissue biomass and lipid concentrations.
Growth of scleractinian corals can be divided in two mechanisms: First, skeletal growth due to the deposition of an external skeleton of calcium carbonate by the synthesis of an organic matrix, a process called as calcification, and the second one is the tissue growth. According to the light enhanced calcification theory, the symbiosis with zooxanthellae is helping the process of skeletal growth. According to this theory, calcification of the coral host is enhanced by photosynthesis of zooxanthellae. Certainly, on average, calcification in light is found to be around three times higher than calcification in darkness. However, the growth rate of hermatypic corals is influenced by external factors such as light quality and intensity, temperature and sedimentation and by internal factors such as reproduction, genetics and growth form of colony, number or type of zooxanthellae.
Photosynthesis and calcification are spatially separated processes (photosynthesis occurs in the oral tissue layer and calcification in the aboral tissue layer), they do share a common pool of inorganic carbon inside the coelenteron of the coral host, accounting for the interaction between these two processes, the exact mechanisms of the enhancement of calcification by photosynthesis are still a matter of debate (Some of the proposed mechanisms include that: Photosynthesis provides energy for the energy demanding processes associated with calcification, such as calcium transport and organic matrix synthesis and photosynthesis raises intracellular pH and intracellular saturation state of calcium carbonate, thereby favoring the precipitation of calcium carbonate [5-8].
The main objective of this study was, to compare the respiration, photosynthesis, growth and their sensitivity range of Seriatopora hystrix and Lobophyllia corymbosa to the environmental factors during two seasons (summer and winter). Results obtained this study will improve our knowledge on the ecology and physiology of Red sea corals.
The study was carried out in the onshore laboratory of the faculty of marine sciences, King Abdulaziz university, Jeddah, which is located adjacent to the fringing reefs of an inlet, Obhur creek, away from the North of the city Creek. The study site was located at the mouth of the creek on its Northern shore, at the water depths of 5 m and 10 m. Specimens of S. hystrix and L. corymbosa were collected at these depths.
Measurement of environmental parameters
Water temperature was measured in situ by using two maximum and minimum thermometers attached to the reef in a shaded location. They were read at monthly intervals from July 2009 to Jun 2010. Underwater down dwelling UV temperature loggers (HOBO) launch devices (model UA-002-64) were setup in the lab using the HOBOware® Pro software. The sampling intervals were of 15 min and the total recording light is one day in summer 2010 and during winter 2010. The recording time start at 06:00 pm to 06:00 am measuring Photo synthetically Active Radiation (P.A.R) between 400 nm and 700 nm (Figure 1).
Figure 1: Red sea map and Location of Obhur Creek which lies in the north of Jeddah City.
Note: The study site is marked (ta ) the Entrance of Obhur Creek
Specimen preparation
Freshly collected colonies of the two species (S. hystrix and L. corymbosa) were used to make coral nubbins. Similar size regular shaped branch tips of S. hystrix were broken off and the surfaces ground flat to yield tips of 2.5 cm-3 cm height. These were attached to pre weighted 3 cm × 3 cm acrylic tiles, using a small quantity of cyanoacrylate adhesive. Similar sized pieces of L. corymbosa, with more irregular growth form, were made in to nubbins in the same way. They were then placed on racks and returned to the reef to recover for at least once in a week.
Dark respiration
Respiration oxygen uptake of nubbins was measured in darkness using spirometer cell immediately before the commencement of a photosynthesis run. Respiration rate was linear with production of O2 over the 100% to 90% saturation levels that were used for the determination. Dark respiration values were added to the net photosynthesis values to obtain gross photosynthesis.
Respiration rate of Zooxanthellae were determined on freshly isolated sample, from nubbins that had been maintained in darkness for 12 h coral tissue was removed with a water pick, and the slurry was centrifuged at 2000 x g for 1 min. Further separation was achieved with a hand-held potter homogenizer, after which the suspension was centrifuged, washed with seawater thrice and re-suspended in 1 ml of filtered seawater. The rate of oxygen uptake was measured in darkness in an RC 300 respirometer cell (Strathkelvin instrument) with a 1302 paleographic oxygen electrode. Zooxanthellae concentrations within the cell were measured on a subsample using haemacytometer [9,10].
Photosynthesis
Nubbins were placed in water jacketed clear acrylic closed spirometer cell with a water volume of 128 ml. Oxygen flux was detected by a polarography oxygen electrode (Strathkelvin instruments, 1302) connected to an oxygen meter. Light was provided by a bank of overhead fluorescent lambs whose output was varied between 25 and 300 μE m-2 sec-1 by mean of a variable transformer. Net oxygen production rates were normalized to dry weight of coral tissue, mean values derived at each irradiance value and best fit curves for the plots of net ( P v I) were obtained using a hyperbolic tangent function curve fitting program.
Growth
Nubbins were placed on racks at 5 m and 10 m in the experimental sites on the fringing reef of S. hystrix and L. corymbosa, after taking the buoyant weight using a precise 120 A balance. They were returned to the laboratory for reweighing after intervals of approximately seven days. Growth rates were determined in summer 2009 and winter 2010 and were expressed in mg skeleton d-1.
The monthly maximum and minimum mean temperatures of the study sites are given in Figures 2 and 3. The lowest temperature observed was 27.42°C ± 0.80°C and in March 2010 and the highest observed temperature was 32.67°C ± 0.29°C during August 2009. The mean difference between the maximum and minimum readings was 2.5℃. The daily maximum variation of light intensity of Photo synthetically Active Radiation (P.A.R) and the duration are shown in the Figures 4 and 5. The P.A.R of daily light curve was maximum in the summer with the value of 512 μE s-1 m-2 and minimum in the winter with a value of (389 μE s-1 m-2) [11-14].
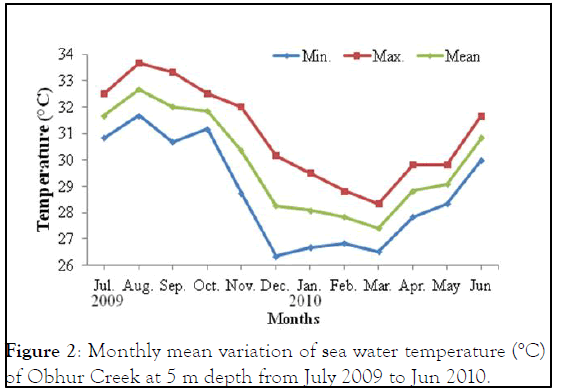
Figure 2: Monthly mean variation of sea water temperature (°C) of Obhur Creek at 5 m depth from July 2009 to Jun 2010.
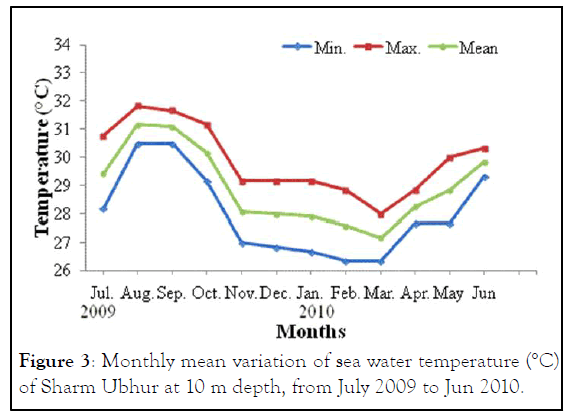
Figure 3: Monthly mean variation of sea water temperature (°C) of Sharm Ubhur at 10 m depth, from July 2009 to Jun 2010.
Skeleton and biomass characteristics
Skeleton and biomass characteristics of S. hystrix and L. corymbosa are shown in. The mean density of the skeleton of both species was identical at 2.5 ± 0.16 (10) g.cm-3 and 2.75 ± 0.05 (10) g.cm-3 respectively. The mean surface area (cm2g-1 skeleton) was higher in L. corymbosa 4.73 ± 2.31 (10) cm2g-1 skeleton than S. hystrix 3.58 ± 1.2 (10) cm2 g-1 skeleton with no significant difference. The mean dry tissue weight g-1 skeleton in summer at 5 m depth was higher in L. corymbosa 39.6 ± 24.9 (10) mg.d.t.g-1 skeleton than S. hystrix 24.9 ± 16.4 (10) mg.d.t.g-1 skeleton and was significantly different (t-test P ≤ 0.03). While in summer at 10 m depth was higher in L. corymbosa 45.49 ± 14.00 (10) mg.d.t.g-1 skeleton than S. hystrix 24.9 ± 19.6 (10) mg.d.t.g-1 skeleton and was significantly different (t-test P ≤ 0.01). On the other hand the mean dry tissue weight per g. skeleton in winter at 5 m depth was higher in L. corymbosa 36.9 ± 4.9 (10) mg.d.t.g-1 skeleton than S. hystrix 13.3 ± 4.9 (10) mg.d.t.g-1 skeleton and was significantly different (t-test P ≤ 0.001). While in winter at 10 m depth was higher in L. corymbosa 44.1 ± 15.00 (10) mg.d.t.g-1 skeleton than S. hystrix (Figure 4).
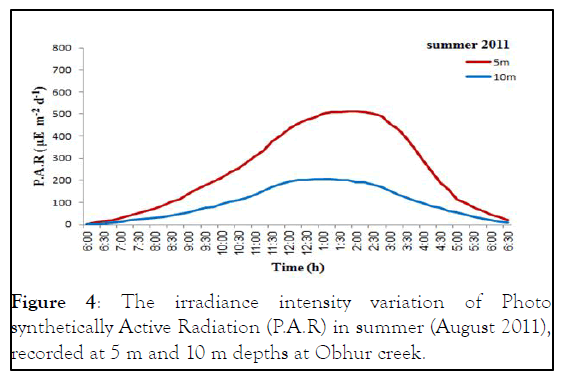
Figure 4: The irradiance intensity variation of Photo synthetically Active Radiation (P.A.R) in summer (August 2011), recorded at 5 m and 10 m depths at Obhur creek.
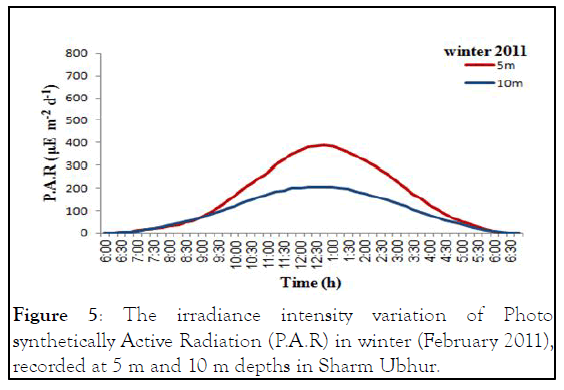
Figure 5: The irradiance intensity variation of Photo synthetically Active Radiation (P.A.R) in winter (February 2011), recorded at 5 m and 10 m depths in Sharm Ubhur.
11.7 ± 5.8 (10) mg.d.t.g-1 skeleton and was significantly different (t-test P ≤ 0.0001) relative biomass between the two species and two season (Figure 5). The values remain significantly different when they were expressed on a surface area basis, i.e., 9.17 ± 3.97 (10) mg.d.t.cm-2 higher in L. corymbosa than S. hystrix 7.81 ± 5.82 (10) mg.d.t.cm-2 in summer at 5 m depth and was not significantly difference. While in summer at 10 m depth, it was higher in L. corymbosa 11.05 ± 4.91 (10) mg.d.t.cm-2 than S. hystrix 7.7 ± 6.6 (10) mg.d.t.cm-2 and was no significantly different. While in winter at 5 m depth it was higher in L. corymbosa 8.16 ± 2.43 (10) than S. hystrix 4.14 ± 2.0 (10) mg.d.t.cm-2 and was significantly different (t-test P ≤ 0.001). However, in winter at 10 m depth it was higher in L. corymbosa 11.57 ± 7.26 (10) than S. hystrix 3.32 ± 1.6 (10) mg.d.t.cm-2 and is significantly different (t-test P ≤ 0.003) between the two species and two season [15-19].
There was a significant seasonal difference in the numbers of zooxanthellae of both the species at two different depths on the basis of biomass and surface area (t-test p<0.005). L. corymbosa, had a lower number of zooxanthellae 0.05 × 10⁵, 0.43 × 10⁵ , 0.06 × 10⁵ and 0.46 × 10⁵ mg-1 dry tissue weight than S. hystrix 0.19 × 10⁵, 5.1 ×10⁵ , 0.27 × 10⁵ and 9.59 × 10⁵ mg-1 dry tissue weight in two season and two depths respectively. S. hystrix had higher number of zooxanthellae in 5 m depth both in summer and winter respectively (1.2 × 10⁵, 19.09 × 105 cm-2) and in 10 m depth it was 1.6 × 10⁵ and 25.7 × 105 cm-2 in summer and winter than the L. corymbosa. At 5 m depth, the observed zooxanthellae of L. corymbosa were 0.50 × 10⁵ in summer and 3.51 × 105 cm-2 in winters and it was 0.58 × 10⁵ in summer and 4.42 × 105 cm-2 in winter respectively (Table 1).
| Characteristic | S. hystrix | L. corymbosa | t-test | P-value | |
|---|---|---|---|---|---|
| Skeleton skeletal density | |||||
| (g.cm³) | 2.5 ± 0.16 (10) | 2.75 ± 0.1 (10) | 3.97* | 0.001 | |
| Biomass colony | |||||
| mg.d.t.g-1 | (5 m) (in sum) | 24.9 ± 16.4 (10) | ± 39.611 (10) | 2.34* | 0. 031 |
| skeleton | (10 m) (in sum) | 24.9 ± 19.6 (10) | 45.49 ± 14 (10) | 2.72* | 0.014 |
| mg.d.t.g-1 Superscript(1) | (5 m) (in wint.) | 13.3 ± 4.9 (10) | 36.9 ± 4.9 (10) | 4.19* | 0.001 |
| skeleton | (10 m) (in wint.) | 11.7 ± 5.8 (10) | 44.1 ± 15 (10) | 6.33* | 0.0001 |
| cm-2.g-1 skeleton | - | 3.58 ± 1.2 (10) | ± 4.732,31 (10) | 1.39 | 0.182 |
| mg.d.t.cm² | (5 m)(in sum) | ± 7.815.82 (10) | ± 9.173.97 (10) | 0.59 | 0.563 |
| (10 m)(in sum) | ± 7.76.6 (10) | ± 11.024,91 (10) | 1.26 | 0.22 | |
| mg.d.t.cm² | (5 m) ( in wint.) | 4.14 ± 2.0 (10) | 8.16 ± 2.43 (10) | 4.00* | 0.001 |
| (10 m) (in wint.) | ± 3.321.6 (10) | ± 11.577,26 (10) | 3.51* | 0.003 | |
| Zooxanthellae | |||||
| No. 106 g-1 | (5 m) (in sum.) | 0.4 ± 0.17 (10) | 0.19 ± 0.7 (10) | 3.53* | 0.0001 |
| skeleton | (10 m) (in sum.) | ± 0.50.17 (10) | 0.0 0.237 (10) | 5.37* | 0.002 |
| No.106 g | (5 m) (in wint.) | ± 6.22.3 (10) | ± 1.40.5 (10) | 6.33* | 0.0001 |
| skeleton | (10 m) (in wint.) | 8.04 ± 3.0 (10) | 1.88 ± 0.6 (10) | 6.265* | 0.0001 |
| No.105.mg d.t | (5 m) (in sum) | 0.19 ± 0.09 (10) | 0.05 ± 0.02 (10) | 6.61* | 0.0001 |
| (10 m) (in sum.) | 0.27 ± 0.14 (10) | ± 0.060.02 (10) | 4.15* | 0.001 | |
| No.105.mg-1 d.t | (5 m) (in wint.) | 5.1 ± 3.1 (10) | ± 0.43 0.18 (10) | 4.41* | 0.0001 |
| (10 m) (in wint.) | 9.59 ± 7.1 (10) | 0.46 ± 0.16 (10) | 4.23* | 0.001 | |
| No. 105.cm2 | (5 m) ( in sum) | 1.2 ± 0.6 (10) | 0.50 ± 0.27 (10) | 3.32* | 0.004 |
| (10 m) (in sum.) | 1.6 ± 0.67 (10) | 0.58 ± 0.26 (10) | 4.47* | 0.0001 | |
| No. 105.cm² | (5 m) (in wint.) | 19.09 ± 8.9 (10) | 3.51 ± 1.86 (10) | 5.43* | 0.0001 |
| (10 m) (in wint. | 25.7 ± 12.9 (10) | 4.42 ± 1.53 (10) | 5.18* | 0.0001 | |
Note: *Significance (P ≤ 0.05) *Sum=Summer, Wint=Winter
Table 1: The mean skeletal and tissue biomass colony of S. hystrix and L. corymbosa at the study site recorded at 5 m and 10 m depths during summer and winter.
Dark respiration
Colony: The colony respiration mean values of both species were estimated using tissue biomass and surface area.
Species variations: The mean respiration rate of whole colonies of S. hystrix was higher than that of L. corymbosa at the same depths both in summer 2009 and winter 2010. The difference was significant in all cases. The difference significant was found when making similar comparisons on the rate of respiration of freshly isolated zooxanthellae at (t-test p ≤ 0.05).
Seasonal variations
Seriatopora hystrix : In S. hystrix, the average rate of dark respiration was higher 4.56 ± 2.29 (10) μl O2 mg-1.d.t h-1 during summer (32℃) than winter (30℃) season (3.164 ± 1.32 (11) μl O2 mg-1.d.t h-1) at 5 m depth. But the variation was not significant at this 5 m depth. The surface area value was lower (16.97 ± 8.54 (10) μl O2 cm-2 h-1) during summer (32℃) than the winter (30℃) season (22.01 ± 9.194 μl O2 cm-2 h-1). With no significant difference at the 5 m depth. It was also higher in summer (31℃) at 10 m depth 2.477 ± 1.143 (10) μl O2 mg-1.d.t h-1, than the winter (29℃), 1.432 ± 0.553 (10) μl O2 mg-1.d.t h-1. The difference was significant at the 10 m depth (t-test p ≤ 0.01). The surface area comparison studies revealed that it was lower (8.09 ± 3.728 (10) μl O2 cm-2 h-1) during summer (31℃) than the (9.958 ± 3.842 (10) μl O2 cm-2 h-1) winter (29℃). The surface area difference was not significant in the 5 m and 10 m depths.
Lobophyllia corymbosa : The mean rate of the dark respiration was higher 1.035 ± 0.469 (10) μl O2 mg-1 d. t. wt. h-1 during summer (32°C) than winter (30°C) 0.844 ± 0.3823 (11) μl O2 mg-1 d. t. wt. h-1, at 5 m depth. The difference was no significant at depth. On basis of surface area, the values show higher in summer (32°C) 8.082 ± 3.67 (10) μl O2 cm-2.h-1, and winter (30° C), 5.871 ± 2.135 (10) μl O2 cm-2.h-1, at the same depth, with no significant difference. The mean rate of dark respiration on biomass and basis of surface area were considerably lower, 0.618 ± 0.113 (14) μl O2 mg-1 d.t.wt.h-1, (5.761 ± 1.054 (10) μl O2 cm-2. h-1), during summer (31℃) than 0.471 ± 0.091 (14) μl O2 mg-1 d. t. wt. h-1, (3.167 ± 2.128 (11) μl O2 cm-2 h-1), during winter (29℃) at 10 m.
Depth variations
Seriatopora hystrix : The mean rate of dark respiration was significantly higher at 5 m depth, 4.563 (summer 32°C) and 3.164 (winter 30°C) μl O2 mg-1 d. t. wt. h-1 than at 10 m 2.477 (summer 31°C) and 1.432 (winter 29°C) μl O2 mg-1 d. t. wt. h-1 (t-test p ≤ 0.005 summer and t-test p ≤ 0.001 in winter).
Lobophyllia corymbosa:The mean value of oxygen consumption decreases with increasing depth 1.035 ± 0.469 (10) during summer at 5 m depth and 0.618 ± 0.113 (14) μl O2 mg-1 d. t. wt. h-1 at 10 m and increasing with decreases depth 0.844 ± 0.3823 (11) and 0.471 ± 0.0.91 (14) at 5 m and 10 m during winter respectively. There was a significant difference during summer whilst during winter there was no significant difference.
Zooxanthellae: The mean rate of dark respiration of zooxanthellae on the basis of tissue biomass and the surface area.
Seasonal variation
Seriatopora hystrix: On the basis of tissue biomass, the average rate of respiration was lower 0.0675 ± 0.030 (10) μl O2 mg-1 d. t. wt. h-1 in summer (32°C) than the winter (30°C) 0.779 ± 0.274 (10) μl O2 mg-1 d. t. wt. h-1 at 5 m depth. These results were significantly varied at 5 m depth. In the case of surface area, the results were lower and significantly varied in summer (32°C) 0.467 ± 0.212 (10) μl O2 cm-2 h-1 than in winter (30°C) 2.88 ± 1.014 (10) μl O2 cm-2h-1, at 5 m depth (Table 2). In the case of 10 m depth, the value was 0.0569 ± 0.0196 μl O2 mg-1 d.t.wt.h-1 (10) in summer (31°C) and 0.1918 ± 0.098 (11) μl O2 mg-1 d.t.wt.h-1 in winter (29°C) respectively. The difference in the value was apparently significant. In addition, the surface area was lower (0.39 ± 1.357 (10) μl O2 cm-2h-1) in summer (31°C) season than (4.669 ± 2.39 (12) μl O2 cm-2h-1) the winter (29°C) at 10 m depth. The surface area variation was a significantly different at 10 m depth.
Lobophyllia corymbosa: The average rate of zooxanthellae respiration was lower (0.0865 ± 0.015 (10) μl O2 mg-1 d.t.wt.h-1) in summer (32°C) and higher (0.2537 ± 0.16 (10) μl O2 mg-1 d.t.wt.h-1) in winter (30°C) at 5 m depth. The seasonal difference of the zooxanthellae was significantly varied. The surface area of value was significantly lower 0.724 ± 0.130 (10) μl O2 cm-2 h-1 in summer (32°C) and higher 1.982 ± 1.275 (12) μl O2 cm-2 h-1 in winter (30°C) in the 5 m depth. Similarly at 10 m depth, the respiration value was lower 0.0305 ± 0.0119 (10) μl O2 mg-1 d.t.wt.h-1 in summer (31°C) and higher 0.1264 ± 0.0342 (10) μl O2 mg-1 d. t. wt. h-1 in winter (29°C). This was also significantly varied as shown in the Table 3,4. In 10 m depth, the surface area was lower 0.303 ± 0.114 (11) μl O2 cm-2h-1 in the summer (31°C) higher 1.177 ± 0.325 (10) μl O2 cm-2h-1 in the winter (29°C). There was significant difference observed between the summer and winter season.
Depth variations
Seriatopora hystrix: The mean dark respiration rate decreases with increasing depths. In summer, the value was higher 0.0675 μl O2 mg-1 d.t.wt.h-1 at 10 m depth and lower 0.0569 μl O2 mg-1 d.t.wt.h-1 at 5 m depth, but it was not significantly different. In winter at 5 m depth, the dark respiration rate was higher 0.779 μl O2 mg-1 d.t.wt.h-1 and lower 0.192 μl O2 mg-1 d.t.wt.h-1 at 10 depths. There was a significant difference between 10 m depth.
Lobophyllia corymbosa: The zooxanthellae of this species showed the same pattern of respiration rates which decrease with increasing depths, the rates was lower at 5 m, during both season 0.0865 and 0.2537, and higher at 10 m, 0.0305 and 0.1264 μl O2 mg-1 d.t.wt.h-1 during summer and winter respectively. There was a significant difference between the two depths during summer but no significant difference in winter (Table 2).
| Dark Respiration | Depth (m) | S. hystrix summer 2009 | Winter 2010 | t-test | p-value | Summer 2009 | L. corymbosa winter 2010 | t-test | p-value |
|---|---|---|---|---|---|---|---|---|---|
| Colony | 5 | 4.563 | 3.164 | 1.035 | 0.844 | ||||
| S.D ± ul O2 cm2 | 2.296 (10) 16.974 | 1.321 (11) 22.01 | 1.732 | 0.099 | 0.469 (10) 8.082 | 0.3823 (11) 5.871 | 1.034 | 0.312 | |
| S.D ± ul O2 mg-1.d.th | 10 | 8.544 (10) 2.477 | 9.194 (11) 1.432 | 1.061 | 0.303 | 3.667 (10) 0.618 | 2.135(10) 0.471 | 1.649 | 0.117 |
| S.D ± ul O2 cm2 | 1.143 (10) 8.09 | 0.553 (10) 9.958 | 2.6* | 0.018 | 0.113 (14) 5.761 | 0.091 (14) 3.167 | 3,07* | 0.006 | |
| S.D ± Zooxanthellae ul O2 mg.d.th | 5 | 3.728 (10) 0.0675 | 3.842 (10) 0.7799 | 1.103 | 0.284 | 1.054 (10) 0.0865 | 2.128 (11) 0.2537 | 3.481* | 0.003 |
| S.D ± ulO2 cm2 | 0.0308 (10) 0.4671 | 0.2746 (10) 2.881 | 9.683* | 0.0001 | 0.0156 (10) 0.724 | 0.1633 (10) 1.982 | 3.215* | 0.004 | |
| S.D ± plO2 mg 1.d.th | 10 | 0.2129 (10) 0.0569 | 1.0143 (11) 0.1918 | 7.365* | 0.0001 | 0.130 (10) 0.0305 | 1.275 (12) 0.1264 | 3.09* | 0.006 |
| S.D ± ulO2cm2 h-1 | 0.0196 (10) 0.3939 | 0.098 (10) 4.669 | 4.268* | 0.001 | 0.0119 (10) 0.303 | 0.0342 (10) 1.177 | 8.371* | 0.0001 | |
| S.D ± | 0.1357 (10) | 2.391 (12) | 5.626* | 0.0001 | 0.114 (11) | 0.325 (10) | 8.395 | 0.0001 |
Table 2: The mean dark respiration of whole nubbins and of freshly isolated zooxanthellae of S. hystrix and L. corymbosa at different depths (5 m, 10 m) and seasons (summer and winter) at Sharm Ubhur.
| Nubbins | S. hystrix | L. corymbosa | t-test | p-value |
|---|---|---|---|---|
| Respiration summer 2009 | ||||
| 5 m V 5 m | 4.563 | 1.035 | 4.758* | 0.0001 |
| 10 m V 10 m | 2.476 | 0.618 | 5.184* | 0.0001 |
| Winter 2010 | ||||
| 5 m V 5 m | 3.164 | 0.846 | 6.896* | 0.0001 |
| 10 m V 10 m | 1.432 | 0.471 | 2.339* | 0.029 |
| Photosynthesis summer 2009 | ||||
| 5 m V 5 m | 8.197 | 2.5941 | 3.388* | 0.003 |
| 10 m V 10 m | 6.4339 | 2.067 | 4.727* | 0.0001 |
| Winter 2010 | ||||
| 5 m V 5 m | 8.713 | 0.952 | 6.104* | 0.0001 |
| 10 m V 10 m | 4.145 | 2.379 | 2.384 | 0.226 |
| Zooxanthellae summer 2009 | ||||
| 5 m V 5 m | 4.15 | 17.84 | 11.58* | 0.0001 |
| 10 m V 10 m | 2.69 | 5.11 | 2.98 | 0,08 |
| Winter 2010 | ||||
| 5 m V 5 m | 2.43 | 7.59 | 8.53* | 0.0001 |
| 10 m V 10 m | 1.73 | 2.97 | 4.23* | 0.0001 |
Note: *significance (P ≤ 0.05)
Table 3: Comparison of dark respiration, maximum gross photosynthesis (Pgmax) rate of nubbins (µl O2 mg-1.d.t h-1) and respiration rate of freshly isolated zooxanthellae (µl O2 10-6 h-1) of S. hystrix and L. corymbosa.
Photosynthesis
The mean photosynthesis vs. irradiance curves of S. hystrix and L. corymbosa were plotted to the hyperbolic tangent function for summer 2009 and winter 2010 season (5 m and 10 m depths).
Species variations: S. hystrix had a maximum gross photosynthesis (Pgmax) in the winter season ranging from 4.145 ± 2.402 (10) μl O2 mg-1 d.t.wt.h-1 at 10 m depth to 8.712 ± 4.2114 (11) μl O2 mg-1 d. t. wt. h-1 at 5 m depth. In the summer season it was ranging from 6.4339 ± 2.892 (10) μl O2 mg-1 d.t.wt.h-1) at 10 m depth to 8.1965 ± 5.144 (10) μl O2 mg-1 d.t.wt.h-1 at 5 m depth. In the case of L. corymbosa, the maximum gross photosynthesis of the winter season was in the range of (0.9515 ± 0.222 (10) μl O2 mg-1 d.t.wt.h-1 at 5 m depth, to 2.379 ± 1.1915 (14), μl O2 mg-1 d. t.wt.h-1 at 10 m depth. In summer season, it was ranging from 2.067 ± 0.4127 (10) μl O2 mg-1 d.t.wt. h-1) at 10 m depth to 2.594 ± 0.094 (10) μl O2 mg-1 d.t.wt.h-1) at 5 m depth. The difference was significant between both species at each depth during the summer (t-test p ≤ 0.005), but not significant during winter (t-test p<0.001).
Seasonal variation
Seriatopora hystrix : The mean maximum gross photosynthesis (Pgmax), rates during summer were slightly lower 8.1965 ± 5.144 (10) μl O2 mg-1 d.t.wt.h-1 than the gross photosynthesis 8.7129 ± 4.211 (11) μl O2 mg-1 d.t.wt.h-1 of the winter season at 5 m depth. They were not significantly different. In the case of 10 m depth, the values were higher in summer 6.4339 ± 2.89 (10) μl O2 mg-1 d.t.wt.h-1 than in winter 4.145 ± 2.40 (10) μl O2 mg-1 d.t.wt.h-1 but they were not significantly different.
Lobophyllia corymbosa : The mean maximum gross photosynthesis (Pgmax) was higher 2.594 ± 0.094 (10) μl O2 mg-1 d.t.wt.h-1 during summer while compared with the winter season (0.9515 ± 0.222 (11) μl O2 mg-1 d.t.wt.h-1) at 5 m depth. It was significantly higher during winter than the summer.
At 10 m depth, the average maximum gross photosynthesis rate in summer, 2.067 ± 0.4127 (10) μl O2 mg-1 d.t.wt.h-1 was not significantly different from the winter value 2.379 ± 1.1915 (10) μl O2 mg-1 d.t.wt.h-1.
Depth variations
Seriatopora hystrix : The mean maximum gross photosynthesis (Pgmax) was significantly higher in summer at 5 m depth, 8.1965 ± 5.1444 (10) when compared with 10 m depth 6.4339 ± 2.892 (10) μl O2 mg-1 d.t.wt.h-1. Whilst the gross photosynthesis (Pgmax) at 5 m depth during winter was maximum (8.7129 ± 4.2114 (11) μl O2 mg-1 d.t.wt.h-1), and was not significantly different from 4.145 ± 2.402 (10) μl O2 mg-1 d.t.wt.h-1 at 10 m depth.
Lobophyllia corymbosa : The gross photosynthesis was maximum (2.594 ± 0.094 (10) μl O2 mg-1 d.t.wt.h-1) 5 m depth in summer and minimum (2.067 ± 0.4127 (10) μl O2 mg-1 d.t.wt.h-1) during summer at 10 m depth respectively. They were not significantly different in summer. Whilst in winter season, the minimum gross photosynthesis (0.9515 ± 0.222 (11) μl O2 mg-1 d.t.wt.h-1) was observed in the 5 m depth and was significantly different than the maximum (2.379 ± 1.1915 (14) μl O2 mg-1 d.t.wt.h-1) observed at 10 m depth.
Characteristics of the (P v I) curve
Seriatopora hystrix : The mean values for α indicated that the zooxanthellae of could slightly utilize the light during the winter 0.0724 ± 0.0614 (11) at 5 m depth and also at 10 m depth 0.0231 ± 0.0133 (10). But in summer it utilized more light 0.0455 ± 0.0294 (10) at 5 m depth and also more (0.042 ± 0.0163 (10) μl O2 mg-1.d.t h-1/μE s-1m-2) at 10 m depth.
The differences were not significantly different in seasons. During the summer and winter season, the α curve was also slightly higher at 5 m depth than the 10 m depth. The α values were not significantly different according to the depths.
Lobophyllia corymbosa: During summer, the mean values of α were significantly lower at 5 m depth, 0.0099 ± 0.0045 (10) μl O2 mg-1.d.t h-1/μE s-1m-2 and higher 0.0111 ± 0.0041 (10) μl O2 mg-1.d.t h-1/μE s-1m-2 at 10 m depth. Whereas in winter, it was lower 0.0053 ± 0.0023 (10) at 5 m, and higher 0.0135 ± 0.0059 (10) at 10 m depth. The value was increased with depth both in summer and winter hence no significant difference.
Seriatopora hystrix: During summer, the values of IK, was higher 198.5 ± 78.728 (10) μE s-1 m-2 at 5 m and lower 154.3 ± 25.829 (10) μE s-1m-2 at 10 m depth without significant difference. Whereas in winter, they were lower 158.273 ± 74.096 (11) μE s-1m-2 at 5 m and higher 180.7 ± 30.423 (10) μE s-1m-2 at 10 m. These values were not significantly varied.
Lobophyllia corymbsa: During the summer season the light intensity was higher which was sufficient to saturate photosynthesis (291.1 ± 113.588 (10) μE s-1m-2 at 5 m depth and 250.4 ± 106.39 (10) μE s-1m-2) at 10 m water depth. In winter it was lower (202.727 ± 75.39 (10) and 180.357 ± 58.5 (14) μE s-1m-2 at 5 m and 10 m depths respectively. In summer, these values were similar in the depths whereas in winter they were significantly different.
IK
Seriatopora hystrix: During summer, the values of IK, was higher 198.5 ± 78.728 (10) μE s-1 m-2 at 5 m and lower 154.3 ± 25.829 (10) μE s-1m-2 at 10 m depth without significant difference. Whereas in winter, they were lower 158.273 ± 74.096 (11) μE s-1m-2 at 5 m and higher 180.7 ± 30.423 (10) μE s-1m-2 at 10 m. These values were not significantly varied.
Lobophyllia corymbsa: During the summer season the light intensity was higher which was sufficient to saturate photosynthesis (291.1 ± 113.588 (10) μE s-1m-2 at 5 m depth and 250.4 ± 106.39 (10) μE s-1m-2) at 10 m water depth. In winter it was lower (202.727 ± 75.39 (10) and 180.357 ± 58.5 (14) μE s-1m-2 at 5 m and 10 m depths respectively. In summer, these values were similar in the depths whereas in winter they were significantly different.
IC
Seriatopora hystrix: During summer, IC were higher with the range of 114.6 ± 31.63 (10) μE s-1m-2 at 5 m depth whereas lower with the range of 65.8 ± 14.868 (10) μE s-1m-2 at 10 m depth. Similarly, higher in winter season (66.364 ± 40.418 (10) μE s-1m-2) at 5 m depth and lower in winter season (77.5 ± 29.83 (10) μE s-1m-2) at 10 m depth. During summer, the IC values increased according to the depth, however in winter, it was decreased with increasing depth. The S. hystrix IC values were significantly different according to the depth.
Lobophyllia corymbosa: In the case of L. corymbosa, the IC values were higher in summer (110.00 ± 19.488 (10) μE s-1m-2) at 5 m depth and lower in 10 m depth (50.7 ± 12.641 (10) μE s-1m-2) but the values were not significantly different. During winter, higher (83.00 ± 17.312 (10) μE s-1m-2) at 5 m depth and lower in 10 m depth (70.857 ± 17.399 (10) μE s-1m-2).
The values were shown the similar pattern of S. hystrix like increased with increasing depth during the summer, and decreased with increasing depth in winter (Tables 4-6 and Figures 6-8).
| Photosynthesis | Depth (m) | Summer 2009 | Winter 2010 | t-test | p-value | Summer 2009 | Winter 2010 | t-test | p-value |
|---|---|---|---|---|---|---|---|---|---|
| Colony µl O2 mg-1 d. t. wt. h-1 S.D ± | 5 | 8.1965 5.1444 (10) | 8.7129 4.2114 (11) | 0.253 | 0.803 | 2.5941 0.0.9422 (10) | 0.9515 0.2222 (11) | 5.626* | 0.0001 |
| ulO2cm-2 h-1 S.D ± | 30.4888 19.138 (10) | 60.4565 29.230 (11) | 2.747* | 0.013 | 20.259 7.358 (10) | 8.164 1.755 (11) | 5.301* | 0.0001 | |
| h-16 lO2 ulO S.D ± | 536.758 433.552 (11) | 20.80 16.16 (10) | 634.416 443.37 | 28.608 23.672 | |||||
| µl O2 mg-1.d.t h-1 S.D ± | 10 | 6.43392.8923 (10) | 4.145 2.4025 (10) | 1.925 | 0.07 | 2.067 0.4127 (10) | 2.379 1.1915 (14) | 0.792 | 0.437 |
| ulO2cm-2 h-1 | 21.0271 | 28.8231 | 19.288 | 20.079 | |||||
| S.D ± h-16 lO2 ulO | 9.4552 (10) 303.06 | 16.7038(10) 7.078 | 1.284 | 0.215 | 3.853 (10) 421.515 | 13.861 (10) 53.911 | 0.174 | 0.864 | |
| S.D ± | 178.548 | 6.231 | 158.207 | 29.067 |
Table 4: The maximum mean gross photosynthesis (Pgmax) of whole nubbins and the freshly isolated zooxanthellae of S. hystrix and L. corymbosa recorded from different depths (5 m, 10 m) and seasons (summer and winter).
| Photosynthesis parameter a | Depth (m) | Summer 2009 | Winter 2010 | t-test | p-value | Summer 2009 | Winter 2010 | t-test | p-value |
|---|---|---|---|---|---|---|---|---|---|
| µl O2 mg.d.t.wt. h-1/μE s-1 m-2 S.D ± | 5 | 0.0455 0.0294 (10) | 0.0724 0.0614 (11) | 1.26 | 0.223 | 0.0099 0.0045 (10) | 0.0053 0.0023 (11) | 2.95* | 0.008 |
| µl O2 cm-2h-1/μE s-1 m-2 S.D ± | 0.169 0.109 (10) | 0.503 0.426 (11) | 2.39* | 0.027 | 0.0769 0.035 (10) | 0.0.045 0.0187 (11) | 2.88* | 0.01 | |
| µl O2 mg.d.t.wt. h-1/ μE s-1 m-2 S.D ± | 10 | 0.042 0.0163 (10) | 0.0231 0.0133 (10) | 2.84* | 0.011 | 0.0111 0.0041 (10) | 0.0135 0.0059 (10) | 1.08 | 0.291 |
| µl O2 cm-2h-1/μE s-1 m-2 S.D ± | 0.137 0.0534 (10) | 0.16 0.0925 (10) | 0.69 | 0.502 | 0.104 0.038 (10) | 0.113 0.0.070 (10) | 0.44 | 0.665 |
Table 5: The mean values of the photosynthetic parameters of S. hystrix and L. corymbosa according to depths (5 m, 10 m) and seasons (summer and winter).
| S. hystrix | L. corymbosa | ||||||||
|---|---|---|---|---|---|---|---|---|---|
| Photosynthesis parameter | Depth (m) | Summer 2009 | Winter 2010 | t-test | p-value | Summer 2009 | Winter 2010 | t-test | p-value |
| IK | |||||||||
| μE s-1 m-2 S.D ± | 5 | 198.5 78.728 (10) | 158.273 74.096 (11) | 1.206 | 0.243 | 291.1 113.588 (10) | 202.727 75.392 (10) | 2.12* | 0.047 |
| μE s-1 m-2 S.D ± | 10 | 154.325.829 (10) | 30.423 (10) | 2.092* | 0.51 | 250.4 106.391 (10) | 180.357 58.501 (14) | 0.89 | 0.383 |
| IC | |||||||||
| μE s-1 m-2 S.D ± | 5 | 114.6 31.631 (10) | 66.364 40.418 (11) | 3.023* | 0.007 | 110 19.488 (10) | 83 17.321 (11) | 0.498 | 0.624 |
| μE s-1 m-2 S.D± | 10 | 65.814.868 (10) | 29.83 (10) | 1.11 | 0.282 | 50.7 12.641 (10) | 70.857 17.399 (14) | 3.115* | 0.005 |
| I0.95 | |||||||||
| μE s-1 m-2 S.D± | 5 | 363.652 114.229 (10) | 289.955 135.744 (11) | 1.206 | 0.243 | 533.296 208.095 (10) | 371.396 138.119 (11) | 2.12* | 0.047 |
| μE s-1 m-2 S.D± | 10 | 282.678 47.318 (10) | 331.042 55.735 (10) | 2.092* | 0.051 | 385.453 194.907 (14) | 330.414 107.174 (10) | 0.297 | 0.89 |
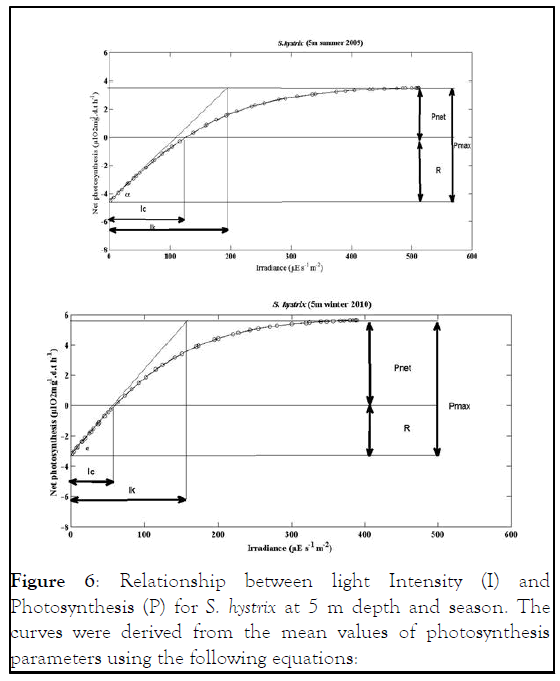
Figure 6: Relationship between light Intensity (I) and Photosynthesis (P) for S. hystrix at 5 m depth and season. The curves were derived from the mean values of photosynthesis parameters using the following equations:
S. hystrix Pnet=Pgmax. tanh (I/IK)-R Chalker
Pnet=8.1965 tanh (I/198.5)-4.563 5 m summer 2009
Pnet=8.7129 tanh (I/74.096)-3.164 5 m winter 2010
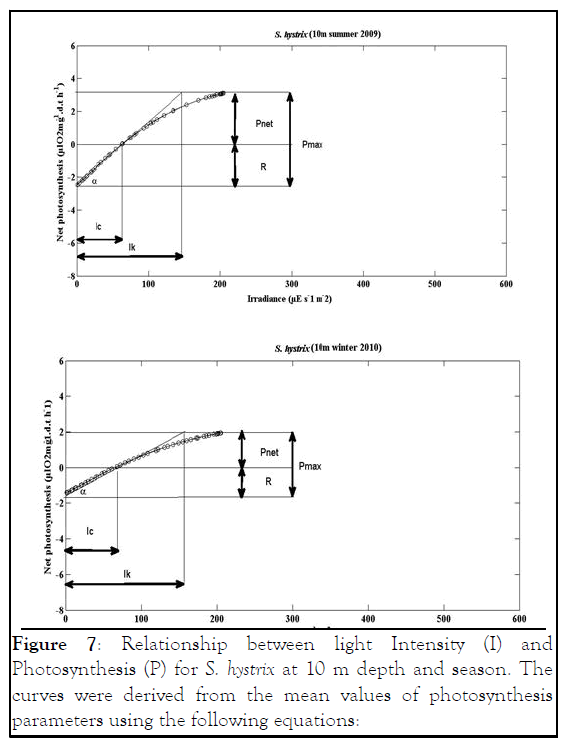
Figure 7: Relationship between light Intensity (I) and Photosynthesis (P) for S. hystrix at 10 m depth and season. The curves were derived from the mean values of photosynthesis parameters using the following equations:
S. hystrix Pnet=Pgmax. tanh (I/IK)-R Chalker
Pnet=6.4339 tanh (I/154.3)-2.477 10 m summer 2009
Pnet=4.145 tanh (I/180.7)-1.432 10 m winter 2010
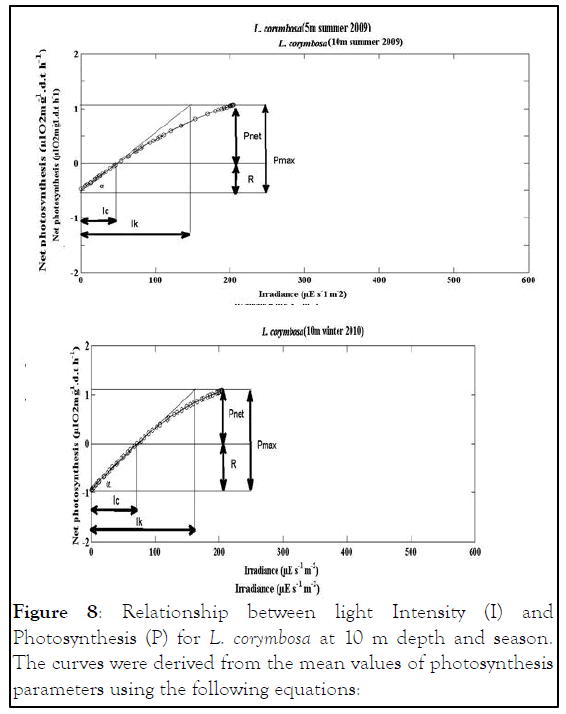
Figure 8: Relationship between light Intensity (I) and Photosynthesis (P) for L. corymbosa at 10 m depth and season. The curves were derived from the mean values of photosynthesis parameters using the following equations:
Seasonal variation in daily growth rate
Seriatopora hystrix : The growth rate was linear during each period of measurement. During summer 2009, the highest mean daily skeletal growth rate of S. hystrix was 2.3 ± 1.3 (20) mg.skel.d-1 in 10 m depth and it was 1.6 ± 0.5 (21) mg .skel.d-1 at 5 m depth. Whilst during winter 2010, the lowest was 1.9 ± 0.96 (20) mg .skel.d-1 at 10 m and also lowest (1.5 ± 0.7 (20) mg.skel.d-1) at 5 m depth. The statistical comparison of the mean daily growth rate of skeleton indicated that, there were not significantly different seasonally.
Lobophyllia corymbosa : The mean growth rate of this species was also observed linear during the period of the study. L. corymbosa also showed higher seasonal variation in mean daily growth rate (7.27 ± 3.068 (17) mg .skel.d-1) at 5 m depth in summer. Whereas in winter, the growth rate was 5.637 ± 2.56 (27) mg. skel.d-1 at 5 m with no significant difference. In the case of 10 m depth, the mean growth rate was higher in summer 6.179 ± 2.95 (15) mg .skel. d-1 than the winter 4.78 ± 1.869 (21) mg .skel.d-1. The statistical comparison of mean growth rate revealed that there were not significant varied at difference depths (5 m and 10 m) and different seasons like summer 2009 and winter 2010.
Species variation in daily growth rate
In general, the L. corymbosa had higher mean daily skeleton growth rate than S. hystrix compared at 5 m and 10 m depths at both summer 2009 and winter 2010 seasons. But there was no significant difference in growth rate between the two species (Figures 9-14).
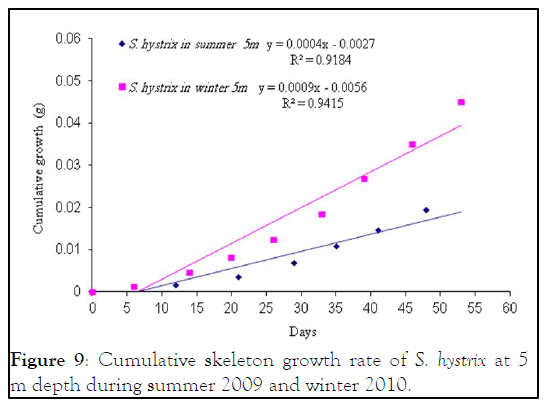
Figure 9: Cumulative skeleton growth rate of S. hystrix at 5 m depth during summer 2009 and winter 2010.
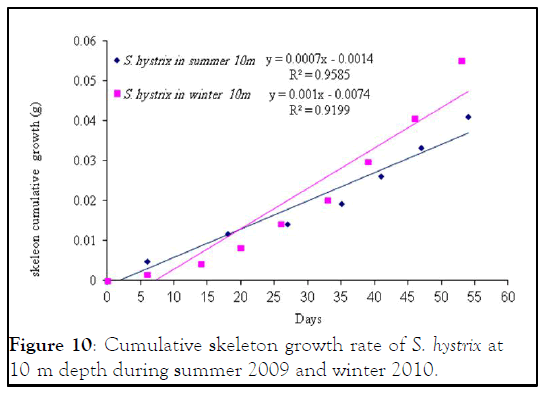
Figure 10: Cumulative skeleton growth rate of S. hystrix at 10 m depth during summer 2009 and winter 2010.
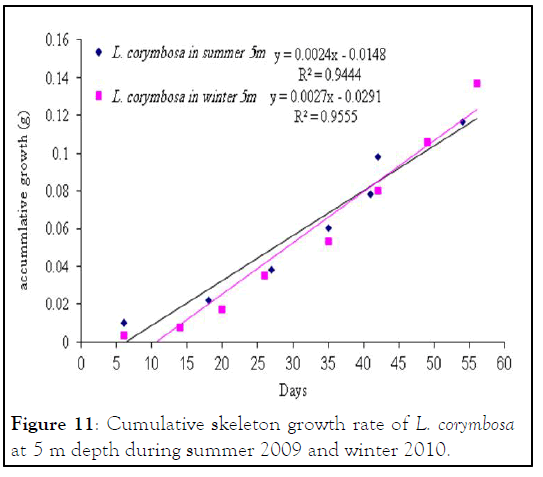
Figure 11: Cumulative skeleton growth rate of L. corymbosa at 5 m depth during summer 2009 and winter 2010.
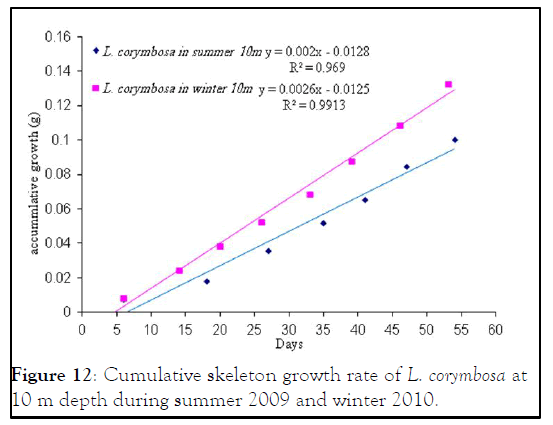
Figure 12: Cumulative skeleton growth rate of L. corymbosa at 10 m depth during summer 2009 and winter 2010.
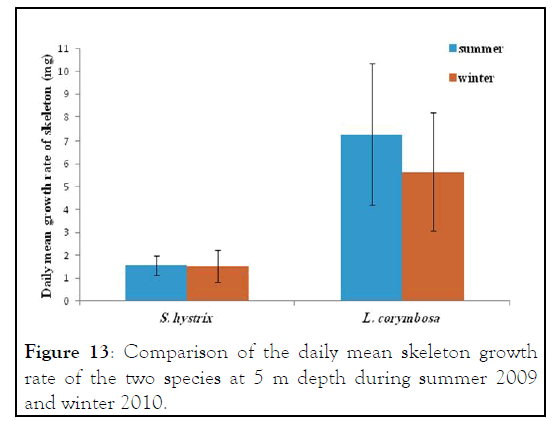
Figure 13: Comparison of the daily mean skeleton growth rate of the two species at 5 m depth during summer 2009 and winter 2010.
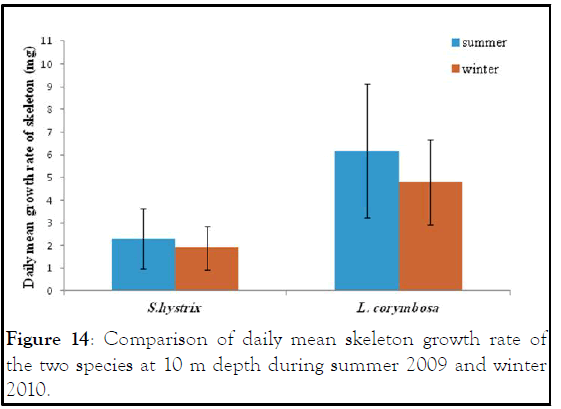
Figure 14: Comparison of daily mean skeleton growth rate of the two species at 10 m depth during summer 2009 and winter 2010.
Environmental measurements
Temperature: The annual mean seawater temperature variations at Sharm Ubhur were lowest in March 2010 at 5 m and 10 m depths 27.42℃ and 27.17℃ respectively. However, the maximum mean seawater temperature was observed in August at 5 m and 10 m depths 32.67℃ and 31.17℃ respectively. Floos observed the lowest seawater temperatures from February to March 2005 24.5℃-24.75℃ at Sharm Ubhur at 3 m depth and the highest seawater temperature from July to August 2005 (30.25℃ to 33℃). Similarly, Al-Sofyani recorded lowest temperatures in the months of February and March1990 25.5℃ and the highest temperatures in the months of July to October 1990 30℃ to 31℃ respectively. In addition Fadlallah recorded similar temperatures at Sharm Ubhur and adjacent Yanbu. He further described that the coldest season begins in February and the warmest season starts at September. The highest seawater temperature of Jeddah was recorded as 35℃ in July 1985 and the lowest as 22.5℃ during December 1985 as well as lowest in February and March. Similarly, the minimum temperature of 25.8℃ was observed in January 1981 and maximum of 34.8℃ in August 1981 were reported by Behiry, et al. from the coastal waters of Jeddah. Edwards and Head recorded the lowest temperatures in January and February 21°C and the highest temperatures in August and September 27℃ in the North of the Gulf of Aqaba.
The main feature of the seawater temperature along the coast of Saudi Arabian Red Sea generally decreases from South to North. The ranges between maximum and minimum, seawater temperature in Jeddah is lower than those found in Gazan.
The seawater temperature in Sharm Ubhur is ideal for the growth and development of corals. Coral growth is generally restricted to waters between 18℃ and 36℃, with an optimal range of 25℃-29℃. This is expressed in latitudinal patterns of coral reef distribution and diversity, within this range; certain corals grow differently depending on their tolerance to a certain range of temperature.
Temperature change might be expected to influence the metabolic rate of both animal and plant components of the symbiosis, and the rate of photosynthesis.
Light
In summer, the longest duration of sunlight was 12.75 hours with integrated daily irradiation of 11.26 μE. m-2.d-1 at 5 m depth, whereas in winter the day length had shortened to 11.75 hours and the integrated daily irradiation was 7.32 μE.m-2.d-1. Al-Sofyani, recorded the longest duration of sunlight in summer as 13.75 hours with integrated daily irradiation of 30.12 μE. m-2.d-1 at 3 m depth while in winter the day length had shortened to 10.5 hours and the integrated daily irradiation was 14.99 μE.m-2.d-1. In Hawaii, and in the turbid water of the fringing reef of Coconut Island, Oahu, Davies recorded an integrated daily irradiance value of 14.39 μE. m-2.d-1 at 3 m depth.
In general, P.A.R. decreases with increasing depths. The daily integrated P.A.R. in August 2011 at 10 m depth was only 39% whereas it was only 61% at 5 m in July. Al- Sofyani recorded similar results in January 1990 as 39% at 10 m depth and 33% in July at 1 m depth. Head recorded average light levels of about 45% of surface irradiance at the depth of 10 m in other areas of the Red sea. Oliver, et al. recorded transmission of 65% and 28% of surface light to depth of 3 m and 10 m depths respectively at Davies Reefs, Australia. Edmunds recorded 26.9 and 19.4% transmission of surface light to 10 m in clear water and turbid water respectively in Discovery Bay, Jamaica.
Skeletal and biomass characteristics
Skeletal densities for both S. hystrix and L. corymbosa are 2.5 g.cm-3 and 2.75 g.cm-3 respectively which are compared with 2.78 g.cm-3 and 2.77 recorded for both Pocillopora damicornis and Pocillopora verrucosa, In addition, skeletal variation of 2.78 g.cm-3 was recorded for Stylophora pistillata and Echinopora gemmacea, 2.783 g.cm-3 for Pocillopora eydouxi, 2.822 g.cm-3 for Porites porites and lowest of 2.95 g.cm-3 for Fungia fungites, 2.78 g.cm-3 for Sariatopora hystrix, 2.4 g.cm-3 for Lobophyllia corymbosa.
The variations in the skeletal density among the species may be due to the difference in amount of organic matrix in the skeleton. The difference of the skeletal density of both species in the present study may reflect a difference in percentage of the organic matrix in their skeleton.
S. hystrix has the lower tissue biomass of 37.12% per mg in the case of dry tissue weight 5 m depth and 45.26% per mg dry tissue weight 10 m depth in summer than the L. corymbosa while in winter, it was 63.96% at 5 m depth and 73.47% 10 m depth and was lower than the L. corymbosa at 5 m and 10 m depths.
Had the lowest tissue biomass than L. corymbosa in the case of surface area like 14.83% and 30.13% at depths 5 m and 10 m respectively in summer. Similarly, in winter, the biomass of tissue per surface area of S. hystrix was lower than L. corymbosa 5 m and 10 m depths 49.26% and 71.31% respectively. This may due to the differences in the growth form of the two species or from the tissue location within the skeleton.
The tissue biomass values of both depths were 24.9 mg.d.t.g-1 skel for S. hystrix and 39.6 and 45.49 mg.d.t.g-1 skel for L. corymbosa at depths in summer respectively. In winter they were 13.3 and 11.7 mg.d.t.g-1 skel for S. hystrix and 36.9 and 44.1 mg.d.t.g-1 skel for L. corymbosa at the 5 m and 10 m depths. Floos reported that 28.1 mg.d.t.g-1 skel and 24.92 mg.d.t.g-1 skel for Pocillopora damicornis and Pocillopora verrucosa from the Red sea at 3 m depth and Al-Sofyani reported 10.30 mg.d.t.g-1 skel and 12.86 mg.d.t.g-1 skel for Stylophora pistillata and Echinopora gemmacea from the Red sea at of 3 m depth. Al-Sofyani and Nias recorded 12.50 mg.d.t.g-1 skel for Sariatopora hystrix from the Red sea at 3 m depth. Al-Lihaibi, et al., recorded 39.6 mg.d.t.g-1 skel for Lobophyllia corymbosa from the Red sea at 2 m depth. Other studies on Montipora verrucosa and Porites lobata revealed that 44.29 and 45.02 mg.d.t.g-1skel for at 3 m depth respectively. In addition to that another study which showed 2.2 mg.d.t.g-1 skel for Fungia fungites at 2 m depth.
On the basis of unit area (mg.d.t.cm-2), the values were 7.81 mg.d.t cm-2 and 7.7 mg.d.t cm-2 in summer at 5 m and 10 m depths respectively for S. hystrix. In L. corymbosa they were 9.17 mg.d.t cm-2 and 11.02 mg.d.t cm-2 in summer at the same depths respectively. While in winter, at 5 m and 10 m depths they were 4.14 and 3.32 mg.d.t cm-2 for S. hystrix as well as 8.16 and 11,57 mg.d.t cm-2 for L. corymbosa close to the range of 5.56 mg.d.t cm-2 to 9.65 mg.d.t cm-2 for Montastrea annularis at 2 m and 10 m depths respectively. Similarly the surface area range of 2.8 mg.d.t cm-2 to 12.5 mg.d.t cm-2 was observed for six species at 2.5 m depth from Barbados, West Indies.
Al-Sofyani reported lower values, 3.52 mg.d.t cm-2 for Stylophora pistillata and 4.91 mg.d.t cm-2 for Echinopora gemmacea at of 1 m and 3 m depths respectively. Floos recorded lower values, 5.33 mg.d.t cm-2 for Pocillopora damicornis and 6.92 mg.d.t cm-2 for Pocillopora verrucosa, while Edmunds and Davies showed much higher value of 18.59 mg.d.t cm-2 for Porites porites at 10 m depth. These differences in this present study may due to the growth form or the methods used for measuring surface area.
The density of zooxanthellae by means of dry tissue weight for S. hystrix was approximately 73.7% and 77.8% at of 5 m and 10 m depths in summer respectively. While in winter it was lower 91.6% and 95.3% at 5 m and 10 m depths when compared with the number of zooxanthellae on the basis of biomass unit in winter and summer respectively. On the other hand, the surface area of S. hystrix was 58.3% and 63.8% at 5 m and 10 m depths in summer respectively, while in winter it was lower when compared L. corymbosa 81.6% and 82.8% at 5 m and 10 m depths in winter and summer respectively.
Floos recorded the zooxanthellae density in winter was approximately lower as 13.3% in summer and 2.63% at 3 m depth in P. verrucosa. On the other hand, P. damicornis was also lower 39.36% and 42.9% when compared with P. verrucosa on the basis of surface area in winter and summer respectively. In addition, the other published data showed that in summer the density of zooxanthellae at 5 m and 10 m depths for both S. hystrix and L. corymbosa were (1.2 × 10⁶ ± 0.6, 0.50 × 10⁶ ± 0.27) and (0.58 × 10⁶ ± 0.26, 1.6 × 10⁶ ± 0.67) g-1skel respectively. However in winter, it was (19 × 106 ± 8.9, 3.51 × 10⁶ ± 1.86) for S. hystrix and (25.7 × 10⁶ ± 12.9, 4.42 × 10⁶ ± 1.53) g-1skel for L. corymbosa. at 5 m and 10 m depths respectively.
Floos stated that the density of zooxanthellae at 3 m depth of both Pocillopora damicornis and Pocillopora verrucosa was 2.40 × 10⁶ ± 0.57 and 2.7 × 10⁶ ±1.07 g-1skel respectively, where as other values were similar to Stylophora pistillata (2.87 × 10⁶ g-1skel) but lower in Echinopora gemmacea (1.63 × 10⁶ g-1skel) than Fungia fungite (1.5 × 10⁶ g-1skel).
On the basis of dry tissue weight, the density of zooxanthellae of S. hystrix was 0.19 × 10⁵ ± 0.23 mg-1 d.t at 5 m depth and was 0.27 × 10⁵ ± 0.14 mg-1d.t at 10 m depth and for L. corymbosa, it was 0.05 × 10⁵ ± 0.02.mg-1 d.t at 5 m depth and 0.43 × 10⁵ ± 0.18 mg-1d.t at 10 m depth. This was lower than Stylophora pistillata, 2.78 × 10⁵ mg-1d.t and Echinopora gemmacea 1.27 mg-1.d.t studied earlier. It was much lower when compared to Fungia fungites 6.91 × 10⁵ mg-1 d.t. The number of zooxanthellae per unit area of S. hystrix, 1.2 ×105 cm-2 1.6 × 10⁵ c-2 and L. corymbosa 0.5 × 105 cm-2, 0.58 × 10⁵ were lower than of P. damicornis 4.76 × 10⁵ .cm-2 and of P. verrucosa 7.85 × 105.cm-2. And also it was lower than Stylophora pistillata 9.82 × 105 cm-2.
When compared Stylophora species it was lower that the lightadapted shallow water Stylophora pistillata 10.0 × 105 cm-2, for light-adapted Stylophora pistillata 16 × 105 cm-2, Stylophora pistillata 15.6 × 105 cm-2. And it was also much lower than Stylophora mordax 48.8 ×105 cm-2 even at 1 m depth. These differences may be due to using of different methods for measuring the surface area. Stimson reported high variability in the algal densities within coral species. Drew and Porter, et al., reported that the density of zooxanthellae per area unit were same at different depths and among coral genera. Dustan described that the number of zooxanthellae in Montastrea annular was increased with increasing depth and the zooxanthellae appeared to be photo adapted to lower light intensity by increasing the size of the photosynthetic units.
Both species showed annual density cycle of zooxanthellae, lower in summer than the winter. The S. hystrix had lower density of zooxanthellae (6.5% and 6.2%) in summer than the winter at 5 m and 10 m depths respectively. Similarly, L. corymbosa also possessed lower density (13.6% and 12.23%) in summer than the winter at 5 m and 10 m depths respectively. Many studies reported that the number of annual cycle of zooxanthellae was changing due to the environmental parameters, such as irradiance, UV radiation, nutrients and temperature. There was a negative correlation between the number of zooxanthellae with increasing irradiance and temperature and a positive correlation with increasing nutrients. The density of zooxanthellae decreased in response to increasing irradiance. In the present study, the seawater temperature increased during months of summer and photo synthetically active radiation (P.A.R. μE.m-2.s-1) at depth of 5 m was at a maximum in August 2011 with a value of 512 μE.m-2.s-1 and at a minimum at the end of February 2011 when the value was 389 μE.m-2.s-1 while at depth of 10 m was at a maximum in August 2011 with a value of 204.8 μE.m-2.s-1 and at a minimum at the end of February 2011 when the value was 204.8 μE.m-2.s-1.
In addition Al-Sofyani, reported that the photo synthetically active radiation (P.A.R. μE m-2 s-1) at depth of 3 m was at a maximum in June 1990 with a value of 1212 μE m-2 s-1 and at a minimum at the end of November when the value was 727 μE m-2 s-1. Furthermore, at depth of 10 m was at a maximum in July 1990 with a value of 455 μE m-2s-1 and at a minimum at the end of January 1990 when the value was 430 μE m-2s-1.
Dark respiration
The mean percentage of dark respiration rates may vary between two species on the basis of milligram dry tissue weight (mg.d.t.wt.h-1). In this study, the percentage of dark respiration rate of S. hystrix (77.3%) was higher than the L. corymbosa in summer (32°C) and similarly the rate of S. hystrix was as higher as 73.3% than the L. corymbosa in winter 30°C at 5 m depth respectively. Similarly, in 10 m depth also the mean percentage respiration rate was higher in S. hystrix (75.1%) in summer 31°C and higher (67.1%) in winter 29°C than the L. corymbosa respectively.
In this present study, the summer respiration rate of S. hystrix was 4.563 μl O2 mg.d.t.wt.h-1 at 5 m depth whereas was 2.477 μl O2 mg.d.t.wt.h-1 at 10 m depth. Similarly in L. corymbosa, the rate was about 1.035 μl O2 mg.d.t.wt.h-1 at 5 m depth and 0.618 μl O2 mg.d.t.wt.h-1 at 10 m depth respectively. The mean respiration rates of this study was compared (mg.d.t.wt.h-1) with other published values of this region. In summer, Pocillopora damicornis rate was lower than the present study (1.190 μl O2 mg.d.t.wt.h-1) and also respiration rate of the Pocillopora verrucosa was also lower (1.37 μl O2 mg.d.t.wt.h-1) at 3 m depth of the same study site. In Echinopora gemmacea also the respiration rate was lower (1.37 μl O2 mg.d.t.wt.h-1) than the present study on S. hystrix at the same study area. Studies on the other regions like Hawaii also showed minimum respiration rates in Mintipora annularis (1.65 μl O2 mg.d.t.wt.h-1) and Porites lobata (1.19 μl O2 mg.d.t.wt.h-1) than the present study.
In winter, the mean respiration rate of S. hystrix was 3.164 μl O2 mg.d.t.wt.h-1 and 1.432 μl O2 mg.d.t.wt.h-1. The L. corymbosa respiration rate was lower than the S. hystrix 0.846 μl O2 mg.d.t.wt.h-1 and 0.471 μlO2 mg.d.t.wt. h-1 of the present study at 5 m and 10 m depths. It was (L. corymbosa) even lower in respiration rates when compared to the other studies on Echinopora gemmacea (1.21 μl O2 mg.d.t.wt.h-1) and Stylophora pistillata (1.77 μl O2 mg.d.t.wt.h-1) at the same study site. This lower respiration rate of L. corymbosa of the present study may due to the higher tissue biomass than the S. hystrix.
Davies stated that, the corals with lower surface area consumed less oxygen than the corals with higher surface area. Furthermore, Kawaguti reported that the corals with large polyps contracted during daytime resulted in the lower respiration rate than the corals with small and expanded polyp of the day time. Hence the mean dark respiration rates of this study on the both species were higher in summer (32°C and 31°C) than the winter (30°C and 29°C) at 5 m and 10 m depths respectively. But, Nakamura Eriko, et al., reported that the dark respiration rate of coral Acropora pruinosa was higher in winter at 20°C than the summer at 30°C.
In overall depth, the respiration percentage rate of S. hystrix was higher in summer (54.3%) than the winter (45.3%), similarly in L. corymbosa, the overall respiration rate was higher (59.7%) in summer and lower (55.7%) in winter.
In general, the worldwide studies revealed that the respiration rates of corals were decreased with increasing depths. Furthermore, studies described that the corals in shaded area respire less oxygen than the open area corals.
Al-Sofyani, reported that the respiration rate percentage of Stylophora pistillata at 10 m depth was 81% of the 1 m depth both in summer and winter seasons. Whilst in Echinopora gemmacea, the respiration rate percentage was 93% at 10 m depth and 79% 3 m depth during both summer and winter. Similar to this, in Montastrea annularis off Discovery Bay, Jamaica, the dark respiration rate at 10 m depth was 46% of that of 3 m depth. In shade-adapted Stylophora pistillata, the oxygen consumption was 54% of that of the light-adapted one.
The reduction in coral respiration rates with depth or shade may be related to the reduction in translocation of organic material from the algae which in turn were a function of decreased irradiance.
On the basis of surface area, the mean dark respiration rate of S. hystrix was higher 16.974 μl O2 cm-2 h-1 in 5 m depth and also higher in 10 m depth (8.09 μl O2 cm-2h-1) than the L. corymbosa (8.082 μl O2 cm-2h-1, 5.7610 μl O2 cm-2h-1) respectively at during summer season.
In winter also, the mean dark respiration rate of S. hystrix was higher (22.01 μ O2 cm-2h-1 and 9.958 μl O2 cm-2h-1) than the L. corymbosa (5.871 μl O2 cm-2h-1 and 3.167 μl O2 cm-2h-1) at 5 m and 10 m depths respectively. In the case of Pocillopora eydouxi it was 8.1 μl O2 cm-2h-1 at Guam and in Stylophora pistillata it was 9.84 μl O2 cm-2h-1 and 9.7 μl O2 cm-2h-1 at Red Sea. In Barbados, West Indies the respiration was within the range of 3.5-8.76 μl O2 cm-2h-1 for six species of coral. The present values were lower than that of Porites lobata (11.38 μl O2 cm-2h-1) observed at 7 m depth and of Porites porites (11.91 μl O2 cm-2 h-1) of at 10 m depth. This comparison study revealed that the respiration rates of corals were decrease with increasing depths. There is a difference in the mean dark respiration rate of two species on the basis of zooxanthellae count per hour. In S. hystrix it was 4.15 (5 m depth) and 2.69 (10 m depth) μl O2 10-6zoox-1.h-1 and in L. corymbosa it was 17.84 (5 m depth) 5.11 (10 m depth) μl O2 10-6zoox-1.h-1 during summer respectively. But in winter, the mean dark respiration rates of S. hystrix was (2.43 μl O2 10-6zoox-1. h-1 and 1.73) μl O2 10-6zoox-1.h-1 but in L. corymbosa it was (7.59 μl O2 10-6zoox-1. h-1 and 2.97) μlO2 10-6zoox-1.h-1 at 5 m and 10 m depths respectively.
Other studies reported that the Pocillopora damicornis respiration rate was 2.39 μl O2 10-6 zoox-1.h-1 (25°C) to 3.03 μl O2 10-6 zoox-1.h-1 (30°C) during winter. In Pocillopora verrucosa it was 2.84 μl O2 10-6zoox-1.h-1 at 25°C and it was 2.48 μl O2 10-6zoox-1.h-1 at 30°C during winter, while in summer (35°C) the values recorded, ranging from 7.46 μl O2 10-6zoox-1.h-1 and 5.78 μl O2 10-6zoox-1.h-1 for Pocillopora damicornis and Pocillopora verrucosa respectively in the Red Sea. In the case of Stylophora pistillata it was 2.51 μl O2 10-6zoox-1.h-1 at 1 m depth and was 2.15 μl O2 10-6zoox-1. h-1 at 10 m depth in the summer (30°C) similarly at 3 m depth it was 3.1 μl O2 10-6zoox-1.h-1 and at 10 m depth it was 2.63 μl O2 10-6zoox-1.h-1 in the Red Sea. Other studies on Montastrea cavernosa showed 2.61 μl O2 10-6 zoox-1.h-1 at 5 m depth and the studies on Porites porites showed 1.84 μl O2 10-6 zoox-1.h-1 at 10 m depth.
During summer, the overall depth percentage of respiration rate by means of zooxanthellae in S. hystrix was 15.7% whereas in L. corymbosa it was higher 64.7%. Whereas in winter the overall depth respiration rate of S. hystrix was more in percentage 75.4% than the L. corymbosa 50.18% in the summer. The mean dark respiration rate was decreased with the increasing depths in the both species. Other studies reported that the respiration rate of the Pocillopora damicornis at 25°C was about 7.69% and was maximum 48.94% at 30°C. Similarly, in Pocillopora verrucosa the respiration rate was lower 3.7% in 30°C and higher in 23.53% 35°C respectively.
The work of Baker, et al., clades C in their zooxanthellae samples of Palythoa caribaeorum. Clade A and B inhabited shallow water colonies, while clade C zooxanthellae are found in deeper water colonies, or in shaded areas of the same individual coral colony.
There was major bleaching in the Red sea corals in the year 1998. In that period some coral species like Pocillopora verrucosa had found resistant to the bleaching event than the Pocillopora damicornis. Moreover, Coles and Jokiel reported very high response in metabolic rate due to temperature changes (19℃-31℃) in Pocillopora damicornis, Montipora verrucosa, Porites compressa and Fungia scutaria in Hawaii and Enewetak. This difference in the metabolic rates may be the indication of compensatory acclimation of the species to the temperature. Acclimation has the effect of increasing metabolic rate during long term exposure to reduced temperature. If acclimation is completed, the measured metabolic rates at the temperature at which the animals are living are identical.
Photosynthesis
The mean maximum gross photosynthesis (Pgmax) on the basis of both biomass and surface area were higher in S. hystrix than the L. corymbosa. This may be due to the higher number of zooxanthellae when expressed on both biomass and surface area basis. When the values were expressed on the basis of zooxanthellae density, L. corymbosa showed higher values than S. hystrix suggesting that self-shading of zooxanthellae may occur in the latter species.
During summer, the value of Pgmax on the basis of surface area, was higher in S. hystrix (30.4888 μl O2 cm-2h-1 at 5 m depth) than the light-adapted Stylophora pistillata (22.9 μl O2 cm-2h-1) at 2 m depth but at 10 m depth the value of S. hystrix of the present study was 21.027 μl O2 cm-2h-1 when compared to the Stylophora pistillata of the different regions 18.67, 20.2 and 21.34 μl O2 cm-2h-1 respectively. The Pgmax for S. hystrix during summer was similar to the Pocillopora eydouxi (36.1 μl O2 cm-2h-1) at 5 m depths.
The maximum gross photosynthesis values on the basis of mg.d.t.wt.h-1 for S. hystrix was 8.1965 mg.d.t.wt.h-1 at 5 m depth and 6.4339 μl O2 mg.d.t.wt.h-1 at 10 m depth and in the case of L. corymbosa it was 2.594 μl O2 mg.d.t.wt.h-1 at 5 m depth and 2.067 μl O2 mg.d.t.wt.h-1 at 10 m depth in summer. These values were lower than the Stylophora pistillata (8.81-5.23 μl O2 mg.d.t.wt.h-1 and higher than the Echinopora gemmacea (3.83-3.39) μl O2 mg.d.t.wt.h-1. When compared to Porites porites it was 4.76 μl O2 mg.d.t.wt.h-1 at 10 m and in Porites lobata it was 4.26 μl O2 mg.d.t.wt.h-1 at 3 m respectively, both these species had large tissue biomass.
The Pgmax for L. corymbosa was lower in the winter than the summer and this could be probably due to the lower water temperature in the winter. However, at 5 m depth, the rate of photosynthesis of S. hystrix was higher in winter than the summer.
The values of Pgmax in the present study for L. corymbosa decreased with increasing depths in winter, but in summer increased with increasing depth. Hence in L. corymbosa the value of α increased with increasing depths, however, in S. hystrix it declined with increasing depth and hence in S. hystrix the value of α decreases with increasing depths. These results have been shown to be associated with the processes of photo adaptation in corals, although Chalker, et al., reported the increase in Pgmax with increase in depth.
The Ik values of the PvI curve were the indication of the relative efficiency of photosynthesis at low light levels. Similarly the lower value of Ik was indicating the higher efficiency. The Ik values of S. hystrix declined from 198.5 μE.m-2.s-1 (5 m depth) to 154.3 μE.m-2.s-1 (10 m depth) in summer while in winter was increased from 158.273 μE. m-2.s-1 (5 m depth) to 180.7 μE.m-2.s-1 (10 m depth) this might due to the photoadaptation ability of the zooxanthellae. Gattuso worked on Stylophora pistillata and reported that at 1 m it was 318 μE.m-2.s-1 and 10 m it was 158.3 μE.m-2.s-1. Whilst Porter, et al., found values of 273 μE. m-2.s-1 at light adapted and 60 μE. m-2.s-1 at dark adapted Stylophora pistillata respectively. The Ik values for L. corymbosa declined from 291.1 μE. m-2.s-1 at 5 m to 250.4 μE. m-2.s-1 at 10 m in summer similarly in winter it decreased from 202.72 μE. m-2.s-1 at 5 m to 180.4 μE. m-2.s-1 at 10 m. According to Davies, Montipora verrucosa was 176 and Porites lobata was 177 μE. m-2.s-1 at 3 m depth.
Both L. corymbosa and S. hystrix displayed lower values of Ik in the winter than the summer at both depths indicating the photo adaption to the lower light levels prevailing during these months. This appears to be the first report of a seasonal photo adaption response in corals of the Red sea. The deep living corals exhibited difference in photosynthetic characteristics, which could be explained by photo adaptation to reduced light by the zooxanthellae. Changes were observed in the shape of the P v I curves. Notably the deep corals had lower values of Ik although values for α were similar.
Growth
Linear growth rates studies in this two species can be interpreted that; it may rapidly increase at the tips of the nubbin rather than lateral. The growth rate of hermatypic corals is influenced generally by the external factors like light intensity, sedimentation. The temperature is also another important parameter that can affect coral growth. In tropical corals, several studies showed that a 1℃ increment in mean annual temperature may result into the increase in the coral calcification rate by 3.1% especially when temperatures increased above the upper threshold limit of corals.
In L. corymbosa also, the growth rate was reduced by the internal factors such as reproduction, genetics, growth form of colony, number or type of zooxanthellae and production of mucus tunics by species. The light quality and intensity and seawater temperature during summer also affected the growth rate of S. hystrix and L. corymbosa. Hence, the mean respiration rate of zooxanthellae increased dramatically with an increasing temperature. The reduction in coral respiration rates with an increasing temperature was associated with a reduction in number of zooxanthellae. It may be possibly due to the translocation of organic material from the algae due to decrease in photosynthesis, in addition to decrease the growth rate of skeleton during winter.
The respiration of the corals was consumed the most important portion of the energy input. However, both species, especially the S. hystrix seemed to be more sensitive to exogenous and endogenous factors. This was evidenced by the mean growth rates which recorded in the summer for S. hystrix and L. corymbosa. They were about 93.8% and 78.1% at 5 m, and at 10 m were about 82.6% and 77.7% in winter respectively.
In compared the mean growth with other studies showed that the mean growth rate was 1.6 mg. skel.d-1 to 2.3 mg. skel.d-1 for S. hystrix and 7.3 mg.skel.d-1 to 6.18 mg. skel.d-1 for L. corymbosa at 5 m and 10 m in summer respectively. It was more or less similar to the growth rates of P. damicorni (3.90 mg. skel. d-1) and also of Pocillopora verrucosa (5.40 mg.skel.d-1) at 3 m. But it was lower than the Echinopora gemmacea (13.46 mg.skel.d-1) and Stylophora pistillata (56.03 mg.skel.d-1) of even at 1 m from the Red Sea. In winter, the mean growth rates of S. hystrix were (1.5 mg. skel. d-1 to 1.9 mg.skel.d-1) and for L. corymbosa it was 5.7 mg. skel.d-1 to 4.8 mg. skel. d-1 at 5 m and 10 m respectively.
Hence, the growth rate of the corals in the present study was higher in summer than the winter at 5 m and 10 m depths. But it was still lesser than the other studies which fallen within the range of 12.5 mg. skel.d-1 to 51.6 mg. skel.d-1 for several other coral species from 2 to 10 m depths. Another study by Floos, showed that the values in winter were 6.08 mg.skel.d-1 and 7.44 mg.skel.d-1 for Pocillopora damicornis and Pocillopora verrucosa respectively.
The lower respiration rate of L. corymbosa of the present study may be due to the higher tissue biomass which is not active than the S. hystrix. The mean maximum gross photosynthesis (Pgmax) on the basis of both biomass and surface area were higher in S. hystrix than the L. corymbosa. This may be due to the higher number of zooxanthellae when expressed on both biomass and surface area basis. The reduction in coral respiration rates with an increasing temperature was associated with a reduction in number of zooxanthellae. It may be possibly due to the translocation of organic material from the algae due to decrease in photosynthesis, in addition to decrease the growth rate of skeleton. All these findings indicate that S. hystrix is predominantly dependent on autotrophic feeding while L. corymbosa relies mainly on heterotrophic feeding.
[Crossref] [Google Scholar] [PubMed]
Citation: Floos YAM, Sofyani AA (2023) Physiological Studies of Two Reef Building Corals Species Seriatopora hystrix and Lobophyllia corymbosa in the Red Sea. J Oceanogr Mar Res. 11:257.
Received: 30-Sep-2022, Manuscript No. OCN-22-19429; Editor assigned: 03-Oct-2022, Pre QC No. OCN-22-19429 (PQ); Reviewed: 17-Oct-2022, QC No. OCN-22-19429; Revised: 02-Jan-2023, Manuscript No. OCN-22-19429 (R); Published: 09-Jan-2023 , DOI: 10.35248/2572-3103.23.11.257
Copyright: © 2023 Floos YAM, et al. This is an open-access article distributed under the terms of the Creative Commons Attribution License, which permits unrestricted use, distribution, and reproduction in any medium, provided the original author and source are credited.