Journal of Nutrition & Food Sciences
Open Access
ISSN: 2155-9600
ISSN: 2155-9600
Research Article - (2021)
Ras cheese is the most popular hard cheese in Egypt, the cheese ripened at 6 months. The color ranges between light yellow to the faint yellow. Ras cheese is made from cow milk and sometimes buffalo's milk in ratio of 5%-20%. The addition of buffalo's milk to cow milk, decrease the yellow color of the cheese milk. Commercial Annatto dye is added at 0.03% to cheese milk to have acceptable yellow colored cheese. In Egypt, the dye mostly imported and recently the dye is made locally from the imported seeds, which is expensive and mostly Annatto dye is used in dairy products. Many colored plants, rhizomes are available in Egypt. They have strong and attractive color, possibly to be used in dairy products, for this reason, the aim of this study is to select one of rhizomes of turmeric and yellow carrot, both have high nutrients value, antioxidants and strong yellow carotene colors. The extracts of turmeric rhizomes and residual carrot wastes were extracted from the manufacture of jams and juices. The following analyzes were performed on the crude extract was analyzed for the detection of (saponins, steroids, glycosides, alkaloids, tannins, phlobatannins, flavonoids, quinones, coumarin, terpenoids, phenol, starch and proteins) on Curcumin and B-carotene. Results showed as following: The amount of extracted dye from Curcumin is higher than that from carrot peels using the same solvent ethanol (95%). No turbidity or off flavors were detected in Curcumin and β-carotene, the color ranged between the yellow and dark orange color. The absorbance at 425 nm, 450 nm, 482 nm for Curcumin, β-carotene and commercial Annatto. Phytochemical analyses showed higher amount of total phenols and total flavonoids for Curcumin, followed by β-carotene and lastly for commercial Annatto.
Annatto; β-carotene; Phytochemical screening; Spectroscopy analysis
Colour is also important factor affecting the acceptability of cheese, during green fodder feeding the cow milk had yellow colour especially from local Damietta cows, since imported cow produce yellow colour, as well the addition of 5%-20% bright white buffaloes milk to cheese milk decrease the accepted yellow colour of the milk. Summer feeding excluded green fodder produces white cow milk. According to Hutchings, the total appearance of a specific food product influences the individual's interpretation of all visually perceived information relating to that product [1]. Besides smell and visually perceived flavour and texture, it is mainly the appearance properties, comprising optical properties, the physical form and the presentation mode, which are important in food choice and which contribute to sensory sensations and hedonic responses in the anticipation phase of consumption [2-4]. Several studies have shown that appearance attributes and, particularly, colour are associated with foodstuffs almost as frequently as flavour and texture related descriptors. It is, however, evident that the importance of appearance depends heavily on the type of food [5,6]. Schutz et al. reported on the high numbers of colour associations with fruits, vegetables and dairy products, whereas low frequencies were observed for flavour intensive liquids and cereals [7]. Qualitative and quantitative sensory colour assessments have been frequently performed in order to monitor the effects of technological treatments on various traditional and processed cheese types.
Many Egyptian Ras cheese consumers thought that the high intensity yellow colour is related to the high fat content of the cheese. Cheese processor adding the available imported dye known as Annatto colorant. Annatto is the most important yellow orange food colour additive widely used in the food industry particularly in the dairy and fat based products to achieve a consistent colour over seasonal changes. Annatto’s source is the outer coats of the seeds of the tropical Achiote trees (Bixa orellana) which native in North and South America, the Caribbean and the East Indies. Natural pigments have been used for a long time in many industries like food processing or cosmetic manufacturing. In Egypt, Annatto is unique in this regard especially in dairy products. Recently, the trend towards the use of natural colorant extracts have increased away from the traditional use due to the changing consumer culture towards more natural products, it also proved to play a functional role and provide a healthy benefit. On the other hand, there is a trend to enhance the utilization of food industry wastes to incorporate it again in food as a good source of bioactive compounds.
• One of these extract; Curcumin that’s a natural compound isolated from rhizomes of the herb Curcuma longa, recognized for their broad spectrum of biological effects, therapeutic and pharmaceutical activities including anti-carcinogenic, immune response, anti-Alzheimer, anti-thrombotic, anti-inflammatory and anti-oxidant.
• Secondly, β-carotene extracted from carrot waste, β-carotene has a many positive health benefits such as pro-vitamin A, antioxidant, anti-cancer, Improve immunity and anti-inflammatory.
The aim of this study is to study the possibility of extracting some dyes of Curcumin from rhizomes of Curcuma longa and β-carotene from carrot peels, in an attempt to use them as an alternative to the colorant of the Annatto in Ras Egyptian cheese industry.
Turmeric rhizomes
(Curcuma longa) was purchased from herbal market in Damietta, Egypt.
Carrot peels
Carrot was obtained from local market, Damietta, Egypt.
Pure curcumin
Curcumine crystalline extra pure (assay 98%) was purchased from Alpha Chemika, India.
Pure β-carotene
Beta carotene powder with a minimum purity of 99% purchased from Alpha Chemika, India, and
Commercial annatto
Liquid annatto (assay 4%) was purchased from MIFAD Company, Badr City, Egypt.
Curcumin extraction
The extraction was carried out as described by Joshi et al., Kulkarni et al. and Mainum et al., with some modifications [8-10]:
The rhizomes of turmeric were dried in a hot air oven at 50°C for even access to a constant weight, ground to a fine powder by electronic mill powder and passed through a sieve (40 mesh). The extract was prepared by extracting 5 gm of the turmeric powder packed in a filter paper to allow the solvent reaching to the sample with (250 ml) ethanol 95% using a Soxhlet’s extraction apparatus for 4 hours at 60°C or till the solvent in siphon tube of an extractor become colorless. The extract was filtered by using filter paper was put into a funnel and placed over a Buchner flask that was attached to a vacuum. The clear filtrate was concentrated on rotary evaporator an even access to a third of the volume. The remaining amount has been distributed in Petri dashes known weight and dried in oven at 40°C even the weight is stable, these steps are summarized in Figure 1.
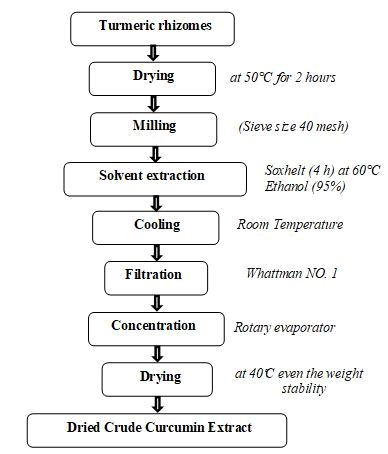
Figure 1: Extraction of curcumin from turmeric rhizomes (Curcuma longa).
Carrot peels powder
was prepared by washing carrot with warm water (30°C), hand peeled; then it was dried at (60°C for 12 hr) in an electric oven drier, milled using an electric mill to a particle size of 500 μm-600 μm to pass through 20 mesh sieve, packed in polyethylene bags and stored in refrigerator until use.
Beta-Carotene extraction
The extraction was carried out as described by Fikselova et al., Wingqvist and Sharminet al. with some modifications; carrot waste is use as a source of beta-carotene [11-13]. The extraction procedures are summarized in Figure 2, where it will be extracted by using of fine carrot peels powder and Soxhlet extraction method. Carrot peels powder was prepared by washing carrot with tap water, hand peeled, freezing (-5°C), then it was dried at (60°C for 12 hr) in an electric oven drier, milled using an electric mill to a particle size of 500 μm-600 μm to pass through 20 mesh sieve, packed in polyethylene bags and stored in refrigerator until use. 5 grams fine carrot peels powder is placed in a filter paper to allow the solvent reaching to the sample. The round boiling flask is filled with 250 ml of solvent ethanol 95%. The extraction process is performed at 60°C, lasted about 4 hours until adsorbent became colorless (Figures 2-4). The extract was filtered by using filter paper Whattman No. 1 was put into a funnel and placed over a Buchner flask that was attached to a vacuum. The clear filtrate was concentrated on rotary evaporator an even access to a third of the volume. The remaining amount has been distributed in Petri dashes information weight and dried in oven at 40°C even the weight stability. After extraction, the size of the extract is concentrated to 50 mL, which is used to estimate betacarotene by spectrophotometer.
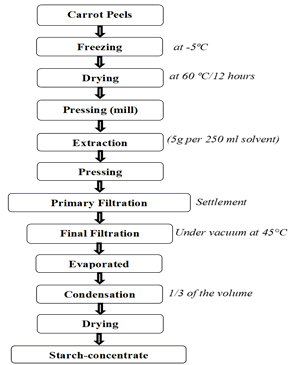
Figure 2: Extraction of beta-carotene from Carrot peels.
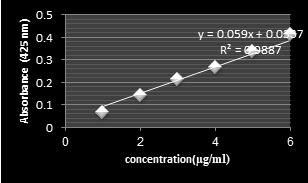
Figure 3: UV Spectrum standard calibration linear of curcumin.
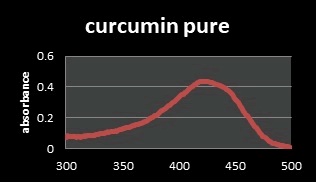
Figure 4: UV-Visible spectrum of standard Curcuminin ethanol.
Preliminary phytochemical screening
Saponins (Foam test): 0.5 g of different Crude extract was mixed with 5 ml of distilled water in a test tube and it was shaken vigorously. Add some drops of olive oil. The formation of stable foam was taken as an indication for the presence of saponins.
Steroids (Libermann-Buchard test): 2 ml of acetic anhydride was added to 0.5 ml crude extract with 2 ml H2S04 . The colour changed from violet to blue or green in samples indicates the presence of steroids.
Glycosides: To 2 ml extract glacial acetic acid, few drops of 5% FeCl3 and conc. H2SO4 were added. Reddish brown color at the junction of two liquid layers and upper layer appears bluish green indicating the presence of glycosides.
Alkaloids (Mayer’s test): Few drops of the Mayer’s reagent was when added onto the extract, white pale yellow precipitate was seen which indicated the presence of alkaloids.
Maeyer’s reagent: Solution (A) 0.355 g of mercuric chloride was dissolved in 60 ml of distilled water. 3.2.4.5.2. Solution (B) 5.0 g of potassium iodide was dissolved in 20 ml of distilled water. Both solutions were mixed and volume was raised to 100 ml with distilled water. The reagent was then kept in a brown bottle and stored in the dark.
Test for tannins: 0.5 g of powder from each sample was boiled in 20 ml distilled water in a test tube and then filtered. The 0.1% Ferric chloride was added to the filtered samples and observed for brownish green or a blue black coloration, which showed the presence of tannins.
Test for phlobatannins: Crude extract was boiled with 2% aqueous HCl. The deposition of a red precipitate was taken as evidence for the presence of phlobatannins.
Test for flavonoids: (Alkaline Reagent test): The test solution was treated with sodium hydroxide followed by addition of con. H2SO4. A yellow coloration observed in each extract indicated the presence of flavonoids. The yellow coloration disappeared on standing.
Test for quinones: Dilute NaOH was added to the 1 ml of crude extract. Blue green or red coloration indicates the presence of quinones.
Test for coumarin: 10% NaOH was added to the extract and chloroform was added for observation of yellow colour, which shows the presence of Coumarin.
Test for terpenoids: 5 ml of extract was added to 2 ml of chloroform and 3 ml of con. H2S04 was carefully added to form a layer of reddish brown coloration of the interface was formed to show positive results for the terpenoids.
Phenol: (Folin-ciocaltaue reagent test): When the extract was treated with a little residue of ammonia solution, a blue or blue to grey color is formed indicating the phenols are present.
Starch: (Iodine test): was conducted for confirming the presence of starch in the extract. To 3 ml of extract few drops of dilute iodine solution was added and mixed. Appearance of blue color which disappears on boiling and reappears on cooling indicated the presence of starch.
Proteins: (Biuret test): To 3 ml extract 4% NaOH and few drops of 1% CuSO4 solution was added and appearance of violet pink colour indicated the presence of proteins in the extract.
Quantitative analysis of phytochemical in extracts
Determination of Total Phenolic Content (TPC): The total phenol was assessed using the Folin Ciocalteu method described by Pranoothi et al. [14]. Briefly, different concentrations of the crude extracts 100 μg/ml were taken to that 0.1 ml of Folin Ciocalteu reagent and 2.5 ml of 0.2 N sodium carbonate was added and incubated for 30 min at room temperature. Distilled water was used as blank. Absorbance was measured at 760 nm using spectrophotometer. Gallic acid was used as standard calibration curve and the results were expressed as μg of gallic acid equivalents per gram dry mass of extract (μg GAE/g DM).
DPPH (2, 2-diphenyl-1-picryl-hydrazyl) free radical scavenging assay: The scavenging activity for DPPH free radicals was estimated using the procedure reported earlier by Borra. Different concentrations (20 μg/ml-100 μg/ml) of each crude extract were added separately to each 5 ml of 0.1 mm methanolic solution of DPPH. The mixture was allowed to stand for 30 min at room temperature. After incubation, the absorbance of each solution was determined at 517 nm using spectrophotometer. Ascorbic acid was used as standard.
Calculation: % scavenging activity=(A0-A1/A0) × 100
Where; A0: is the absorbance without extract and A1: is the absorbance in the presence of the extract or standard sample.
Determination of Total Flavonoid Contents (TFC): Aluminium chloride colorimetric method was used for flavonoids determination following a previously reported by Gracelinet al. with slight modifications [15]. This method is based on the formation of the flavonoids aluminium complex which has an absorptivity at max=415 nm. 100 μl of each plant extracts in methanol (10 mg/ ml) was separately mixed with 1 ml of 2% AlCl3 in methanol and a drop of acetic acid, and then diluted with methanol to 5 ml. The absorption at 415 nm was read after 40 minutes. The absorption of standard quercetin solution (0.5 mg/ml) in methanol was measured under the same conditions.
Standard solutions and calibration curves
Standard stock solutions: 0.1 g of each extracts was dissolved in 10 ml solvent and then volume was dilute to volume to 100 ml with solvent in 100 ml volumetric flask to prepare a concentration of 1000 μg/ml [1]. 1 ml from previous stock solution was withdrawn by Pipette and placed in a 100 ml volumetric flask and made up the volume with solvent to obtain a concentration of 10 μg/ml [2]. From the above stock solution aliquots of 1 ml, 2 ml, 3 ml, 4 ml, 5 ml and 6 ml were transferred to 10 ml volumetric flasks and volume was made up to 10 ml solvent to obtain a concentration of 1 μg/ ml, 2 μg/ml, 3 μg/ml, 4 μg/ml, 5 μg/ml and 6 μg/ml, respectively.
Curcumin standard solution: This standard solution (containing 0.0025 g/1 ml) was read at 425 nm against alcohol blank in spectrophotometer and the curcumin content obtained by this method was determined and expressed as percent, Annatto Standard solution [16]. Nor-bixin colour sample was supplied in concentrated form. Before determining absorbance several dilutions were made. Dilutions having absorbance spectra within 0.4 to 0.8 were chosen as standard dilution for accurate measurement of absorbance in spectrophotometer. Spectrophotometric scan of norbixin color revealed that the highest spectra were shown at 482 nm. For entire work color analysis were conducted by measuring absorbance of sample at 482 nm. The loss of norbixin was measured according to the method described by (FAO/JECFA).
Spectroscopy analysis to samples assay
Determination of Beta-Carotenes: The β-carotene content in the organic solvents after extraction was determined spectrophotometrically at the wavelength of 450 nm. The concentration of carotenes expressed as β-carotene content (g/100 ml) was calculated using the response factors as follows [17]:

Where; A: Absorbency 0.305, D: Dilution 100*100, E1%1 cm: coefficient of absorbency (2620 for Ethanol), W: Weight of sample (g)=5 g and V: Volume (ml)=50 ml after concentrate of the carotenoid solution.
Determination of curcumin Content: 0.1 g dry powder was dissolved in 50 ml absolute ethyl alcohol separately. The content was refluxed over heating mantle for one hour. The solution was cold and decanted into a volumetric flask. The extract volume was made up to 50 ml by adding ethyl alcohol freshly. Absorbance was measured directly at 425 nm in a spectrophotometer. The optical density was recorded. Then the extract was diluted with absolute ethyl alcohol two times and ten times respectively. Absorbance was measured at 425 nm in the same spectrophotometer for both the solutions [18]. Curcumin content was determined by using the following formula:

Preparation and properties of solvent extract
Extraction yield of curcumin extract and its characters: In present study, Soxhlet extraction method and ethanol solvent were used for extraction of curcuminoids from dry turmeric rhizomes powder. When reaching to the faint yellow color as an indicator of the end of extraction. After filtering and concentrating each crude extracts yield were weighted and calculated those are shown in Table 1. The color and appearance of crude extract of Turmeric is a dark brownish orange color with solid viscous oily texture. Insoluble in water and produced characteristics pure yellow color and light green fluorescence in ethanol consistent with the characteristics of pure Curcumin.
Table 1: Extraction of Curcumin from Turmeric powder.
| Progress | Drying | Extraction with soxhelt apertures (Hour) | |||
|---|---|---|---|---|---|
| Curcumin | 1 | 2 | 3 | 4 | |
| Weight of Sample (gm) | 5 | 4.879 | 4.768 | 4.674 | 4.605 |
| Loss of weight | -- | 0.121 | 0.111 | 0.094 | 0.069 |
| Crude Extract % | -- | 2.4 | 2.3 | 2 | 1.49 |
Table 2: Preliminary phytochemical evaluation of Annatto extract and crude extracts of Curcumin and β-Carotene.
| No | Phytochemicals Compounds | Test method | Annatto extract | Curcumin extract | β-Carotene extract |
|---|---|---|---|---|---|
| 1 | Saponins | Foam test | + | + | + |
| 2 | Steroids | Libermann-Burchard test | + | + | + |
| 3 | Glycosides | Borntrger test | - | - | + |
| 4 | Alkaloids | Wagner test | - | + | + |
| 5 | Tannins | Fecl2 Test | + | + | + |
| 6 | Phlobatannins | aqueous HCl | + | + | - |
| 7 | Flavonoids | NaOH Test | - | + | + |
| 8 | Quinones | NaOH Test | + | + | + |
| 9 | Coumarin | NaOH Test | - | + | + |
| 10 | Terpenoids | Salkowski test | + | + | + |
| 11 | Phenol | Phenol test | - | - | - |
| 12 | Starch | Iodine test | - | + | + |
| 13 | Proteins | Biuret test | + | + | + |
To get a Weight of crude Curcumin yield, the filter paper was placed in the Petri plate and its contents (Residues of turmeric powder from the previous hour extraction) were dried in a hot air oven at 40°C for even access to a constant weight as an indicator of the volatilization of used alcohol. Then, the dry filter paper and the contents were weighed. Finally, the mass of the filter paper was subtracted from the total mass. This procedure yields about 7.9% (W/W) of a dark brownish orange viscous liquid. Typically, in a natural turmeric have 6%-9% Curcumin [10]. Analytical technique by Spectrophotometer is used to measure color intensity of oleoresin (Concentrations of extracted dried sample) containing solvent at 425 nm and amount of Curcumin was calculated from standard curve, % Curcumin from ethanolic extract of turmeric was found 10.95% (Figure 1). This was in good agreement with that reported in the related Extraction studies of crude Curcumin from Turmeric using soxhlet apparatus and ethyl alcohol as a solvent found 10.23% [19].
Finally, turmeric has been used as a medicine for a long time to treat various diseases in addition to its use as food additive and natural colorant. The crude ethanolic extract contained most of the phytochemical compounds (will be clarified later), as well as a large amount of Curcumin is found to be interesting.
Extraction yield of β-Carotene and characterization of extract: In this study, carrot peel was used to obtain β-Carotene extract. After reaching the highest yield of carotenes crude extract, when reaching to the faint yellow color as an indicator of the end of extraction by Soxhlet extraction method is shown in Figure 1. On the other hand, the recycling of solvent after the evaporation of the solvent in the rotary evaporator beakers reducing the amount of solvent used and also helps to concentrate the extract.
Quantitative determination of the crude carrot peels extract comparative to its pure powder: β-Carotene contents in carrot waste was calculated based on the calibration curve. The determination of the UV spectrum of β-Carotene was planned in the range of 300 nm-500 nm and maximum wavelength absorption was obtained at 450 nm that is confirmed by literature [11]. The spectrum of concentrations for carrot peel extract in ethanol and β-Carotene standard curves visible range showed the maximum absorbance at the identified wavelength at 450 nm (Figures 5 and 6). This result confirms the validity of the followed procedure and the extract containing the β-Carotene will be appreciated. The calibration curve was done by three various concentrations of crude extracts in solvent (0.01 mg/ml, 0.04 mg/ml and 0.05 mg/ml). The concentration of β-carotene in the crude extract solution was calculated 11.672 mg/100 ml, equal to by the weight unit 7.287 mg/100 g. Which seems reasonable because according to similar literature, carotene content after carrot extract is in the range of 6.19 mg/100 g-14.59 mg/100 g [20].
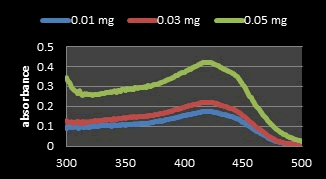
Figure 5: UV-Visible spectrum of Curcumin extract from Turmeric.
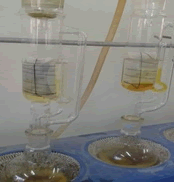
Figure 6: Carotenes crude extract from carrot peels.
In conclusion, after extracting of β-Carotene from the carrot waste extract. Although the solvent extraction process proved to be highly efficient. It was found that its concentration was increased by increasing the concentration of the alcohol extract. To activate the experiment commercially, the concentration would not be profitable with the consumption of a large amount of solvent used compared to the resulting β-Carotene.
Comparison of the absorption spectrum of annatto, curcumin and β-Carotene: Previous studies have shown that β-Carotene and annatto belongs to a class of chemical compounds called carotenoids. β-carotene is a Hydrocarbon carotenoids (C40H56) and consisting of eleven conjugated double bonds and has two retinyl group (β-ionone rings) at the end of their structure [21,22]. The alkaline hydrolysis of bixin (C25H30O4) used to obtain norbixin (C24H28O4) as a dicarboxylic apo-carotenoid consists of nine conjugated double bonds and is soluble in polar solvents [23]. The colors formed depend on conjugated double bonds and the various functional groups contained in the carotenoid molecule [24]. Thanks to a chains of conjugated double bonds, most carotenoids absorbance in the range of 400 nm-500 nm [25]. But we can characterize and recognized between various types of carotenoids by spectral information where the maximum absorbance (λmax) wavelength for β-Carotene and norbixin are 450 nm and 482 nm, respectively [11,23].
From a previous study, the absorption spectrum of pure Curcumin shows that UV spectrophotometer in the range of 400 nm-500 nm. As seen from the curves of the spectrum, the maximum absorbance (λmax) of Curcumin in ethanol is at the wave length 425 nm [8]. The Joint Expert Committee on Food Additives (JECFA, 2001) specification for Curcumin by using a spectrophotometric method in ethanol at 425 nm with corresponding extinction coefficient=1607 as the reference value for three curcuminoids jointly. However, in literatures have been reported that some values for different maximum wavelengths absorption (λmax) may be found. This difference comes from the ratio of all the curcuminoids in the mixture, because each displays a different maximum value. It has been reported that Curcumin (C) in 95% ethanol has a λmax of 430 nm, and at the same time demethoxy Curcumin (DMC) 423 nm and bis-demethoxy Curcumin (BDMC) 418 nm. Thus, this distribution in the mixture affects the average of λmax [23]. The solution of Curcumin in ethanol was found to show maximum absorption at 425 nm and The solution of β-carotene in ethanol was found to show maximum absorption at 450 nm after analysis on the UV spectrophotometer which was reported as maximum absorbance in the literature and Thus the extracted Curcumin and β-Carotene complies with the reference spectrum curves (Figure 7).
An Iso absorptive point of pigments (a wavelength of equal absorptivity of the three yellow pigments) was determined by taking overlain spectrum of the solutions (Annatto, Curcumin and β-Carotene) dissolved in its solvents to obtain working standard of (50 μg/ml of each extracts) in UV spectrophotometer against the solvent solutions (blank) that prepared without adding any extract. From the spectrum curves of the three yellow pigments, it was found that Annatto obtained at 482 nm, Curcumin obtained at 425 nm and β-Carotene obtained at 450 nm (Figure 6). Iso absorptive point was found out at 430 nm. A graph of the concentration versus absorption was drawing (Figures 7 and 8).
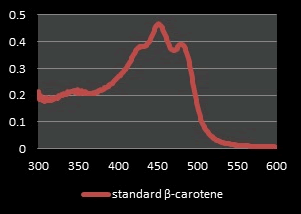
Figure 7: UV Spectrum of standard β-Carotene in ethyl alcohol.
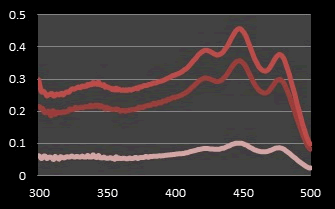
Figure 8: UV Spectrum of β-Carotene in various concentrations of carrot peel extract in ethyl alcohol (0.01, 0.03 and 0.05 mg/ml).
Preliminary qualitative phytochemical analysis: The present study revealed that the phytochemical constituents of various commercial aqueous extract of annatto seeds and crude ethanolic extracts of carrot waste and Turmeric rhizomes (Table 2).
It is well known that most of the products classified as herbal and traditional plant medicines are based on its antioxidant properties or phytochemicals compounds [26]. The study concluded that all the three extracts contained saponins, steroids, tannins, Quinones, terpenoids and Proteins. Phenol tests were negative for all extracts. Alkaloids, Flavonoids, Coumarin and Starch were found not to be present in annatto seeds extract while, the same were present in crude extracts of carrot and turmeric rhizomes. Glycoside was found to be present only in carrot waste extract. In contrast, Phlobatannins test were positively shown by extracts except carrot waste extract. In qualitative analysis, ethanolic extracts were found having steroids, anthroquinone glycosides, flavonoids and tannins, whereas in annatto seeds aqueous extract saponins, steroids, tannins and Proteins were present, indicating their solubility in water. Compared to all solvent extracts, ethanolic extracts of turmeric rhizomes and carrot waste showed the presence of rich variety of secondary metabolites, respectively. Aqueous extract of annatto seeds showed the less variety of these secondary metabolites. On the other hand, the medicinal important of plants derive in some chemical compounds that have a specific physiological function in the human body. Different phytochemicals have been found to have a wide range of medicinal properties, which may help in protection against several diseases. For example, the presence of flavonoids indicates a group of polyphenolic compounds, with beneficial effects in the human diet as antioxidants, free radicals scavenging and antiinflammatory action [27]. Saponins protect against tumoral, antimicrobial activity. Tannins have the properties of antimicrobial and antioxidant activities [28]. Thus it is clear that the results of the present work assume the importance of these extracts when they are incorporated into human diet because they contain natural bioactive compounds were responsible for medicinal effects.
Quantitative analysis of phytochemical in extracts: Phytochemical analysis of crude extracts included a screening of total phenolic, total flavonoids and their free radical scavenging activities were calculated based on the percentages followed by respective graph (Figures 9-13).
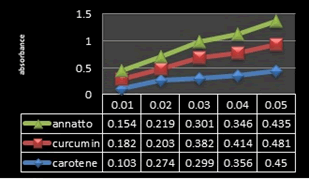
Figure 9: Calibration curves of (Annatto, Curcumin and β-Carotene) extracts at (0.01-0.05 mg/mL).
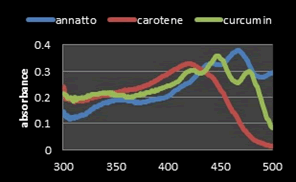
Figure 10: UV-Visible absorption spectra curves of (Annatto, Curcumin and β-Carotene) extracts at (0.03 mg/mL) (W/V).
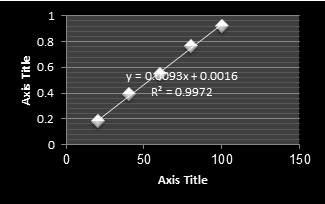
Figure 11: Standard Calibration curve of Gallic Acid (TPC).
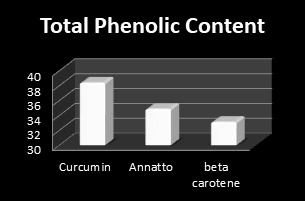
Figure 12: Total Phenolic Content of (Annatto, Curcumin and β-Carotene) extracts.
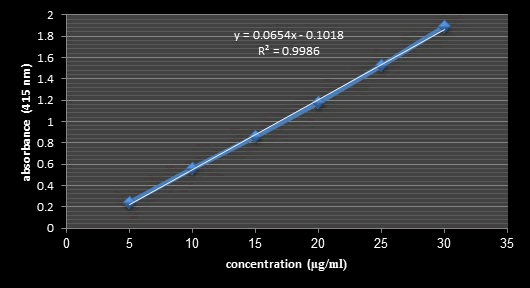
Figure 13: Standard Calibration Curve of Quercetin (TFC).
Total Phenolic Content (TPC): Phenolic compounds are a class of antioxidant agents which play an important role in protecting cells from oxidative damage [29]. Natural antioxidants come mainly from medicinal plants in the form of phenolic compounds which are due to their antioxidant properties. On the other hand, they have variety biological activities for instance anti-inflammatory, anti-atherosclerotic and anti-carcinogenic activities [30]. The total phenolic content (TPC) of plant extracts was determined through analysis of Folin-Ciocalteau method at 760 nm. The TPC of extracts, expressed as gallic acid equivalents (GAE) per gram of dry extract [31]. As evident from Figure 9, the results revealed that maximum total phenolic content (38.4 mg GAE/g) was recorded in Curcumin extract followed by Annatto extract (34.87 mg GAE/g) and carrot extract (33.12 mg GAE/g), respectively.
Total flavonoid content: Flavonoids are a major group of compounds that act as powerful antioxidants or free radical scavengers [28]. Flavonoids possess diverse biological activities such as anti-inflammatory, antibacterial, antiviral and anticancer activities [32]. The total flavonoid content of samples extracted by different organic solvents determined as mg of quercetin equivalent (QE) per gram of dry extract [33]. As it is evident form Figure 12, The total flavonoids content was high in Curcumin extract (22.7 mg QE/g dry extract) followed by carotene and annatto extracts (20.3 and 17.84 mg QE/g dry extract, respectively).
DPPH scavenging ability: DPPH assay is a stable free radical method that is simple, rapid technique and inexpensive to evaluate the antioxidant activity of plant extracts [34]. The principle of the DPPH method is to reduce the color of DPPH in the presence of antioxidant compounds due to the strength of the ability to donate hydrogen and thus convert from DPPH radical to the DPPH‐H form [35]. In this assay, different concentrations of the extracts were used (20 to 100 μg/ml) comparison with vitamin C as control. Following the explained working procedure, the initial color of the DPPH radical (purple in color) at 517 nm became yellow due to the presence of hydrogen or electrons provided by antioxidant agents of the extracts [36]. These changes in color are observed by spectrophotometer and can be calculated quantitatively by these changes in absorbance. The DPPH radical scavenging activity of (Annatto, Curcumin and β-Carotene) extracts are given in Figure 1. The values of the absorbance decrease as the concentration of extracts increases or in other words its antioxidant activity were increased by increasing the concentration of the samples extract (Figures 14 and 15).
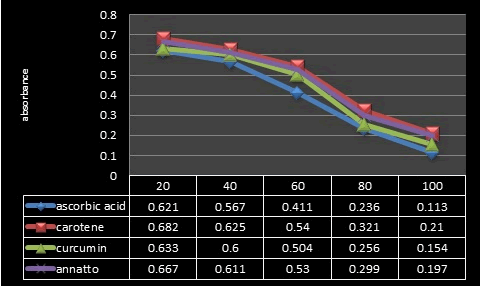
Figure 14: The values of the absorbance of (Annatto, Curcumin and β-Carotene) and ascorbic acid at different concentrations.
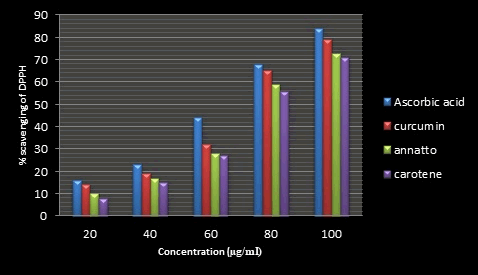
Figure 15: % of DPPH inhibition for (Annatto, Curcumin and β-Carotene) and ascorbic acid at different concentrations.
• Recommended the use of dyes for Ras cheese production because these dyes have anti-oxidant and antimicrobial properties.
• Possibly replacing the imported Annatto by locally Curcumin or β-carotene for Ras cheese making.
• Practically from having good ripened cheese with highly accepted texture and flavour. The applying Curcumin since β-carotene needs more solvent for extraction and more time to have enough amount of β-carotene for dying the cheese milk. β-carotene is less concentrate in the peels of carrot as compared with Curcumin in the turmeric rhizomes.
• From economic point of view turmeric rhizomes are locally produced while Annatto dye was purchased in hard currency.
Citation: Hamad MNF, El-Sayed SM, Gomaa MSM, Al-Surmi NY (2021) Phytochemical Screening Techniques and Standardization Colorant for Commercial Annatto Extract and other Equality Extracts. J Nutr Food Sci. 11:827.
Received: 20-Oct-2021 Accepted: 03-Nov-2021 Published: 10-Nov-2021 , DOI: 10.35248/2155-9600.21.s9.1000827
Copyright: © 2021 Hamad MNF, et al. This is an open-access article distributed under the terms of the Creative Commons Attribution License, which permits unrestricted use, distribution, and reproduction in any medium, provided the original author and source are credited.