
Journal of Clinical and Cellular Immunology
Open Access
ISSN: 2155-9899

ISSN: 2155-9899
Original Research Article - (2022)Volume 13, Issue 5
Objective: We study molecular mechanisms behind T cell reconstitution in Rheumatoid Arthritis (RA) by asking if PBX1, a transcription factor that maintains stem cell pluripotency, predicts antirheumatic treatment response.
Methods: Whole-genome transcriptomics by RNA sequencing was done in CD4+T cells from 87 RA patients with low, and from 78 RA patients with high disease activity. Treatment outcomes in PBX1hi and PBX1lo groups were compared. PBX1-associated phenotype and biological processes were identified by clustering of the genes differentially expressed in PBX1hiCD4+ cells. PBX1hi clusters in thymus were identified by a single cell-based analysis. PBX1 transcriptional targets among DEGs were predicted by the integrative analysis of DNA motif, chromatin immunoprecipitation sequencing and open chromatin data.
Results: PBX1hiCD4+ cells had imprinted features of pluripotency and lacked cytokine production. In active RA, PBX1hi cells were enriched with CD34+ pre-thymic lymphocyte progenitors. PBX1hi patients had better reduction of DAS28 on anti-TNF treatment and low frequency of non-responders compared to PBX1lo (both, p=0.026). In inactive RA, PBX1hi cells were enriched with post-thymic naïve T cells expressing CD62L/SELL and CD31/ PECAM1. Here, PBX1hi patients required less treatment to reach remission compared to PBX1lo patients (p=0.011). In thymus, CD34 and PECAM1 were annotated within PBX1hi clusters. Integrative analysis disclosed that central T-cell maturation genes TBX21, PRDM1, BATF3 and KLF1 were transcriptionally dependent on PBX1.
Conclusion: This study shows that enrichment for PBX1 is associated with pluripotent phenotype of CD4+ cells, which favours treatment responses in RA.
Rheumatoid arthritis; CD4+ T-cell; Pluripotent cell; PBX1
Self-renewal ability is important for the adaptive immunity that preserves the acquired immunological memory in T cells and warrants the lifelong health of an individual. The impaired T cell reconstitution culminates in Rheumatoid Arthritis (RA) [1,2] and is frequently found in other autoimmune conditions [3-5], which leads to a disbalance between the increased frequency of Common Lymphoid Progenitors (CLP) and the low numbers of Recent Thymic Emigrants (RTE). RTE represent a pool of pluripotent immature naïve cells that undergo post-thymic maturation in the lymphoid periphery before joining the pool of mature T cells [6-8]. RTE were identified as probable progenitors of the regulatory T cells [9] and of stem-cell memory cells responsible for maintaining immunological competence [10]. The view on RTE T cells in inflammation and immune pathology varies from highlighting their beneficial effects in cancer and infections [10-12], to harboring hazardous auto-reactive T cells in autoimmune conditions [13]. Pivotal proinflammatory cytokines TNF-α, IFN-γ and IL-6 triggering the RA pathogenesis, trigger insufficient leukocyte renewal by causing thymic involution and preventing T cell reconstitution during inflammation and aging. Consequently, inhibition of inflammation by anti-TNF drug etanercept or by selective inhibition of T cell co-stimulation with abatacept has been reported to initiate the reconstitution process by increasing the frequency of RTE [2,14], which is considered positive for RA patients. This knowledge is only partially translated in rheumatological practice, where most efforts to guide treatment are focused on the maladaptation of mature and memory T cells [15-17]. Here, we study molecular mechanisms connecting thymic T cell trafficking with autoimmunity by asking if PBX1, the Transcription Factor (TF) involved in balance between self-renewal and differentiation of the pluripotent hematopoietic stem cells, could predict treatment response in RA patients.
Pre-B cell Leukemia 1 (PBX1) is a member of the Three-Amino- Acid Loop extension family of TFs that together control the axial patterning during embryogenesis. PBX1 is regarded a pioneer TF interacting with condensed chromatin and recruiting the chromatin remodeling protein complexes. For the regulation of transcription, PBX1 interacts and form heteromeric complexes with a broad range of TFs to repress its gene targets, which maintain the pluripotency of embryonic and hematopoietic stem cells [18,19]. Biological functions of PBX1 include regulation of cell cycle progression by counteracting JAK/STAT3 and activation of AKT1/GSK3b and FOXO signaling essential for survival of endothelial [20] and malignant cells [21]. Additionally, PBX1 promotes the TGF- β-dependent pathology by supporting the nuclear accumulation of SMAD4 [22] and, in partnership with PKNOX1, interacting with SMAD2/SMAD4 complex increasing its chromatin binding and modulating selection of target sites [23]. PBX1 facilitates the recruitment of LEF1/β-catenin complex to chromatin to unlock Wnt-dependent transcriptional program [24], similar to the one triggering formation of stem-cell memory T lymphocytes [10]. This diversity of molecular interactions puts PBX1 forward in the post- embryonic control of adult cell renewal.
In autoimmunity, deficiency in PBX1 was linked to autoimmune T cell phenotype in mice and humans. Repression of the PBX1 gene demonstrated a strong association with susceptibility to systemic lupus erythematosus (SLE) [25]. The same group reported that PBX1 restricted differentiation of pro-inflammatory T cells and promoted the controlling function of the follicular and regulatory T cell subsets [26]. Analysis of the bulk RNA-sequencing data identified a PBX1 containing network of TFs that is predicted to regulate pre-T cell antigen receptor gene PTCRA in RA, SLE and primary Sjögren’s Syndrome patients [27].
Using the whole-genome RNA-seq of CD4+ cells from two independent RA cohorts, we demonstrate that PBX1 is associated with the naïve pluripotent phenotype of CD4+ lymphocytes. These PBX1-expressing T cells are favorable for RA patients and predict better susceptibility to anti-rheumatic treatment (Figures 1-13).
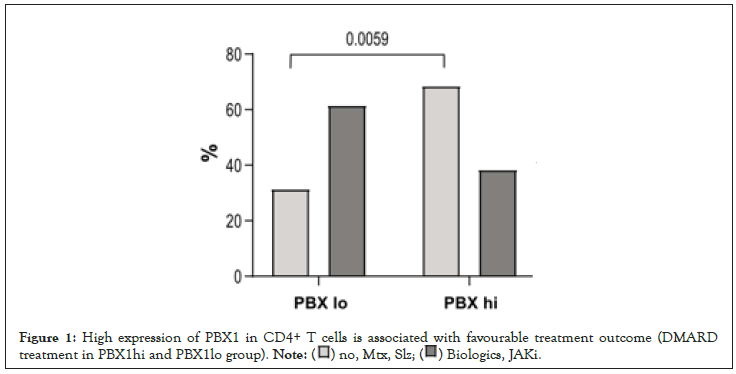
Figure 1:High expression of PBX1 in CD4+ T cells is associated with favourable treatment outcome (DMARD
treatment in PBX1hi and PBX1lo group).
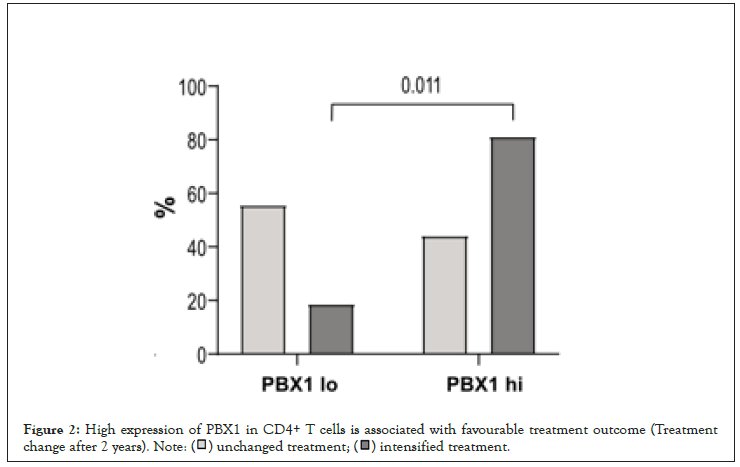
Figure 2:High expression of PBX1 in CD4+ T cells is associated with favourable treatment outcome (Treatment
change after 2 years).
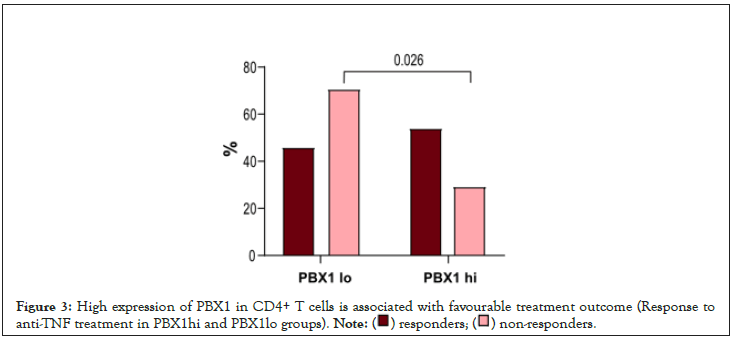
Figure 3:High expression of PBX1 in CD4+ T cells is associated with favourable treatment outcome (Response to
anti-TNF treatment in PBX1hi
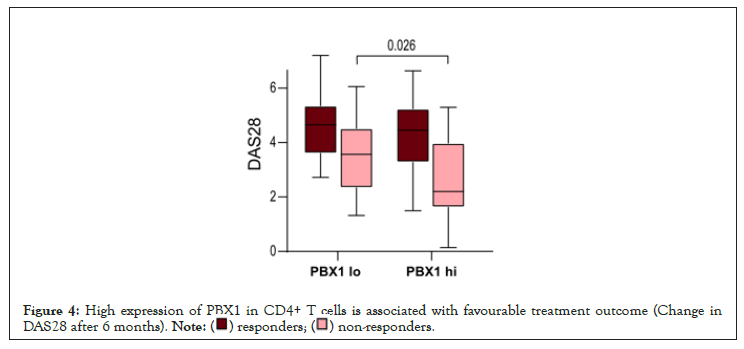
Figure 4: High expression of PBX1 in CD4+ T cells is associated with favourable treatment outcome (Change in
DAS28 after 6 months).
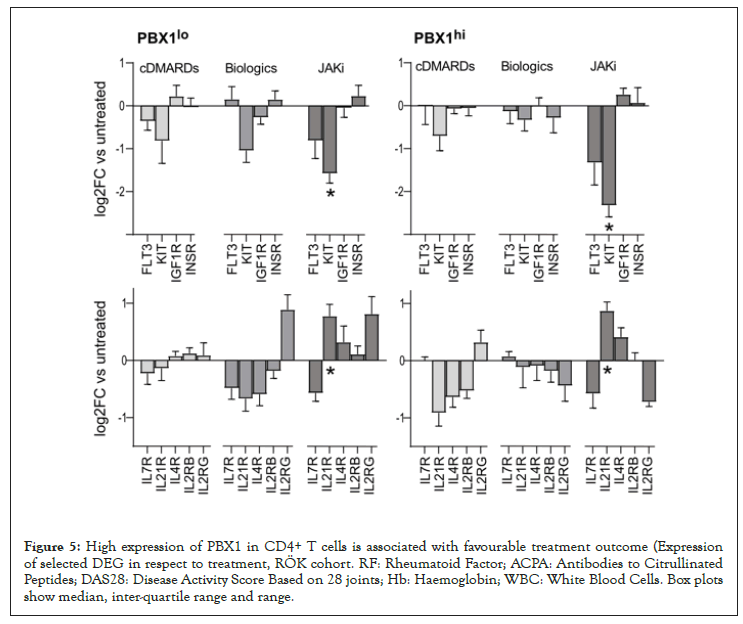
Figure 5: High expression of PBX1 in CD4+ T cells is associated with favourable treatment outcome (Expression of selected DEG in respect to treatment, RÖK cohort. RF: Rheumatoid Factor; ACPA: Antibodies to Citrullinated Peptides; DAS28: Disease Activity Score Based on 28 joints; Hb: Haemoglobin; WBC: White Blood Cells. Box plots show median, inter-quartile range and range.
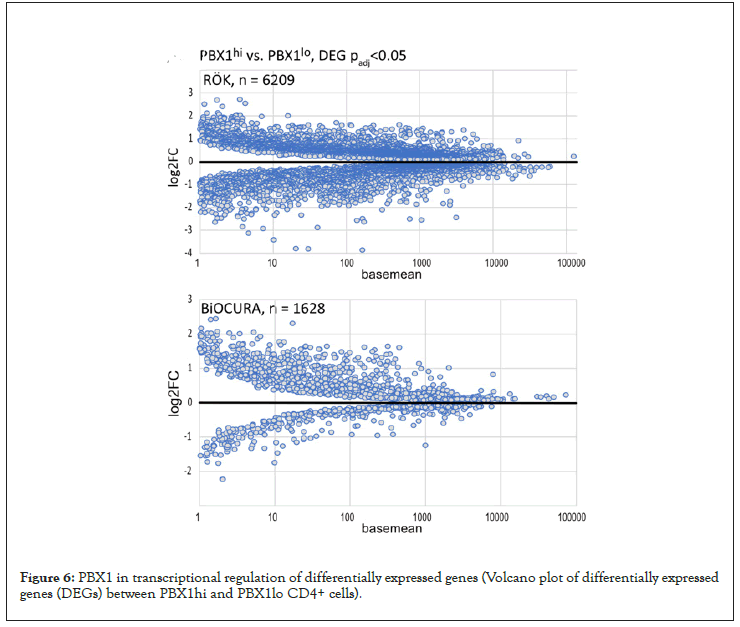
Figure 6: PBX1 in transcriptional regulation of differentially expressed genes (Volcano plot of differentially expressed genes (DEGs) between PBX1hi and PBX1lo CD4+ cells).
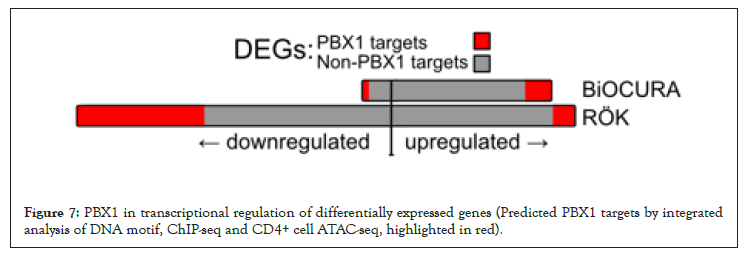
Figure 7: PBX1 in transcriptional regulation of differentially expressed genes (Predicted PBX1 targets by integrated analysis of DNA motif, ChIP-seq and CD4+ cell ATAC-seq, highlighted in red).
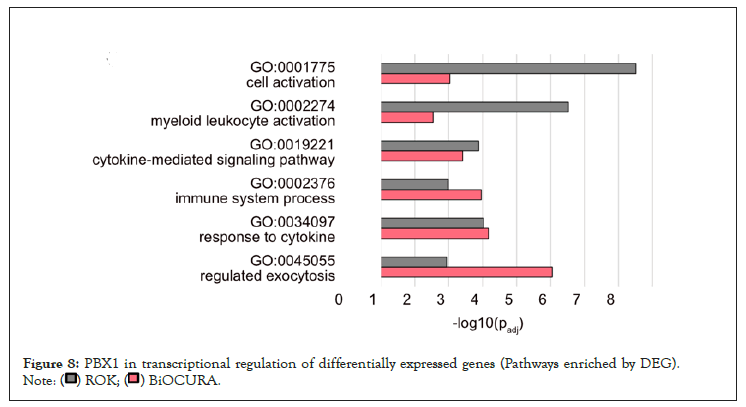
Figure 8: PBX1 in transcriptional regulation of differentially expressed genes (Pathways enriched by DEG).
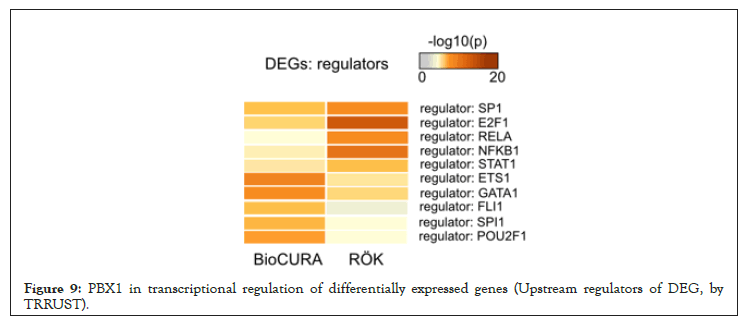
Figure 9: PBX1 in transcriptional regulation of differentially expressed genes (Upstream regulators of DEG, by TRRUST).
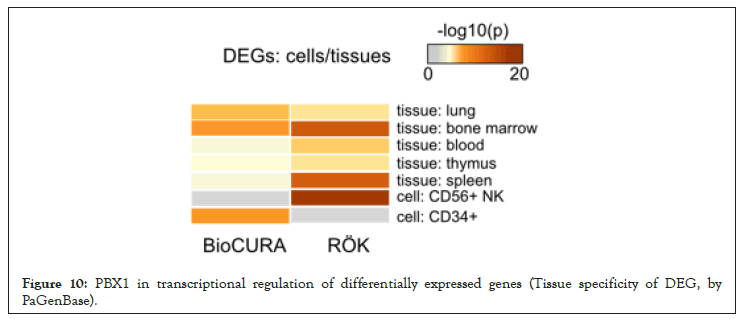
Figure 10: PBX1 in transcriptional regulation of differentially expressed genes (Tissue specificity of DEG, by PaGenBase).
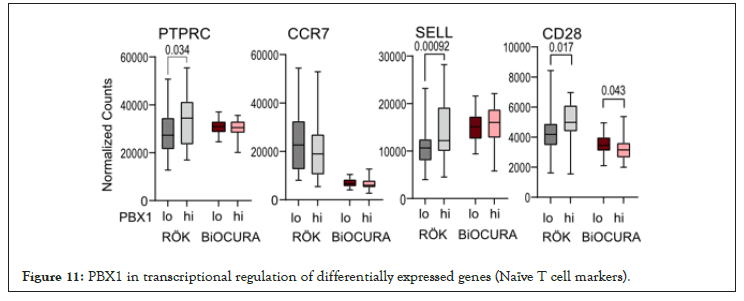
Figure 11: PBX1 in transcriptional regulation of differentially expressed genes (Naïve T cell markers).
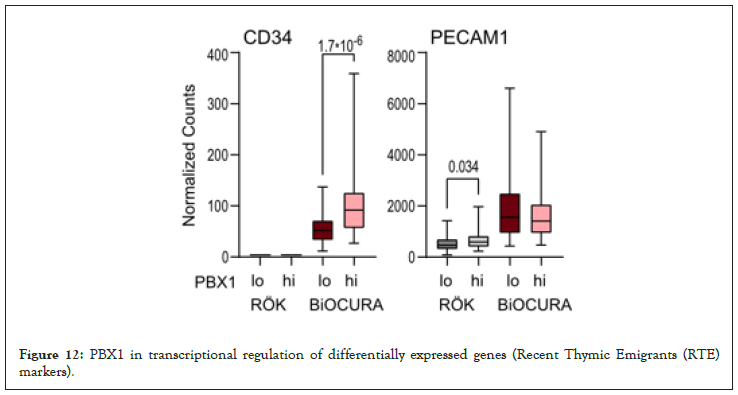
Figure 12: PBX1 in transcriptional regulation of differentially expressed genes (Recent Thymic Emigrants (RTE) markers).
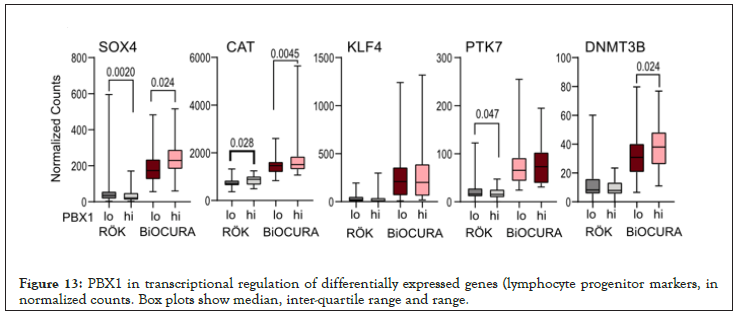
Figure 13: PBX1 in transcriptional regulation of differentially expressed genes (lymphocyte progenitor markers, in normalized counts. Box plots show median, inter-quartile range and range.
Patients
Eighty-seven randomly selected RA patients at Sahlgrenska University Hospital, Gothenburg were enrolled in the RÖK cohort between September 2018 and October 2020. The study was approved by the Swedish Ethical Review Authority (659-2011) and was performed in accordance with the Declaration of Helsinki. The trial is registered at ClinicalTrials.gov with ID NCT03449589. Seventy-eight RA patients naïve to biological treatment were obtained from the Biologicals and Outcome compared and predicted Utrecht region in Rheumatoid Arthritis (BioCURA) cohort collected between June 2009 and October 2012 [17,28].
All RA patients fulfilled the EULAR/ACR classification criteria [29] and gave their written informed consent prior to the blood sampling. At inclusion, patients were clinically examined and the disease activity score (DAS), global health assessment, and the patient’s pain experience were recorded. DAS was based on assessment of 28 (DAS28) tender and swollen joints and Erythrocyte Sedimentation Rate (ESR). The global health and pain were measured by a 100 mm visual analogue scale. Clinical characteristics of the patients are shown in Table 1.
| ROK | BiOCURA | ||||
|---|---|---|---|---|---|
| PBX1hi (n=44) |
PBX1lo (n=43) |
PBX1hi (n=32) |
PBX1lo (n=46) |
P | |
| PBX1 Expression | 29.4 | 10.5 | 78.5 | 38.9 | <0.0001 |
| Age, y | 56.3 | 59.4 | 54.5 | 55.6 | 0.016 |
| Disease duration, y | 10.9 | 13.3 | not available | ||
| Sex, % female | 100 | 100 | 65.6 | 73.9 | |
| RF/ACPA, % | 70 | 74 | 82 | 76 | |
| DAS28 | 2.62 | 2.70 | 4.46 | 4.66 | <0.0001 |
| Platelets, × 109/L | 280 | 278 | 290 | 275 | |
| Hb, g/L | 135 | 136 | 139 | 135 | |
| WBC, × 109/L | 5.9 | 64 | 7.9 | 7.6 | <0.0001 |
| Lymphocytes, × 109/L | 1.7 | 1.8 | not available | ||
Table 1: High expression of PBX1 in CD4+ T cells is associated with favourable treatment outcome (Patient characteristics).
In the RÖK cohort, a follow up of anti-rheumatic treatment was performed through medical records 2 years later by pre-defined key evaluation questions. All cases and time point for change of medication were registered. In the BioCURA cohort, the patients started treatment with adalimumab or etanercept and were followed 3 and 6 months after the start of treatment. DAS28 and subsequently the treatment response compared with baseline were calculated [30].
Cell isolation and culturing
Human PBMC were density gradient separated from the peripheral blood on Lymphoprep (Axis-Shield PoC As, Norway). CD4+ cells were isolated using positive selection (Invitrogen, 11331D), and then cultured (1.25 × 10⁶ cells/ml) in the presence of Concanavalin A (ConA, 0.625 μg/ml) and LPS (5 μg/ml) for 72 h in RPMI medium supplemented with 10% fetal bovine serum (all, Sigma- Aldrich, St.Louis, MO, USA), 4 mM Glutamax (Gibco), 50 mM β-mercaptoethanol (Gibco), and 50 mg/mL gentamycin (Sanofi- Aventis, Paris, France) at standard conditions of temperature, CO2 pressure and humidity.
RNA sequencing (RNA-seq)
RNA from CD4+ cell cultures was prepared using the micro mRNA kit (Norgen, Ontario, Canada). Quality control was done by Bioanalyzer RNA6000 Pico on Agilent 2100 (Agilent, St. Clara, CA, USA). Deep sequencing was done by RNA-seq (Hiseq2000, Illumina) at the LifeScience Laboratory, Huddinge, Sweden. Raw sequence data were obtained in Bcl-files and converted into fastq text format using the bcl2fastq program from Illumina. Fastq- files and the processed reads are deposited in Gene Expression Omnibus at the National Center Biotechnology Information with the accession codes GSE201669, GSE190349 and GSE201667 for the RÖK-cohort and GSE138747 for the BioCURA cohort [17].
RNA-seq analysis
Mapping of transcripts was done using Genome UCSC annotation for hg38 human genome assembly. The Differentially Expressed Genes (DEGs) were identified by R-studio using Benjamini- Hochberg adjustment for multiple testing (Bioconductor package, “DESeq2” version 1.26.0). Volcano plots were made with “EnhancedVolcano” (version 1.4.0). Correlation analysis was done with “Hmisc” (version 4.5) and built-in statistics, the correlation heatmap was built with “Corrplot” (version 0.85). Clustering of DEG was based on Spearman correlation for distance with “factoextra” (version 1.0.7) and hierarchical clustering with Ward. D2
Bioinformatics analysis
PBX1 ChIP-seq peaks from human A549 pulmonary epithelial cell line, RCH-ACV lymphoblastic leukemia cells and 697 acute lymphoblastic leukemia cell line were retrieved from ReMap database (2022 version [31]) and a list of non-redundant PBX1 peaks was built. PBX1 peaks were integrated with the open chromatin areas (min overlap 1 bp) in activated CD4+ T cells (GSE138767, [32] based of ATAC-seq). Prediction of PBX1 target genes in CD4+ cells was performed in GREAT analysis (http://great.stanford.edu/ public/html/index.php, 2021 version) using the fraction of PBX1 peaks exactly overlapping with CD4 ATAC peaks. PBX1 targets in ChIP Enrichment Analysis (CHEA database) were selected according to Harmonizome data source [33].
Functional enrichment analysis was done in Metascape (https:// metascape.org/) for Gene Ontology for biological processes (GO: BP) and molecular function (GO: MF); and transcriptional regulatory categories based on transcriptional networks the TRRUST database [34]. Tissue origin of PBX1 targets in T cells was analyzed in the Human Bone Marrow Atlas, Immgen cell populations within the Immunological Genome Project consortium database, and Immune Signatures Database within GSEA project [35] through the ToppFun tool (https://toppgene.cchmc.org/).
Functional enrichment analysis utilized FDR 5% p-value adjustment limited to at least 2 genes from the analyzed category. To avoid bias by T cell specific genes and processes, we used custom background constructed from RNA-seq of the analyzed RA cohorts and healthy donors filtered on protein-coding genes expressed in CD4+T cells (Base mean above 1).
Thymic single cell (SC) RNA-sequencing
PBX1 expressing cells in thymus were identified in Atlas of human thymic development [36], containing 130000 scRNA-seq datasets. The whole cell census was used for co-clustering analysis based on EBI scRNA-seq (UMAP, k=36, nearest neighbours=20). Unsupervised Uniform Manifold Approximation and Projection (UMAP) were used to combine PBX1 with known cell pattern (Figure 14-19).
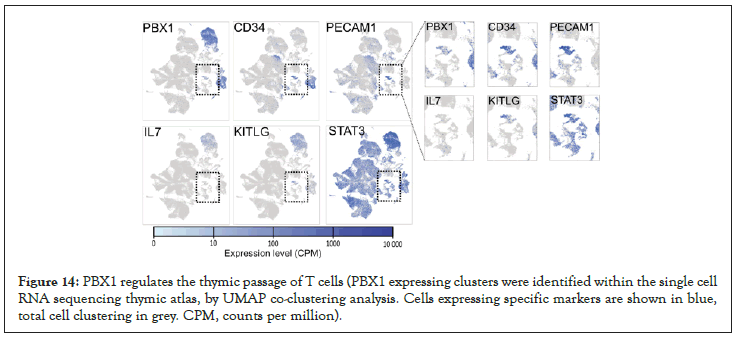
Figure 14: PBX1 regulates the thymic passage of T cells (PBX1 expressing clusters were identified within the single cell RNA sequencing thymic atlas, by UMAP co-clustering analysis. Cells expressing specific markers are shown in blue, total cell clustering in grey. CPM, counts per million).
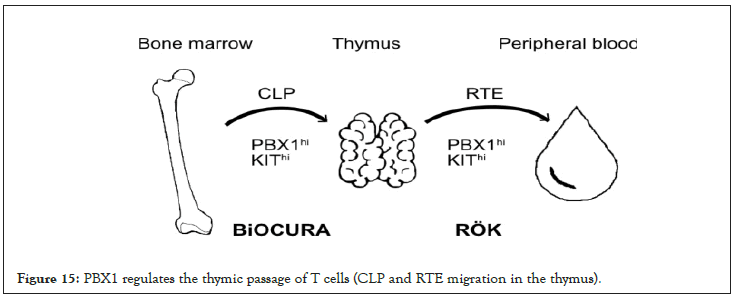
Figure 15: PBX1 regulates the thymic passage of T cells (CLP and RTE migration in the thymus).
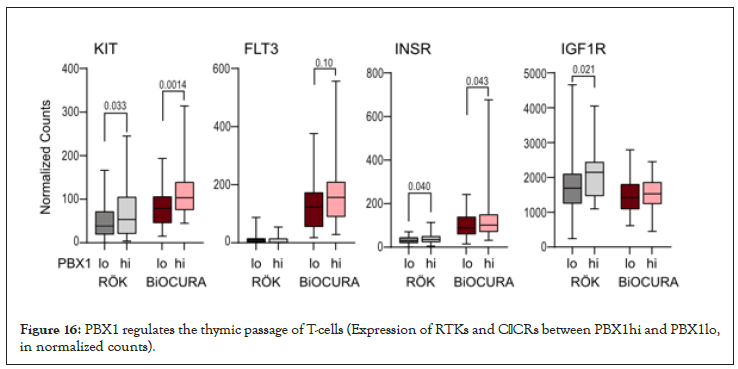
Figure 16: PBX1 regulates the thymic passage of T-cells (Expression of RTKs and CβCRs between PBX1hi and PBX1lo, in normalized counts).
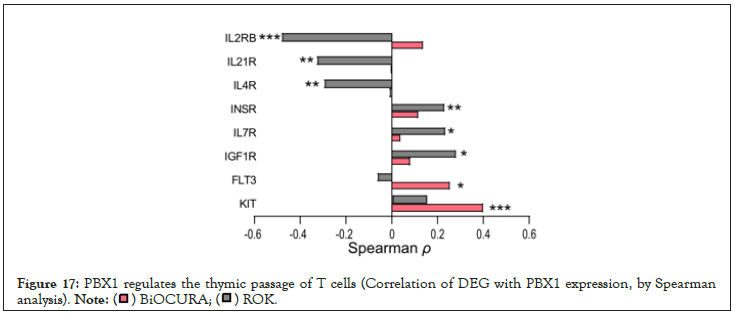
Figure 17: PBX1 regulates the thymic passage of T cells (Correlation of DEG with PBX1 expression, by Spearman analysis).
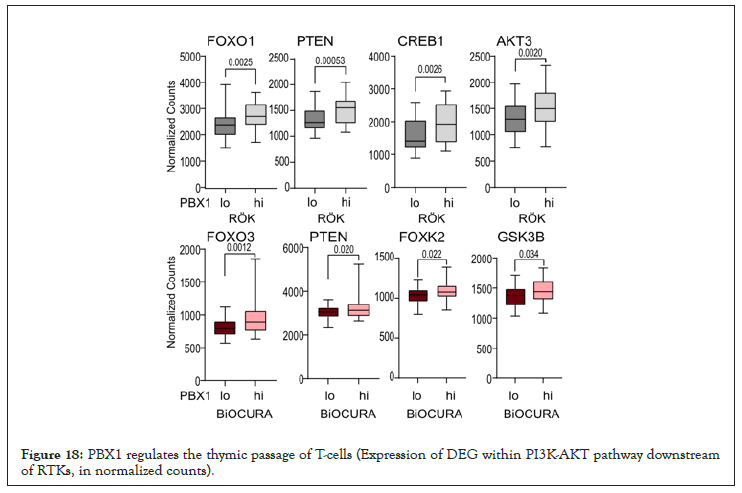
Figure 18: PBX1 regulates the thymic passage of T-cells (Expression of DEG within PI3K-AKT pathway downstream of RTKs, in normalized counts).
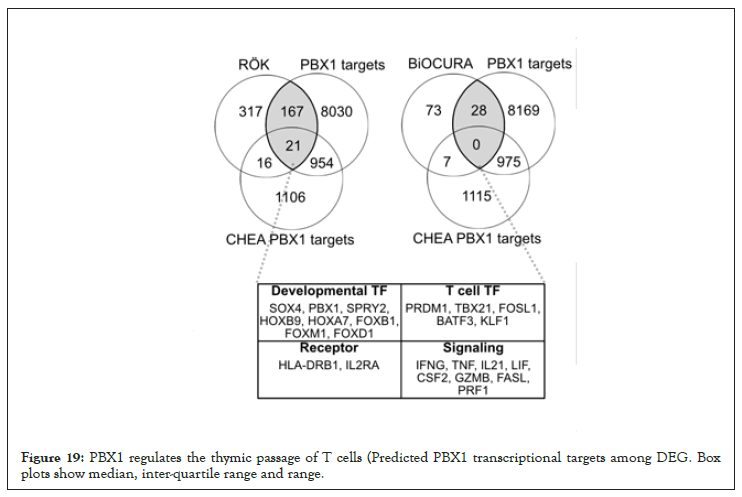
Figure 19: PBX1 regulates the thymic passage of T cells (Predicted PBX1 transcriptional targets among DEG. Box plots show median, inter-quartile range and range.
Statistics analysis
Stratification of the cohorts was done by median expression of PBX1. DEG expression analysis was performed using DESeq2 Bioconductor package in R version 4.1.1 [37]. Enriched pathways were analyzed with g: Profiler [38]. Difference between groups and correlations were determined using Mann-Whitney U-test and Spearman´s rank test, respectively, using Graphpad Prism 8. The p-values below 0.05 were considered significant. Table 1 and Figure 4 were performed using the Mann-Whitney statistics and Figures 1-3 was performed using chi-square test. Figure 11 and Figure 13 was performed using non-parametric Mann-Whitney statistics. Group comparison where Figure 16 and Figure 18 was performed using the Mann-Whitney statistics.
We show that PBX1 enrichment in CD4+T cells reflects proportion of the pre-thymic CLP in active RA and the post-thymic RTE in patients with well-controlled inactive RA. This supports the notion that inflammation controls the thymic output in RA patients [1,2] and suggests that a shift between pre-thymic to post-thymic PBX1hiT cells could be attributed to involvement of PBX1 in T-cell development and thymic trafficking. We found that presence of PBX1hiCD4+ cells was favorable for the RA patients. In one case, it predicted higher probability of response to anti-TNF treatment, and in another case, it was associated with significantly lower treatment demand to control the RA disease activity. Thus, the ability to maintain PBX1hi pool of T cells increases the probability of treatment success in RA. Prospective follow up demonstrated that the enrichment with PBX1hiCD4+ cells was associated with a higher probability to intensify anti-rheumatic treatment. The decision was done by rheumatologists on the intention-to-treat basis and independently of the PBX1 status. Thus, PBX1hiCD4+ cells could present a reservoir harboring hazardous and potentially auto-reactive cells [13], which could also notify that the patient is sensitive to treatment. Differentiation of naïve T cells ex vivo demonstrated that the activation of the IL7/IL15, Wnt/b-catenin and Notch signaling pathways, partially controlled by PBX1 [24], triggered the expansion of autoreactive stem-cell-like memory T cells [10,12,13]. Thus, acting as transcriptional repressor PBX1 exerts an executive mechanism preventing this expansion.
The analysis of CD4+ cells of RA patients demonstrated an association between PBX1 expression and active PI3K/Akt signaling, which argues for these mechanisms to create conditions supporting sustainability of PBX1hi cells. In both patient cohorts, we found that PBX1hi cells express high levels of RTK c-KIT, FLT3, IGF1R, INSR. On the one hand, this makes them susceptible to stimulation with growth factors KIT-ligand, FLT3-ligand, IGF1, and insulin, known to enhance the post-thymic development of CD4+ cells and to control expansion of the T cell pool. On the other hand, the signal through the RTK results in the activation of Akt and provides strong positive feedback to PBX1 production [44,45].
The production of PBX1 in immature leukocytes protects the quiescent state of pluripotent cells [21,22,46]. The observation that PBX1hiCD4+ cells were associated with good treatment response in RA patients suggests that the mechanisms maintaining PBX1 production also keep T cells under control [47]. The PBX1hi cells in both cohorts were associated with high expression of c-KIT essential to maintain the production of PBX1 in immature leukocytes [21,22,46]. In combination with CXCR4 and CβCR, it warrants the readiness of PBX1hi cells for action, expansion, and migration. Anti-rheumatic treatment did not seem to eliminate PBX1hi cells but supported their passage through the thymus giving rise to RTE to deepen RA remission.
This study demonstrates that the pluripotency of naïve CD4+T cells helps to identify the RA patients with lower treatment demand to reach remission and higher probability for response to anti-TNF treatment. Our study is done on a cross-sectional patient material highly divergent with respect to treatment modality, which could have biased the outcome and calls for broader pharmacological studies.
We would like to thank David Brodin and Tassos Damdimopoulos at the Bioinformatic and Expression Analysis core facility at SciLife lab, Karolinska Institute, Huddinge for their help with the RNA sequencing.
The authors declare no conflict of interest.
This work was supported by the Swedish Research Council [2017- 03025 and 2017-00359 to M.I.B]; the Swedish Association against Rheumatism [R-566961; R-751351 and R-860371 to M.I.B]; the King Gustaf V:s 80-year Foundation [FAI-2018-0519 and FAI-2020- 0653 to M.I.B]; and the Regional agreement on medical training and clinical research between the Western Götaland county council and the University of Gothenburg [ALFGBG-717681 and ALFGBG-965623 to M.I.B].
Fastq-files and the processed reads are deposited in Gene Expression Omnibus at the National Center Biotechnology Information with the accession codes GSE201669, GSE190349 and GSE201667 for the RÖK-cohort and GSE138747 for the BiOCURA cohort. Other data that support the findings of this study are available upon reasonable request and by contacting the corresponding author.
Citation: Andersson KME, Malmhäll-Bah E, Oparina N, Tao W, Pandit A, Erlandsson MC, et al. (2022) Pluripotency Factor PBX1 Predicts Treatment Efficacy in Rheumatoid Arthritis. J Clin Cell Immunol. 13:668.
Received: 10-Jun-2022, Manuscript No. JCCI-22-17886; Editor assigned: 14-Jun-2022, Pre QC No. JCCI-22-17886 (PQ); Reviewed: 28-Jun-2022, QC No. JCCI-22-17886; Revised: 05-Jul-2022, Manuscript No. JCCI-22-17886 (R); Published: 12-Jul-2022 , DOI: 10.35248/2155-9899.22.13.668
Copyright: © 2022 Andersson KME, et al. This is an open access article distributed under the terms of the Creative Commons Attribution License, which permits unrestricted use, distribution, and reproduction in any medium, provided the original author and source are credited.