Journal of Geography & Natural Disasters
Open Access
ISSN: 2167-0587
+44-77-2385-9429
ISSN: 2167-0587
+44-77-2385-9429
Research Article - (2023)Volume 13, Issue 2
This current research aims to perceive the depositional energy environment of Jagatsinghpur coastal area sediments with the outcome of textural aspects of particle size dissemination and Magnetic Susceptibility (MS). In the study, 36 sediment samples were recovered from 12 locations, with 3 points such as Low Tide (LT), High Tide (HT), and Berm (BM), at every 5 km interval. To observe outcomes from different parameters such as Mean (MQ), Standard Deviation (SD), Skewness (SK) and Kurtosis (KU), bivariate plots, and MS methods were adopted. The MQ and SD of LT, HT, and BM infer medium to fine sand with a moderately to well-sorted nature, while the SK and KU of LT, HT, and BM infer extremely coarse skewed to fine skewed with platykurtic to extreme leptokurtic nature. Textural parameters show the southern part of the study area experienced a low energy condition. The energy process plot indicates sediments fall in the inner shelf and river environment. The CM (C=One percentile in micron, M= Median in micron) plot expressed the sediment samples' reactions as graded suspension and rolling mechanisms. The MS of low frequency, the higher quantity of magnetic content of 3 zones: Low Tide (LT), High Tide (HT), and Berm (BM), has been 62.57 × 10⁻⁸ m3kg-3, 72.83 × 10⁻⁸ m3kg-3, and 454.63 × 10⁻⁸ m3kg-3. The Pearson’s Correlation signifies the +ve relationship between Berm low frequency and Berm Mean, low tide means (r2=0.57, r2=0.40) signifies the multi- source of sediment deposition. From the output, the northern part of the study infers a high-energy environment.
Particle size; Low tide; High tide; Berm; Pearson’s correlation
The textural aspects of the particle size difference are efficient criteria to comprehend the natural sedimentation in the coastal area [1-7]. It is used to investigate sedimentation via multi-agent transport. If MQ, SD, SK, and KU assist us in deciding the textural aspects of particle size dissemination and sedimentation conditions [5,8-16]. The particle size aspects reveal extreme and moderate energy conditions [17]. Tanner distinguished higher energy field sediments from lower energy field sediments in the closed basin [18].
The particle size dissemination and CM plot exhibit fluvial and deltaic environments [19]. It assists in predicting the processes of shift and sedimentation. It is both capable and inadequate to aid the coarsest particles in suspension since they are portrayed by underwater turbulence. The particles below 31 microns took too much time to deposit in the environment [20]. Mud has a median size of 3 microns and a one-percentile C range of 20 to 33 microns [19]. The energy process diagram describes the sedimentation environment with the assistance of mean contra sorting [21].
The MS of low-frequency criteria assists in predicting magnetic material in sediments. It is used to define the anthropogenic pollution of the sedimentation condition. Fossil fuels, pesticides, and fertilisers are the main anthropogenic products contaminating the sediments and boosting the MS [22]. The MS value infers the details of the concentration and mineralogy of magnetic components in the grains [23].
Study area
The study site as shown in Figure 1, Jagatsinghpur coast, extends from latitudes 20°20’55" N to 19°55’59" N and longitudes 89°47’26" E to 86°17’17" E on the east coast of India. An area extends between Mahanadi and the Devi River. The geology of the study site is distributed into 5 quaternary formations. They are older and younger beach deposits; lower and upper delta deposits; and present-day coastal and flood plain deposits. Older beach deposits comprise compact sand and silt, which occur as small patches within the lower delta deposit. The lower and upper delta deposits comprise sandy silt and silty clay. The ultimate variation versus the lower delta is that the lower delta is a marine deposit and the upper delta consists of fluvial deposits. The younger deposits occupying the oceanfront of the Bay of Bengal contain very fine sand to silt. In the present situation, fluvial deposits consist of sand and silt patches in the lower delta. The study site’s geomorphology is viewed as flood plain and coastal plains of the corresponding age and younger than the matured delta plain.
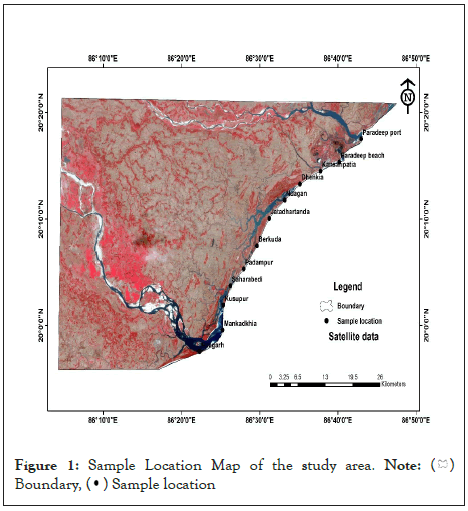
Figure 1: Sample Location Map of the study area.
Note: ( )
Boundary, (
 ) Sample location
The 1-meter depth (top, middle, and bottom) sediment samples were collected at every 5 km interval, in 12 locations, totalling 36 samples (12 Low tide Zone, 12 High tide Zone, and 12 Berm zone) along the coastal region. The sediments were recovered in the polythene bags. The sample geo-coordinates details are given in Table 1. A hot-air oven at 60° assists in unmoisturizing the sediment sample and then the conning and quartering method to assure uniformity of the sample. The 30% of H2O2 was treated to define the total organic content, and 1:1 HCL was treated to dissolve the calcareous shelly fragments in the sediments. Sieving techniques executed in an ASTM (American Standard Test Sieve Series) sieve shaker allow for distinct grain size. The LA-300 Horiba equipment approach to studying the textural aspects of particle size dissemination. The Sediplot and Surfer software are utilised for other aspects, and the ArcGIS (10.5) software for the determination of digitising the location map, geology and geomorphology maps. The utility of Bartington Instrument Ltd. with the MS2B Dual-frequency sensor to survey the frequency of the magnetic particles.
| Sample No | Location | Longitude | Latitude |
|---|---|---|---|
| 1 | Paradeep port | 86°42’58’’ | 20°17’31’’ |
| 2 | Paradeep beach | 86°40’12’’ | 20°15’19’’ |
| 3 | Kansaripatia | 86°37’46’’ | 20°14’30’’ |
| 4 | Dhenkia | 86°35’08’’ | 20°13’18’’ |
| 5 | Nuagaon | 86°33’11’’ | 20°11’47’’ |
| 6 | Jatadhartanda | 86031’13’’ | 20°10’03’’ |
| 7 | Berkuda | 86°29’38’’ | 20°07’29’’ |
| 8 | Padampur | 86°27’56’’ | 20°05’18’’ |
| 9 | Saharabedi | 86°26’16’’ | 20°03’43’’ |
| 10 | Kusupur | 86°25’19’’ | 20°01’54’’ |
| 11 | Mankadkhia | 86°25’14’’ | 19°59’33’’ |
| 12 | Nuagarh | 86°22’18’’ | 19°57’32’’ |
Table 1: Geo Co-ordinate System of the Sample location in the study site
The "frequency curvature" of low tide defines the bimodal distribution, having peaked at 2 φ and 3 φ. The high tide and Berm exhibit bimodal distribution, having a peek at 2 φ and a subdued peak at 3 φ. The frequency curvature of High Tide and Berm exhibits peakedness higher than Low Tide at 2φ and less than that of Low Tide at 3 φ, exhibiting persuasion of coarser fraction materials.
In the "Graphic Mean" as shown in Figure 2, the LT samples fluctuate from 1.31 φ to 2.45 φ, the HT samples fluctuate from 1.60 φ to 2.15 φ and the BM samples fluctuate from 1.65 φ to 2.33 φ, indicating the condition falls in the medium to finer sand. The deportation of fine fractions in the high-energy condition is mostly in the northern part. The decreasing sand size in the front of the southern part expresses the weaker hydrodynamics.
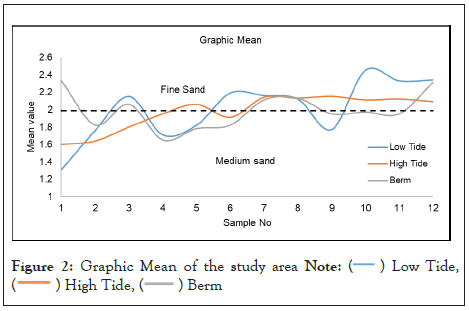
Figure 2: Graphic Mean of the study area
Note: ( ) Low Tide,
(
 ) High Tide, (
 ) Berm
In "Graphic standard deviation" as shown in Figure 3, the LT fluctuates from 0.43 φ to 0.85 φ, the HT fluctuates from 0.49 φ to 0.60 φ, and Berm fluctuates from 0.41 φ to 0.72 φ, indicating moderately sorted to well-sorted characteristics as suggested by Folk and Ward [8].
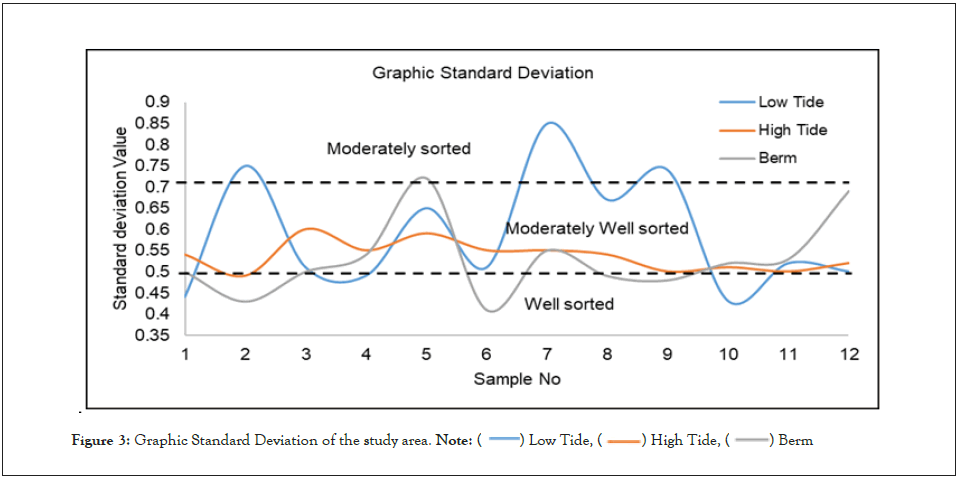
Figure 3: Graphic Standard Deviation of the study area.
Note: ( ) Low Tide,
(
 ) High Tide, (
 ) Berm
"Graphic skewness" is an important tool to perceive the shore area's environmental aspects. The LT fluctuates from -0.42 to 0.18, the HT fluctuates from -0.05 to 0.53, and the BM fluctuates from -0.38 to 0.68, indicating Figure 4 a very coarse skewed to very fine skewed nature. The LT locations such as Paradeep Beach, Berkuda, Padampur, Kusupur, Mankadkhia, and Nuagarh show -Ve skewness. The HT locations at Berkuda and Nuagarh show -ve skewed nearly symmetrical nature, and the Berm location at Paradeep port exhibits the -ve skewness. The positive skewness indicates a very finely skewed unidirectional shipment deposited under low energy conditions. The -ve skewness infers very coarse skewed shows the high-energy condition. The fine- grained sediments display the lack of tail end that exhibits the marine origin sediments. The nearly symmetrical nature defines the influence of sand [24].
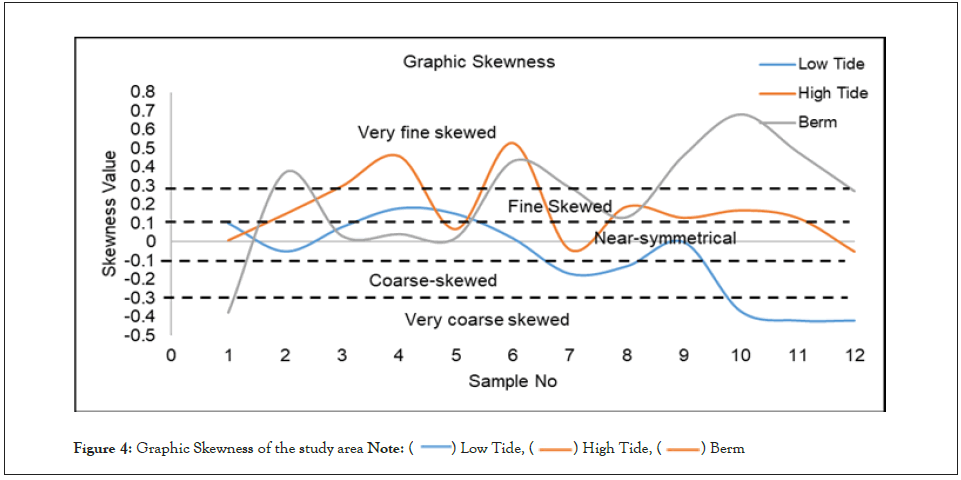
Figure 4: Graphic Skewness of the study area
Note: ( ) Low Tide,
(
 ) High Tide, (
 ) Berm
The "Graphic Kurtosis" aids in measuring the peaks. The LT locations fluctuate from 0.69 to 1.66, the HT location fluctuates from 0.69 to 2.90, and the BM location fluctuates from 0.71 to 3.42, indicating Figure 5 the platykurtic to extreme leptokurtic nature. Extreme leptokurtic nature can be found at Paradeep beach in the HT and Dhenkia in the berm. The two populations of a subequal quantity of sediments exhibit a leptokurtic nature with the high-energy condition. The Platykurtic nature of the sediments exhibits a low energy mechanism of ill-sorted sediments with poor winnowing. The governance of the Platykurtic nature of sediments in the southern part of the study site exhibits a low energy condition [8] as shown in Table 2.
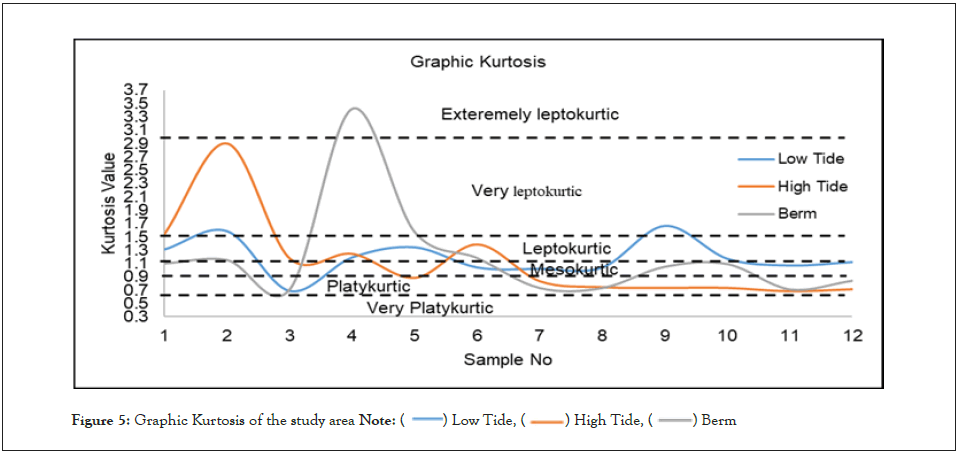
Figure 5: Graphic Kurtosis of the study area
Note: ( ) Low Tide,
(
 ) High Tide, (
 ) Berm
| LOW TIDE | HIGH TIDE | BERM | ||||||||||
|---|---|---|---|---|---|---|---|---|---|---|---|---|
| S.NO | M-Q | SD-Q | SK | KU | M-Q | SD-Q | SK | KU | M-Q | SD-Q | SK | KU |
| 1 | 1.31 | 0.44 | 0.1 | 1.31 | 1.6 | 0.54 | 0.01 | 1.55 | 2.33 | 0.5 | -0.38 | 1.1 |
| 2 | 1.76 | 0.75 | -0.05 | 1.58 | 1.64 | 0.49 | 0.15 | 2.9 | 1.82 | 0.43 | 0.37 | 1.15 |
| 3 | 2.15 | 0.51 | 0.08 | 0.69 | 1.8 | 0.6 | 0.3 | 1.18 | 2.06 | 0.5 | 0.03 | 0.71 |
| 4 | 1.71 | 0.49 | 0.18 | 1.19 | 1.95 | 0.55 | 0.46 | 1.25 | 1.65 | 0.54 | 0.04 | 3.42 |
| 5 | 1.82 | 0.65 | 0.15 | 1.34 | 2.06 | 0.59 | 0.07 | 0.89 | 1.78 | 0.72 | 0.02 | 1.57 |
| 6 | 2.19 | 0.51 | 0.02 | 1.04 | 1.91 | 0.55 | 0.53 | 1.39 | 1.82 | 0.41 | 0.43 | 1.18 |
| 7 | 2.16 | 0.85 | -0.17 | 1.02 | 2.14 | 0.55 | -0.04 | 0.84 | 2.11 | 0.55 | 0.29 | 0.73 |
| 8 | 2.12 | 0.67 | -0.13 | 1.04 | 2.13 | 0.54 | 0.19 | 0.75 | 2.13 | 0.49 | 0.13 | 0.73 |
| 9 | 1.77 | 0.74 | 0 | 1.66 | 2.15 | 0.5 | 0.13 | 0.74 | 1.95 | 0.48 | 0.46 | 1.05 |
| 10 | 2.45 | 0.43 | -0.37 | 1.17 | 2.11 | 0.51 | 0.17 | 0.74 | 1.97 | 0.52 | 0.68 | 1.09 |
| 11 | 2.33 | 0.52 | -0.42 | 1.07 | 2.12 | 0.5 | 0.13 | 0.69 | 1.95 | 0.53 | 0.48 | 0.71 |
| 12 | 2.34 | 0.5 | -0.42 | 1.12 | 2.09 | 0.52 | -0.05 | 0.72 | 2.31 | 0.69 | 0.27 | 0.84 |
| Min | 1.31 | 0.43 | -0.42 | 0.69 | 1.6 | 0.49 | -0.05 | 0.69 | 1.65 | 0.41 | -0.38 | 0.71 |
| Max | 2.45 | 0.85 | 0.18 | 1.66 | 2.15 | 0.6 | 0.53 | 2.9 | 2.33 | 0.72 | 0.68 | 3.42 |
Note: M-Q = Graphic Mean Phi; SD-Q = Graphic Standard Deviation Phi; SK= Graphic Skewness; KU= Graphic Kurtosis
Table 2: Textural Aspects of particle size dissemination
The energy process diagram means vs. sorting [21]. Figure 6 represents the LT, HT, and BM sediments that were slipped in the river process and inner shelf. From all zones, a few samples plotted on the inner shelf and the remaining samples in the river environment exhibit the sediments shifted by the river input and littoral current.
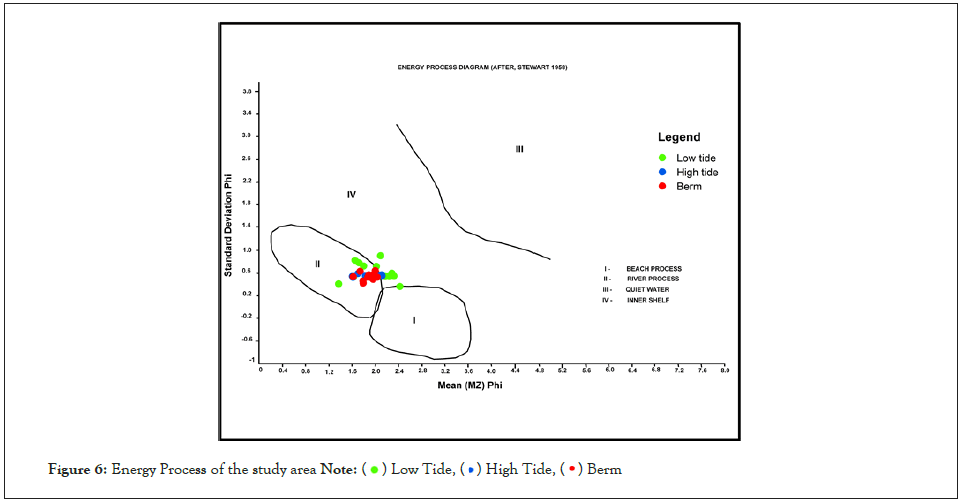
Figure 6: Energy Process of the study area
Note: ( ) Low Tide, (
 ) High Tide, (
 ) Berm
The Bivariate Plot Mean vs. sorting [18] represented in Figure 7 the LT samples of Paradeep Port, Paradeep Beach, Kansaripatia, Nuagaon, Berkuda, Padampur, and Saharabedi plot in an open channel-high energy condition. The HT samples of Paradeep Port, Paradeep Beach, Kansaripatia, Dhenkia, Jatadhartanda, and Berm samples of Dhenkia, and Nuagaon, were plotted in an open channel-high energy condition. Low tide, High tide, and Berm show that few samples are present in the open channel-a high-energy condition in the northern part of the locations. It reveals that tidal activities are higher in the northern location.
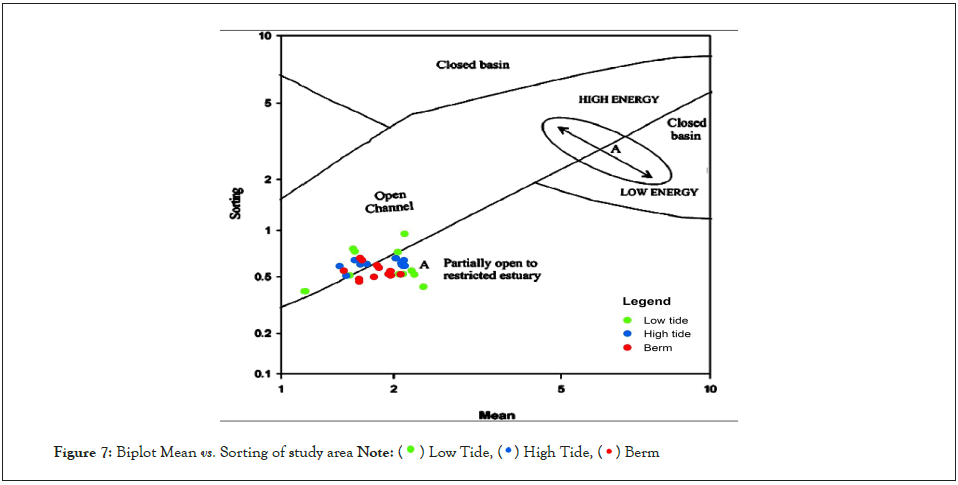
Figure 7: Biplot Mean vs. Sorting of study area
Note: ( ) Low Tide, (
 ) High Tide, (
 ) Berm
In Figure 8, the CM pattern reveals the pattern of hydrodynamic energy deposition [7,25,26]. From the 3 zones, entire samples fall into the PQ (P=Rolling and suspension, Q=Suspension and rolling), the QR (Q=Suspension and rolling, R=Graded suspension) exhibits graded suspension, and the rolling mechanism of transportation proposes the feasibility of flood-driven sediments in the river environment. These patterns emulate the existence of wave interaction in low tidal sectors at the period of deposition, whereas the re-suspended sediments were deposited in high tidal zones [5].
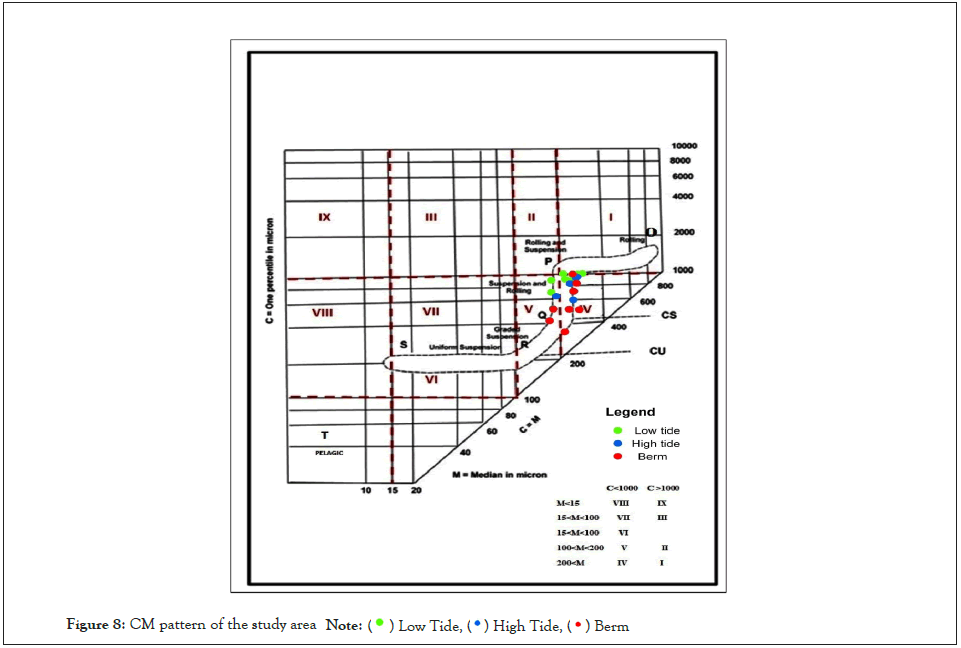
Figure 8: CM pattern of the study area
Note:( ) Low Tide, (
 ) High Tide, (
 ) Berm
The MS of low-frequency aids in detecting the number of magnetic contents in sediment samples. In Figure 9, the low frequency of the LT zone fluctuates from 6.77 × 10⁻⁸ m3kg-3 to 62.57 × 10⁻⁸ m3kg-3, indicating the Paradeep Port location. The HT zone fluctuates from 7.00 × 10⁻⁸ m3kg-3 to 72.83 × 10⁻⁸ m3kg-3, indicating the Padampur location. The Nuagarh location has a high magnetic content in the sediments if the BM zone fluctuates between 4.10 × 10⁻⁸ m3kg-3 and 454.63 × 10⁻⁸ m3kg-3. In Table 3 the distinct origin of deposition was concluded by magnetic content in the sediment samples [27].
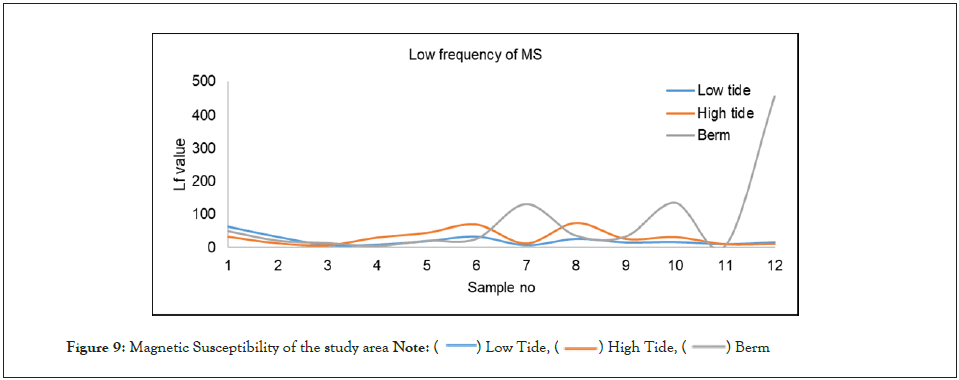
Figure 9: Magnetic Susceptibility of the study area
Note: ( ) Low Tide,
(
 ) High Tide, (
 ) Berm
| Location No | Low tide | High tide | Berm |
|---|---|---|---|
| 1 | 62.57 | 32.43 | 50.33 |
| 2 | 32.1 | 13 | 21 |
| 3 | 7.73 | 7 | 13.53 |
| 4 | 8.7 | 29.9 | 5 |
| 5 | 18.87 | 43.7 | 20.67 |
| 6 | 32.77 | 68.17 | 26.33 |
| 7 | 6.77 | 12.33 | 131.83 |
| 8 | 25.9 | 72.83 | 36.47 |
| 9 | 15.33 | 26.23 | 33.03 |
| 10 | 16.5 | 31.33 | 135.83 |
| 11 | 10 | 10.33 | 4.1 |
| 12 | 15.67 | 11.1 | 454.63 |
Table 3: Low frequency of Magnetic Susceptibility (10-8 m3kg-3)
The Pearson’s correlation coefficients used among LT low frequency, HT low frequency, BM low frequency, LT mean, HT means, and Berm means are given in Table 4. The correlation of coastal sediments reveals that the high tide means are negatively correlated (r2=-0.67) with low tide low frequency, which is substantially due to the lower magnetic content present in the high tide mean. The positive correlation happens between BM Mean and BM low frequency (r2=0.57), LT Mean vs. BM low frequency (r2=0.40), which exhibits the higher magnetic content in the LT mean, and Berm Mean signifies the different origin of sediment. The positive correlation between the LT means and HT mean (r2=0.61) signifies that mean values are nearly similar in the size distribution.
| Low tide LF | High tide LF | Berm LF | Low Tide M | High Tide M | Berm M | |
|---|---|---|---|---|---|---|
| Low tide LF | 1 | |||||
| High tide LF | 0.37 | 1 | ||||
| Berm LF | -0.12 | -0.28 | 1 | |||
| Low Tide M | -0.6 | -0.07 | 0.4 | 1 | ||
| High Tide M | -0.67 | 0.12 | 0.28 | 0.61 | 1 | |
| Berm M | 0.33 | -0.17 | 0.57 | 0.07 | -0.04 | 1 |
Note: *LF-Low Frequency, *M-Mean
Table 4: Data interpretation of MS and Particle size dissemination
In the current study, the result of the depositional environment of Jagatsinghpur coastal area sediments is characterized by grain size distribution and magnetic susceptibility. The grain size distribution exhibits mostly MQ and KU in 3 zones, and SK of the low tide zone shows low energy conditions in the southern part of the study. The bivariate plot displays the northern part of the sediments affected by the high-energy condition. In the energy process plot, which defines the domination of river input and littoral current, sediment deposition is reflected in a higher energy environment. The CM pattern also confirms that sediments are majorly high-energy conditions transported and deposited by graded suspension and rolling mechanisms. The MS infers the higher magnetic content in Paradeep Port (low tide zone), Padampur (high tide zone) and Nuagarh (Berm zone). The positive correlation coefficient signifies higher magnetic content present in the LT and BM mean. The particle size distribution between the HT mean and LT mean is nearly similar on behalf of the river and littoral currents. By the inference of the output, the northern part of the study site experienced high energy conditions compared to the southern part due to wave direction and the estuary near Paradeep beach.
The researcher did not receive any funding from any external funding agency or organization.
The dataset used and analysed during the current study is available from the corresponding author on reasonable request.
Citation: Sivaprakasam V, Gunasekaran S, Rajendran S, Palani B, Sathyanarayanan B (2023) Prediction of Coastal Hydrodynamic Quarantined in the Sediments with Utility of Textural Characteristics and Magnetic Susceptibility of Jagatsinghpur Coast, India. J Geogr Nat Disasters. 13: 270
Received: 24-Mar-2023, Manuscript No. JGND-23-22346; Editor assigned: 27-Mar-2023, Pre QC No. JGND-23-22346 (PQ); Reviewed: 11-Apr-2023, QC No. JGND-23-22346; Revised: 18-Apr-2023, Manuscript No. JGND-23-22346 (R); Published: 25-Apr-2023 , DOI: 10.35841/2167-0587.23.13.270
Copyright: © 2023 Sivaprakasam V, et al. This is an open-access article distributed under the terms of the Creative Commons Attribution License, which permits unrestricted use, distribution, and reproduction in any medium, provided the original author and source are credited.