Journal of Proteomics & Bioinformatics
Open Access
ISSN: 0974-276X
ISSN: 0974-276X
Research Article - (2011) Volume 4, Issue 1
Computational prediction of discontinuous B-cell epitopes remains challenging, but it is an important task in vaccine design. In this study, we developed a novel computational method to predict discontinuous epitope residues by combining the logistic regression model with two important structural features, B-factor and relative accessible surface area (RASA). We conducted five-fold cross-validation on a representative dataset composed of antigen structures bound with antibodies and independent testing on Epitome database, respectively. Experimental results indicate that besides the well-known RASA feature, B-factor can also be used to identify discontinuous epitopes. Furthermore, these two features are complementary and their combination can remarkably improve the prediction performance. Comparison with existing approaches shows that our method can achieve better performance in terms of average AUC value and sensitivity for predicting discontinuous B-cell epitopes.
Keywords: Discontinuous epitopes, B-factor, Relative accessible surface area, Logistic regression model.
B-cell epitopes are special regions of antigens recognized by the binding sites of immunoglobulin molecules (Van Regenmortel, 1993). These epitopes play an important role in vaccine design, disease diagnosis, and allergy research (Saha and Raghava, 2006). Although many experimental techniques have been widely used to detect B-cell epitopes, the process is both time-consuming and labor intensive. Consequently, it is indispensable to develop complementary computational methods for accurate prediction of B-cell epitopes.
B-cell epitopes can be classified as either continuous (linear) or discontinuous (conformational) epitopes. In the past twenty years, the computational methods mainly focused on the prediction of linear epitopes. Most of these methods were based on the physicochemical properties or propensity scales of amino acids, such as flexibility (Karplus and Schulz, 1985), accessibility (Emini et al., 1985), hydrophilicity (Parker et al., 1986), antigenicity (Kolaskar and Tongaonkar, 1990), turns (Pellequer et al., 1993), amino acid pair antigenicity (Chen et al., 2007) and so on. Unfortunately, the prediction performances of these methods are not satisfying. However, compared with continuous epitopes, the prediction of discontinuous epitopes is even more challenging. So far, only a few computational methods have been proposed for this task. Kulkarni-Kale et al. (2005) first established the CEP server that utilized residue solvent accessibility to predict conformational epitopes. Subsequently, Haste Andersen et al. (2006) developed DiscoTope that linearly combined the structural proximity sum of epitope log-odds ratios and contact numbers to identify discontinuous B-cell epitopes. Based on Andersen et al.'s findings, Sweredoski and Baldi (2008) presented a new predictor, BEpro, which introduced the spatial attribute of half sphere exposure into DiscoTope. In addition, Ponomarenko et al. (2008) proposed Ellipro, a web-tool that combined the residue protrusion index and a residue clustering algorithm to predict epitope residues. Rubinstein et al. (2009) developed a naïve Bayesian method based on a large number of physico-chemical and structural-geometrical properties to recognize B-cell epitopes at a patch level. Sun et al. (2009) constructed a computational sever called SEPPA for spatial epitope prediction using a novel concept of 'unit patch of residue triangle'. Recently, Liang et al. (2009) proposed a consensus scoring method to identify the antigenic epitopes based on the unbound antigen structures. Although these prediction methods have achieved success at different levels, computational identification of discontinuous B-cell epitopes is still far from being resolved.
In this paper, we present a novel prediction method to identify discontinuous B-cell epitopes. Our prediction method chooses B-factor and relative accessible surface area (RASA) as structural features and takes into consideration the spatial environment for each residue. The prediction algorithm is based on the logistic regression model to distinguish epitope residues from the rest of antigen. As is well known, the B-factor reflects the fluctuation of atoms about their average positions, which was previously proposed to predict linear epitopes by Karplus and Schulz (1985). However, at present, to the best of our knowledge, there are no studies that use this attribute as a structural feature to recognize discontinuous epitopes. Hence, following the steps of previous works, we implemented our method and evaluated its performance based on the discontinuous epitopes inferred from the structures of antigen-antibody complexes. By conducting fivefold cross-validation on a representative dataset collected by Haste Andersen et al. (2006) and independent testing on Epitome database (Schlessinger et al., 2006), we found that in addition to the widely used RASA feature, B-factor can also be utilized to recognize epitope residues and the complementarity of these two features is useful to improve the prediction performance. Comparison with other existing approaches reveals that our method is equal or better for identification of discontinuous epitopes.
Data preparation
The representative dataset of 75 antigen-antibody complexes prepared by Haste Andersen et al. (2006) was used (http://www.cbs.dtu.dk/suppl/immunology/DiscoTope) in this study. These complexes were determined by X-ray crystallography with resolution better than 3Å. The corresponding coordinate files were obtained from the Protein Data Bank (PDB) (Berman et al., 2000). The 75 antigens had been divided into 25 groups with low homology among the groups. Following the definition of Haste Andersen et al. (2006) a residue in antigens was considered to be an epitope residue if the distance between any of its atoms and any atom of antibodies is less than 4Å. As a result, this dataset contains a total of 1203 epitope residues and 13239 non-epitope residues.
Normalized B-factor
The B-factor reflects the local mobility of protein backbones and is available for structures solved by X-ray crystallography. Generally, the higher the B-factor value, the more flexible the corresponding region in protein, and vice versa. This attribute has been used to predict linear B-cell epitopes (Karplus and Schulz, 1985). Here, the B-factor of a-carbon was chosen to represent the flexibility of each residue and normalized by the following equation (Carugo and Argos, 1997):
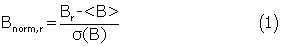
where Br is the B-factor of residue r, and σ(B) are the mean value and the standard deviation of the B-factors for the chosen antigen, respectively.
Relative accessible surface area (RASA)
The RASA is a measure of residue solvent accessibility. Several studies have evaluated the effectiveness of using RASA to predict discontinuous epitopes (Kulkarni-Kale et al., 2005; Haste Andersen et al., 2006). In our work, the accessible surface area (ASA) of each residue in unbound antigens was calculated using the DSSP program (Kabsch and Sander, 1983) and normalized by the following equation (Kuznetsov et al., 2006):
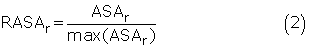
where ASAr is the ASA of residue r, max(ASAr) is the nominal maximum area of residue r (Rost and Sander, 1994).
Logistic regression model
Logistic regression is a well established statistical model suitable for probabilistic binary classification. In this study, we used the logistic regression model to differentiate whether a residue in antigens belongs to discontinuous epitope regions or not. Three logistic regression predictors were constructed using B-factor, RASA and the combination of these two features. Each predictor was input a structural window composed of a target residue and its N spatially nearest neighbors obtained by calculating the distances between the α-carbons of residues. The optimal value of N was determined by using different widow sizes as input for logistic regression model. Thus, each residue was represented by N+1 input vectors if a single feature was used and by 2×(N+1) input vectors if the combined features was used. Assuming yr∈{0, 1} and xr = { xr1 , xr2,., xrj } are the class label and input vectors for a target residue r, the logistic regression predictors assigned a probability θr = P{ yr = 1|xr } to the target residue using the logit function:
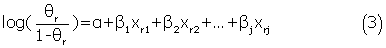
Where α, β1, β2 ,., βj are the model parameters. The logistic regression predictors were implemented with the LR-TIRLS package (http://komarix.org/ac/lr/#lr-tirls). Generally, the prediction threshold of standard logistic regression model was set to 0.5. However, in our study, the optimal threshold was determined when the predictor achieved the best Matthew's correlation coefficient (MCC) value of cross-validation.
Training and testing
The five-fold cross-validation was performed to evaluate our predictors. The 25 nonhomologous groups of antigens had been divided into five subsets by Haste Andersen et al. (2006). For each run, one subset was left out for testing, while the remaining four subsets were used for training to estimate the parameters of the logistic regression model. This process was repeated until all subsets had been tested. The final performance was obtained by averaging the performances of the five subsets. To evaluate the prediction performance, we calculated recall (sensitivity), precision, specificity, accuracy and MCC using following equations:

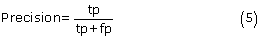


where tp, tn, fp and fn denote the numbers of true positives, true negatives, false positives and false negatives, respectively. In addition, the receiver operating characteristic (ROC) curve was drawn by plotting the false positive rate (1-specificity) on the x-axis against the true positive rate (sensitivity) on the y-axis for different prediction thresholds. The area under the ROC curve (AUC) was also reported to assess the robustnesses of our predictors. A perfect predictor achieves an AUC value of 1, and a random predictor has an AUC value close to 0.5.
Characteristics of discontinuous B-cell epitopes
Residues in the epitope and nonepitope groups from Haste Andersen et al.'s dataset were separately collected according to residue types. For each residue type, a t-test was conducted to assess whether there is a significant difference (p-value < 0.01) in a certain property (e.g., B-factor, RASA) between epitope and nonepitope residues. Figure 1(a) shows the average B-factors of the epitope and nonepitope residues. It indicates that the flexibilities of 16 residue types of epitope regions are significantly weaker than those of nonepitope regions, except for Met, Cys, Leu and Trp. This phenomenon is as expected due to the fact that regions with lower B-factors in protein complexes are often associated with interfaces between subunits (Jones and Thornton, 1995). On the other hand, from Figure 1(b), we can see that the average RASAs of epitope groups are all higher than those of nonepitope groups. The differences of RASA values of 18 residue types (excluding Phe and Cys) are statistically significant, confirming that epitope residues are more exposed to facilitate their contact with antibodies (Novotny et al., 1986). The aforementioned analyses show that B-factor and RASA can reflect the differences between epitope regions and the rest of the antigen. This implies that these two features could be used to distinguish epitope residues from nonepitope residues.

Figure 1: Characteristic comparison between epitope residues and nonepitope residues. (a) B-factor; (b) RASA. Asterisks represent statistically significant differences between epitope group and nonepitope group (p-value < 0.01, t-test).
Determination of optimal window size
An optimal window size can lead to better prediction performance. In our experiments, the optimal window size was determined by testing different structural window sizes for the logistic regression predictor based on the combined features. The number of spatially nearest residues was tested from 5 to 20. From Table 1, we can notice that the best prediction performance was achieved when N=8. Namely, the optimal window size was 9. Therefore, in the following study, we arranged a structural window with size 9 as the default input for each residue.
| N | Threshold | Recall (%) | Precision (%) | Accuracy (%) | MCC |
|---|---|---|---|---|---|
| 5 | 0.14 | 53.3 | 29.0 | 85.6 | 0.315 |
| 6 | 0.13 | 58.1 | 27.1 | 83.5 | 0.313 |
| 7 | 0.14 | 54.2 | 28.8 | 85.0 | 0.314 |
| 8 | 0.14 | 54.7 | 28.9 | 85.0 | 0.317 |
| 9 | 0.13 | 58.6 | 26.9 | 83.3 | 0.312 |
| 10 | 0.14 | 54.2 | 28.6 | 84.8 | 0.311 |
| 11 | 0.14 | 54.0 | 28.2 | 84.6 | 0.307 |
| 12 | 0.13 | 58.8 | 26.3 | 82.0 | 0.302 |
| 13 | 0.13 | 58.6 | 26.1 | 82.1 | 0.301 |
| 14 | 0.13 | 58.6 | 26.2 | 82.3 | 0.302 |
| 15 | 0.13 | 59.2 | 26.3 | 82.3 | 0.305 |
| 16 | 0.13 | 58.4 | 26.3 | 82.5 | 0.304 |
| 17 | 0.11 | 65.2 | 23.5 | 79.7 | 0.299 |
| 18 | 0.11 | 65.9 | 23.2 | 79.6 | 0.300 |
| 19 | 0.12 | 63.2 | 24.9 | 80.7 | 0.305 |
| 20 | 0.12 | 60.5 | 24.7 | 81.6 | 0.298 |
Table 1: The performance of different window sizes.
Prediction results of fivefold cross-validation
To compare the performances of our three epitope residue predictors, five-fold cross-validations were conducted on Haste Andersen et al.'s dataset. As shown in Table 2, when a single feature was used, B-factor achieved better performance than RASA. The best MCC values of these two predictors were 0.195 and 0.154, respectively. The results demonstrate that B-factor and RASA can both be used to recognize discontinuous B-cell epitopes. More interestingly, when these two features were combined for prediction, the prediction performance was improved remarkably. The MCC value of the predictor with combined features was raised to 0.317. To further estimate the robustness of these three predictors, the ROC curves of them are displayed in Figure 2. The AUC values of the predictors based on B-factor, RASA and their combination were 0.694, 0.683 and 0.797, respectively. This indicates again that complementary nature of the B-factor and RASA features contributes to the improvement of the prediction performance of our logistic regression classifier to identify discontinuous B-cell epitopes.
| Feature | Threshold | Recall (%) | Precision (%) | Accuracy (%) | MCC | AUC |
|---|---|---|---|---|---|---|
| B-factor | 0.11 | 55.6 | 18.6 | 71.8 | 0.195 | 0.694 |
| RASA | 0.07 | 84.8 | 11.4 | 46.9 | 0.154 | 0.683 |
| B-factor+RASA | 0.14 | 54.7 | 28.9 | 85.0 | 0.317 | 0.797 |
Table 2: The performance of fivefold cross-validation on Andersen et al.’s dataset.

Figure 2: The ROC curves of our three predictors tested on Andersen et al.’s dataset.
Independent testing on epitome database
Epitome is a database composed of 105 antigen-antibody complexes collected by Schlessinger et al. (2006) (http://cubic.bioc.columbia.edu/ services/Epitome/), including a total of 140 antigens. In this database, there are 62 antigens that are also included in the dataset of Haste Andersen et al. (2006). To further test our method, we used Haste Andersen et al.'s dataset to train our three predictors and predicted the discontinuous B-cell epitopes of all antigens and 78 unique antigens from Epitome database. Notably, Schlessinger et al. used 6Å as a distance cutoff to define the residues in antigens contacting with antibodies. In our study, we adopted Haste Andersen et al.'s definition to acquire the epitope residues of each antigen in Epitome database.
The prediction results of the independent testing on Epitome database are given in Table 3. It can be observed that the performance of the predictor based on combined features was much better than the performances of the predictors based on a single feature, not only for all antigens but also for unique antigens. The results were in agreement with those obtained by five-fold cross-validation on Haste Andersen et al.'s dataset. Interestingly, when we only used B-factor as the feature for prediction, the performance of independent testing was not as good as the performance achieved by the five-fold cross-validation. We then statistically analyzed the distribution of B-factors of epitope residues from the 78 unique antigens in Epitome database. As shown in Figure 3(a), although the average B-factors of epitope residues were significantly lower than those of nonepitope residues, they were obviously higher than the mean values of epitope residues from Haste Andersen et al.'s dataset. For this reason, the predictive power of B-factor was weakened in independent testing. On the other hand, the comparison of RASAs given in Figure 3(b) shows that there is no remarkable difference between the distribution of epitope residues from the unqiue antigens and that from Haste Andersen et al.'s dataset, which results in more stable performance as RASA was used alone. However, when B-factor was incorporated as an additional feature to RASA, the MCC value of unique antigens was raised from 0.146 to 0.238. This indicated that B-factor is helpful to improve the prediction performance of discontinuous B-cell epitopes. Additionally, Figure 4 illustrates the ROC curves of our three predictors tested on all antigens and unique antigens in Epitome database, which further suggests that the proposed predictor with B-factor and RASA features is effective and robust.
| Feature | Threshold | Recall (%) | Precision (%) | Accuracy (%) | MCC | AUC |
|---|---|---|---|---|---|---|
| B-factor | 0.11 | 43.4a (52.1)b |
9.2 (11.7) |
69.0 (69.3) |
0.075 (0.124) |
0.616 (0.659) |
| RASA | 0.07 | 84.4 (86.0) |
9.5 (10.3) |
47.6 (47.3) |
0.146 (0.156) |
0.707 (0.707) |
| B-factor+RASA | 0.14 | 44.9 (51.6) |
21.0 (24.3) |
85.7 (85.5) |
0.238 (0.284) |
0.752 (0.777) |
aThe performance of independent testing on unique antigens
bThe performance of independent testing on all antigens
Table 3: The performance of independent testing on Epitome database.

Figure 3: Characteristic comparison between the epitope and nonepitope residues from unique antigens in Epitome database and the epitope residues from Andersen et al.’s dataset. (a) B-factor; (b) RASA.

Figure 4: The ROC curves of our three predictors tested on Epitome database. Unique and all in parentheses denote that our predictors were tested on unique antigens and all antigens, respectively.
Visualization of the prediction results for an example
To further illustrate the effectiveness of our predictors, we chose a complex 1VFB (PDB ID) from the unique set of Epitome database as an example to visualize its prediction results. This antigen- antibody complex is composed of hen egg lysozyme (HEL) and the Fv fragment of monoclonal antibody D1.3 (Fv D1.3) (Bhat et al., 1994). Figure 5 shows that the logistic regression predictors based on a single feature can identify most of epitope residues in this complex, but results in many false positive predictions (especially when RASA is used as the feature alone). However, when B-factor and RASA were combined to identify the epitope residues, the number of true positives was kept and the number of false positives was reduced distinctly. The reduction of false positives by B-factor feature has been similarly observed in multiple other examples. Accordingly, we concluded that the substantial improvement of prediction performance of the predictor based on combined features was mainly due to the drastic reduction of false positive predictions. This capability is very useful to complement experimental techniques for detecting epitope residues.

Figure 5: Visualization of the prediction results for complex 1VFB (PDB ID). (a) B-factor; (b) RASA; (c) B-factor+RASA. The antigen was denoted using gray spheres, and the heavy and light chains of antibody were denoted using blue and green cartoons. The purple, cyan and yellow spheres of antigen denote true positives, false positives and false negatives, respectively. The figure was generated using PyMol (http://www.pymol.org).
Comparison with other methods
After reviewing existing methods, we found that DiscoTope (Haste Andersen et al., 2006) and BEpro (Sweredoski and Baldi, 2008) also used Haste Andersen et al.'s dataset to estimate their prediction performance. In their studies, the average AUC value for 75 antigens was used as the primary performance measure. Thus, we calculated the average AUC values of our logistic regression predictor with B-factor and RASA features and compared it with the results of two methods as reported by Sweredoski and Baldi (2008). The average AUC values of our method, DiscoTope and BEpro were 0.818, 0.726 and 0.754, respectively. In addition, when the average specificity value was set to 95%, the average sensitivity value of our method was 34.3%, which was remarkably higher than the average sensitivity values, 18.7% and 20.9% of DiscoTope and BEpro. Similarly, we compared the performances of our method, DiscoTope and BEpro tested on the unique chains of Epitome database. The average AUC values of these three methods were 76.1%, 71.7% and 73.6%, respectively. The average sensitivity values were 24.3%, 14.2% and 15.4% when we used 95% as the average specificity value. The better performance achieved by our approach may be ascribed to the following three aspects. First, complementary to RASA feature, B-factor helps to reduce the false positive rate in identification of discontinuous B-cell epitopes. Second, we used a structural window as input for each residue, which may reflect the spatial environment of the target residue more adequately. Third, the logistic regression model used here could be more suitable to handle the binary classification of discontinuous epitopes than the linear combination model used in DiscoTope and BEpro.
In this paper, we proposed a novel computational method for predicting discontinuous B-cell epitopes based on logistic regression model and two structural features B-factor and RASA. Cross-validation and independent testing showed that both B-factor and RASA can be used to identify discontinuous epitopes. Especially, the combination of these two features can significantly improve the prediction performance. Compared with other popular prediction methods, our approach showed better performance in terms of average AUC value and sensitivity. With the increase in structural data of antigen-antibody complexes, the proposed method will achieve further improvement in its prediction performance by incorporating more structural information.
This work was supported by the National Science Foundation (Grant BIODBI- 0845381). The software for our algorithm will be provided upon request.