Journal of Geography & Natural Disasters
Open Access
ISSN: 2167-0587
ISSN: 2167-0587
Research Article - (2022)Volume 12, Issue 3
A new gas reservoir includes the carbonates of Upper-Cretaceous Formation in the Zohr oilfield of eastern Mediterranean Sea in Egypt. The main aim of this study is to assess the new carbonate reservoir by thin section study and estimate hydraulic flow units HFUs by smart system. This carbonate formation is now considered the most important gas reservoir in northern Egypt. In this paper five microfacies were identified based on microscope petrographic analysis. The examined rocks were formed in lagoon, shoal and open marine depositional environments. The relationships between microfacies and flow units are further evaluated in this study. The determination of such relationships has proven to be challenging due to petrographic complications arising from diagenetic processes. The correlation behind pore space percentage and permeability is important to recognize hydraulic flow in the reservoir under consideration in this study. Flow Zone Indicator (FZI) approach was applied to estimate flow zones from borehole core data. To attain the goal of this work the Artificial Neural Network (ANN) technique was implemented to predict HFUs in un-cored wells. The entries parameters compensated neutron porosity (NPHI), sonic transient time (DT), Spectral Gamma Ray (SGR), and total porosity (PHIT), and formation density (RHOB) in the entry window, five cells in the obscure window and a cell as result window were used for ANN. The rock samples and logging information from wellbores Aa and Bb were used for ANN model construction.
After validating the obtained data from well (Cc) as a model input, it was executed with well (Dd) that just well logging data were available. Correlation of the results obtained from the ANN model with real data proved the reliability of the smart technique for inferring of HFUs in un-cored intervals across the field. Accordingly, the neural network technique creates the real relationship among hydraulic zones and the logging information in un-cored well.
Zohr oil field; Hydraulic zones; Flow zone indicator; Artificial neural network
HFUs: Hydraulic Flow Units; FZI: Flow Zone Indicator; ANN: Artificial Neural Network; NPHI: Compensated Neutron Porosity; DT: Sonic Transient Time; SGR: Spectral Gamma Ray; PHIT: Total Porosity; RHOB: Formation Density; BP-ANN: Back Propagation Artificial Neural Network; r35: Pore Throat Radius at 35% Mercury Saturation; k: Permeability; φ: Porosity; φe: Effective Porosity; τ: Tortuosity; r: The Radius of the Cylindrical Tubes; D: Diameter; φe: Effective Fraction Porosity; SGV: Grain Surface Area; Fsτ2: Kozeny Constant; RQI: Reservoir Performance; φz: Normalized Porosity
Evaluation of hydraulic flow units can be valuable for depiction of correlations among geological and petrophysical properties. Due to the effect of diagenesis, and facies variations in the carbonate reservoirs, heterogeneity properties are high there in such reservoirs. So, considering the hydraulic flow units clustering in the sedimentary sequence aids in the recognition of premising rock intervals [1]. The hydraulic flow unit concept was originally introduced for the purposes of interested zones characterization [2]. Gunter et al., presented the hydraulic unit “is a stratigraphically continuous interval of similar reservoir process speed that honors the geologic framework and maintains characteristics of rock types” [3]. Martin et al., introduced trial to slice the non-clastic reservoir into various hydraulic units, each with the same range of pore throat radius and same fluid flow ability [4]. Based on pore throat radius at 35% of nonwetting fluid saturation (r35), Martin recognized four hydraulic performances:
1. Mega-port flow unit, where r35 is higher than 10 μm
2. Macro-port flow unit where r35 varies between 2 and 10 μm
3. Mesport-flow unit with r35 various between 0.5 and 2 μm
4. Micro-port flow unit that has r35 less than 0.5 μm
Petro physical properties derived from Laboratory rock samples investigations are important to know hydraulic flow units [5]. Formations are sectioned into hydraulic zones according to their pore space and permeability model [1]. In some much heterogeneous zones, the relationship between core-derived and logging data-derived FZI is weak. This is mostly due to dissimilarity in minerals and fluid parameters, which cause reasonable relationship between logging data and suitable hydraulic zones to be masked [1,6]. Unfortunately core information is not always obtainable for all the desired targets. Different techniques have been declared to describe reservoir quality based on reservoir flow homogenous intervals [7,8]. Desouky predict permeability from cored interval and using the well data. The accuracy of predicting the permeability is not defined well due to the limited core data available and pore heterogeneity. He couldn’t obtain thrusted permeability results at all depths of well logging data. Nimisha use integration of 3Dseismic and well data to detect the hydraulic flow units in Balol formation. Characterization of permeability was detected based on expensive core data and is very hard to be thrusted due to the weak empirical relationship obtained between the well logging data and flow zones. So, it is clear from previous study that, permeability can’t be obtained accurately or all the depths of the wellbore. In this current research, Flow Zone Indicator (FZI) approach is used to slice the formation quality according to reservoir flow homogenous intervals. The artificial neural networks were widely used to estimate permeability and porosity by many authors [9,10], but was scarcely executed to recognize the homogeneous flow zones. Thanh and Jarot use the ANN for predicting the permeapility and HFU for the sandstone formation. They conclude the ability to predict the permeability profile by the ANN model using well logging data. However, they use only a limited number of well logging core data. Ghanim, introduce a similar study using 191 sandstone core samples to divide the formation to different rock type. Then predicting the permeability in uncored interval using the ANN but, no well log data is used in their analysis. Dahlia, predict the permeability of different rock type using Ann. In this research, the core samples used for conventional HFU is not distributed well and only one well data is used for the training present only three HFU. The reliable Levenberg– Marquardt train method is not used for approximation in this previous work. In my work, the Artificial Neural Network (ANN) technique based on Levenberg–Marquardt is used to determine flow units in uncord wells for the new carbonate reservoir in Zohr Egypt offshore oilfield, Mediterranean Sea. The artificial neural network model was designed in MATLAB software environment, in order to predict HFUs. Correlation between the results obtained by neural network approach and actual observed results from core and well log data proved that ANN method is appropriate to drive hydraulic units from logging information where core data is not available.
Geological setting
The Structure framework of the Eastern Mediterranean is super-imposed southward on the stable African margin and northward on the active Alpine margin. This situation is as old as Late Cretaceous when the ophiolitic melanges belt of Cyprus- Taurus was emplaced. The deep abyssal plains of the eastern Mediterranean are formed on top of a thick sedimentary section lying on a thin oceanic crust. The latter thickens gradually in the south direction with regard to the Africa plate. The different studies of 3D seismic geophysical data illustrate a highly rich sedimentary section incorporate the Mesozoic series. Our knowledge of the Cretaceous sediments of East Africa, Cyrenaica to Egypt, the cretaceous sediments increase in thickness to the north direction which may disclose a marginal environment. The late cretaceous folding is happening in all North African margins [11]. In Egypt oblique over thrusts are present in the south direction to the present margin studied [12]. These attributes importance is not understandable but happen due to Late Cretaceous continental collision. Vulnerability are mainly of Cenozoic layers, and subsurface information for older Mesozoic rocks coming from drilled wells, moreover, the visibility of the rock formation on the ground surface of different geologic ages are noted at distinct areas.
Hydrocarbon plays
In this section the play elements at regional scale will be summarized.
Source: The results obtained post-drill Zohr-1 well confirmed that the Tertiary source rock is present and effective. After these positive results the Nile Delta Deep Waters become part of the hydrocarbon province proved in the Levantine Basin by the discoveries of Leviathan, Tamar, Dalit and Aphrodite wells.
Reservoir
The reservoir section drilled in Zohr-1 and Zohr-2 is Cretaceous in age and is described as an isolated shallow water carbonate platform. Sediment logically, this section is preliminary described as made of rudist and bio-oolitic facies association grading to tidal flat onshore and slope re-sediment debris toward the slope.
Seal
The vertical and lateral seal is represented by the thick Messinian Evaporitic Complex of the Rosetta Formation, which caps and surrounds the entire gas bearing carbonate section underneath.
Trap
The trap is represented by a 4-way dip structure closure and the reservoir in Zohr-3 is expected to be found at 3567 m ssl (+/-80 m). The appraisal well is located down-dip in respect to Zohr-1 location (Top Carbonates found at 3430 m ssl).
Charge
Timing: Tertiary source rock is proved to be present and effective by Zohr-1 discovery. The biogenic gas expulsion occurred after the deposition of Rosetta Formation.
Migration: The Zohr structure location represents an optimal migration focus for the hydrocarbons generated from the two surrounding basins (Levantine and Herodotus).
The Upper Cretaceous new carbonates Formation, the focus of this study, are main gas reservoir rocks in Zohr oil field. The dominant constituents of the formation are limestone. The studied Zohr field and the four wells are in Egypt’s offshore Mediterranean, at 4,757 feet depth, about 195 km (N Egypt) (Figure 1). The new discovered carbonate Formation is considered the chief reservoir of oilfields located in the east Mediterranean Sea, North Egypt. The Carbonate Formation is Upper Cretaceous in age (Figure 2).

Figure 1: Location map of the Zohr oilfield in Mediterranean offshore, North Egypt (Society of petroleum engineer). Note: ( ) Eni operator; (
 ) eni not operator; (
 ) Gasfield; (
 ) Pipeline.

Figure 2: Lithologic column shows carbonate reservoir is upper cretaceous in age.
Data available and procedures
The present study is built on core sample and well-log information from four offshore wells in the Zohr hydrocarbon field (wells Aa, Bb, Cc and Dd).
The applied techniques used in this work comprise
1. Petrographic study of thin sections
2. Well log and core data preparation
3. Identification of hydraulic flow units
4. Estimation of hydraulic flow using ANN
The petrographic study of thin sections
A total of 65 thin sections were obtainable from two wells studied (A and B). Petrographic analysis of thin sections was used to estimate the microfacies and deposition setting of the Zohr carbonate reservoir. Petrographical analysis and sedimentological characteristics were used to the description of microfacies and as a foundation for the interpretation of depositional environments. A modified Dunham, Embry and Klovan classifications techniques were used to assort microfacies [13]. Depositional environments evaluation carried out by using components of facies. The quantitative analysis including grain types and size, grain frequency and fossil content were used as main attributes to define microfacies [14]. The microfacies identified in wells (Aa and Bb) are described below.
Microfacies 1 (MF22): Oncoid floatstone and wackestone
This facies is mostly constituted of abundant amount of micritic matrix (with >50% in frequency). This microfacies also contains planktonic foraminifera (with 7% in frequency), ostracods are locally observed (2%-4%). It also includes pore filling detrital clay matrix. Rare amounts of non-ferroan calcite crystals (C), pour filling secondary silica and black pyrite crystals (Yellow Arrow) are detected. Furthermore, this facies formed in energy restricted /marine shelf lagoon environments, as reflected by small various skeletal fauna, lack of subaerial exposure and the stratigraphic position, where great variations in salt percentage and temperature could happen. The mean of porosity (orange arrow) and permeability in this microfacies are 4.93% and 0.97 mD, respectively (Figure 3a).

Figure 3: The main statistical parameters of studied microfacies. (a) MF22: Oncoid floatstone and wackestone. (b) MF23: Coastal lagoon Microsparite. (c) MF2: Microbioclastic peloidal calcisiltite. (d) MF4: Planktic foraminifera wackestone/ packstone. (e) MF3: Pelagic lime mudstone and wackestones. Blue parts indicate porosity.
Microfacies 2 (MF23): Non-laminated homogenous micrite or microsparite (Crystalline calcite)
Crystalline calcite is the main component in this microfacies (with >50% in frequency). Also rare amounts of pore filling secondary silica (S) and pyrite (Yellow Arrow) (<6%), are observed. It include detrital clays matrix concentrated along laminae (<5%). Common amounts of intercrystalline, fracture, vuggy and moldic pore types, with moderate to good interconnectivity. In this facies mean of pore space percentage and permeability are 25.72% and 1.18 mD, respectively (Figure 3b).
Microfacies 3 (MF2): Microbioclastic peloidal calcisiltite
The skeletal planktic foraminifera are very common (<30%), as well as traces of ostracods are locally observed (<5%). This microfacies contain rare amount of non-skeletal quartz grains (<5%). As well as, Dominant amounts of micrite (microcrystalline calcite) matrix (Mi) (<50%) as well as, Minor amounts of pore filling detrital clays matrix (<10%).
Other components which are present rarely include non-ferroan calcite and black pyrite crystals (Yellow Arrows) cement as well as micrite was found in matrix. The pore systems include common amounts of primary and secondary intragranular (within foram chambers) porosity, as well as, fracture porosity, with moderate pore interconnectivity. The mean of porosity and permeability are respectively 20.8% and 1.27 mD in this microfacies (Figure 3c).
Microfacies 4 (MF4): Planktic foraminifer’s dolowackestone/ packstone
In this facies, the skeletal grains is planktonic foraminfera with the highest frequency (<30%) as well as ostracods are locally observed (<5%) throughout a micritic matrix. It also contains rare amount of quartz grains (<5%). The mean pore space percentage and permeability of this microfacies are 14.64% and 4.83 mD, respectively (Figure 3d).
The Common amounts of non-ferroan dolomite rhombs (D) due to dolomitization process of limestone, in addition to rare amounts of non-ferroan calcite, ferroan calcite, secondary silica and black pyrite crystals (Yellow Arrows) are observed. The pore system includes primary and secondary intragranular (within foram chambers) porosity, as well as, fracture pore type, with moderate pore interconnectivity. The mean pore space percentage and permeability of this microfacies are 25.64% and 4.83 m D, respectively in Figure 3e.
Microfacies 5 (MF3): Pelagic lime mudstone and wackestones
The common components of this rock are planktonic foraminifera such as textularia and globigerina are abundant in this facies (25%). Other constituents of this facies include benthic foraminifera, ostracods (Blue Arrow) (9%), bryozoan (7%), and echinoderm (6%). Also, Rare amounts of detrital quartz grains are locally noticed (<10%). The micritization process was found in the facies. The mean pore space percentage and permeability of this facies are 5.85% and 1.59 MD, respectively.
Rare amounts of non-ferroan calcite, non-ferroan dolomite and pyrite crystals (Yellow Arrows), in addition to Traces of secondary silica are locally noticed.
Common amounts of primary and secondary intragranular (within foram chambers) porosity, with moderate to good pore interconnectivity are observed (Orange Arrows). The mean pore space percentage and permeability of this facies are 20.57% and 1.59 MD, respectively.
Petrophysical data available
The measured petrophysical parameters from cores such as porosity and permeability using laboratory applying steps that are shown by authors in different previous studies (Abuseda; Amir and Nahla), associated with logging measurements (sonic, formation density, compensated neutron, total porosity and the spectral gamma ray information) from four wellbore (Aa through Dd) in the Zohr hydrocarbon field were collected for this research. The available well-logs data introduce a good relationship with FZI (Figures 4a-4e). Measurements from the wellbores Aa, Bb and Cc included both cylindrical core samples and logging data. While the fourth wellbore (Dd), provided logging data only. Logging and core samples information from wellbores Aa and Bb applied to construct the artificial neural network model (579 data points); data from wellbore Cc was used to test the model (150 samples) and readings from wellbore Dd were applied for propagation the created model. For calibration of logging measurements versus core sample information, the depth matching was carried out. For better acting of the neural network, all data were normalized between -1 and 1 [13,14].

Figure 4: Cross-plots showing the relationship between FZI and well-log data. (a) DT (b) PHIT (c) RHOB (d) NPHI (e) SGR.
Hydraulic flow units approach (HFUs)
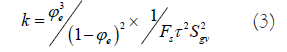
Effective porosity is considered as the main factor affecting on the ease of fluid flow in the subsurface reservoir and we can divide it into different units (HFU) of specific fluid moving properties Amaefule [15]. The HFU method is applied for definition of rock kind and estimation of permeability, according to realistic geological factors and the nature of fluid movement at the micro porosity size [16]. The Flow Zone Indicator (FZI) method was used for estimation of current hydraulic zones in this research. Most important properties that impact permeability are porethroat volume (Amir and Nahla). The pore space and throat are connected to geological circumstances such as mineralogy, cement and texture in each sedimentary facies. So, each HFU can represent many sedimentary facies but with similar pore geometry conditions. Classifying the flow unit, we assume that in the flow unit, communication of pores can be showed as a series of capillary tubes [7]. For the model contain straight cylindrical tube, Darcy’s equation and Poiseuille’s equation lead to the resulting model [17].


Where (k) is permeability, (φ) porosity, effective porosity, τ tortuosity and (r) is the radius of the cylindrical tubes, that present in the rock and (D) is its diameter.
Kozeny-Carmen [18], for a real porous medium, introduce two parameters the tortuosity and the surface area to express permeability:

Where k unit μm2, defined as effective fraction porosity, Sgv2 is grain surface area, and Fsτ2 is known as Kozeny constant.
Amaefule [15] illustrate the permeability using the effective porosity:
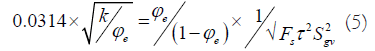
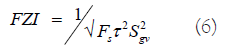
Reveal flow zone indicator parameter as follows:
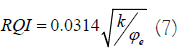
The equation of the parameter represents the reservoir performance (RQI) as (Hasan Nooruddin):
The normalized porosity (φz) is expressed as follow:
The FZI can be computed based on the following equation:

Or
logRQI = logÏ? + logFZI (10)
On a logarithmic chart of RQI against Øz, all zones with same FZI values located on a linear of element slope [15,19]. Various methods are introduced for determining flow units based on FZI. A Normal probability plot of flow zone indicator logarithm was used for defining flow units in this study (Figure 5). The normal probability plot of log FZI data in wells Aa, Bb and Cc illustrate six flow units for the new Carbonate reservoir in Zohr oilfield.
Recognizing the flow units using Artificial Neural Networks (ANN)
The principle object of my research is hydraulic zones prediction using ANN. To achieve this goal, a back propagation artificial neural network (BP-ANN) is used in the current research. ANN is an applied approach which imitates the human brain. BP-ANN is well known in function estimate has many advantages. A BPANN is a popular training method that enters input parameters directly to the network and then calculates the discrepancy between the calculated output and the needed output from the training information (Zehui) and [1]. BP-ANN is fast, easy and not complicated nonlinear function approximation. We can control the accuracy of the weight estimation through going back from the output to hidden decreasing errors to enhance the model reliability. The general architecture of artificial neural networks is composed of entry, concealed and resulted layers of neurons. The concealed or hidden layers can find the spatial correlations between the input and output units. Among the data set from wellbores Aa and Bb, 70% of data was chosen for building the model, 15% of measurement information for testing the acquired model and 15% measurement information for validation. The five well-logs data including NPHI, DT, SGR, PHIT and RHOB were selected as inputs for ANN model.
The conversion relation from entry layer toward concealed layer is hyperbolic tangent sigmoid (tansig) and from concealed layer to exist (resulted) layer is linear (purelin).
In this approach, each hydraulic flow unit is distinguished from the other hydraulic flow unit by a change in slope line (Figure 5). The relationship among porosity and permeability for varies homogenous fluid flow zones (Figure 6). In order to recognize hydraulic flow units which have better reservoir quality, the mean value of permeability, porosity and hydraulic FZI were estimated for each HFU (Table 1). Then the frequencies of hydraulic flow unit’s occurrence were computed in each microfacies (Figure 7). The relationship between microfacies and flow units for well Aa is illustrated in Figures 8a-8h.

Figure 5: The normal probability plot of log FZI from data wells A, B and C of limestone reservoir. Every HFU changes with a break in slope.

Figure 6: Plot of permeability versus porosity for HFU in limestone reservoir, Zohr oilfield. Note: ( ) HFU1; (
 ) HFU1; (
 ) HFU1; (
 ) HFU1; (
 ) HFU1; (
 ) HFU1.
| DHFU | Log FZI | Mean Permeability (mD) | Mean Porosity (%) | Mean (FZI) |
|---|---|---|---|---|
| HFU1 | Log FZI ≥ 1 .489 | 1.92 | 0.69 | 96.52 |
| HFU2 | 1.489 ≤ Log FZI ≥ 0.791 | 4.55 | 3.53 | 11.98 |
| HFU3 | 0.791 ≤ Log FZI ≥ 0.59 | 22.38 | 6.66 | 5.5 |
| HFU4 | 0.59 ≤ Log FZI ≥ -0.081 | 15.87 | 11.24 | 2.121 |
| HFU5 | -0.081 ≤ Log FZI ≥ -0.743 | 2.5 | 14.32 | 0.632 |
| HFU6 | -0.743 ≤ Log FZI | 0.07 | 14.52 | 0.041 |

Figure 7: Frequency of each HFU in microfacies of limestone reservoir, Zohr oil field well 4. Note: ( ) MF3; (
 ) MF4; (
 ) MF 2; (
 ) MF 23; (
 ) MF 22.

Figure 8: Stratigraphic section for part of the new limestone reservoir together with well logs, microfacies and HFUs from core, well A (a) SGR (b) Porosity (c) Preamibility (d) NPHI (e) DT (f) FZI (g) HFU (h) Microfacies. Note: ( ) MF 22; (
 ) MF 3; (
 ) MF 4; (
 ) MF 2; (
 ) MF 23; (
 ) Uncored.
Density plot showing the distribution of well log data within each HFU are shown in Figures 9a-9e. The Schematic geometric shape of the neural model for the current work is represented in Figure 10. For better performance, where generalization stops progressing, as indicated by increase in the MSE, was acquired after 9 epoch of training. This network is constructed and based on Levenberg-Marquardet training algorithm (LM). The default mean squared error (MSE) function was used to calculate the error during the training and testing. The Mean Squared Error (MSE) is defining discrepancy among outputs and goals (Figure 11).

Figure 9: Density function for well-logs data in HFUs. (a) DT, (b) NPHI, (c) PHIT, (d) RHOB and (e) SGR.

Figure 10: The Schematic architecture of the neural network in present study.

Figure 11: Mean square error versus number of iterations performed in the stage of train, test and validation. Note: ( ) Test; (
 ) Validation; (
 ) Train.
There MSE function performance was 0.02. After establishing the optimal model, it was evaluated by using well log data from well Cc as input data and then FZIs data was calculated. The acceptable agreement between predicted and measured FZI with the correlation coefficient of 0.92 shows in Figures 12 and 13a-13g.

Figure 12: Correlation between core derived FZI and ANN predicted FZI at the test (well C). Note: ( ) Predicted; (
 ) Measured.

Figure 13: Correlation of HFUs resulting from core and ANN along to core derived and predicted FZI. Tracks (a) and (b) Show FZI obtained from core and ANN, track (c) Shows the log FZI from core, porosity and permeability (tracks c and e), HFU obtained from (f) the core and (g) the ANN. Note: ( ) HFU2; (
 ) HFU3; (
 ) HFU4; (
 ) HFU5; (
 ) HFU6.
Illustrates the correlation of FZI conducted by ANN with rock samples-calculated FZI for test well (well Cc), as core-derived FZI and FZI predicted using ANN shown in tracks (a) and (b), respectively in Figure 14.

Figure 14: Cross-plot showing correlation coefficient between core derived FZI and ANN predicted FZI for the well C. Note: ( ) Y - T; (
 ) Ft; (
 ) Data.
Illustrates the application of the new ANN model in well Dd which has only well-logs data. The resulted HFUs by ANN are shown in track in Figures 15a-15f.

Figure 15: The well selected for propagation of ANN model. Tracks (a) to (e) illustrate the well log data for well D (DT, NPHI, RHOB, PHIT and SGR). Track (f) represent the ANN calculated HFUs. Note: ( ) HFU2; (
 ) HFU3; (
 ) HFU4; (
 ) HFU5; (
 ) HFU6.
Several factors must be considered in understanding the relationship among facies and lithologic type in non-clastic rock (Susan MA. and Sebastian G). Considering that the diameter of the pores in the rock is dependent on texture and grain size. The FZI method could be useful in recognizing the rock type, as it is directly related to the pore size. Based on this technique, six flow units were distinguished. Average porosity and permeability in each HFU can be used to classify the HFUs into high and low reservoir quality fluid flow units. The average permeability for HFUs illustrated in Table 1, HFU3 has the highest reservoir quality, while HFU6 shows low reservoir quality in the recently discovered carbonate reservoir.
Most of all the microfacies associated with high-energy environments had an acceptable relationship with high reservoir quality flow units. But occasionally the occurrence of fractures during the diagenetic process high reservoir quality microfacies in weak-energy medium (for example lagoon). Therefore, the reservoir quality of carbonate facies is strongly affected by diagenetic processes. The core-derived HFUs and microfacies at the well (Aa) are demonstrated in tracks (g) and (h) of Figure 8.
To obtain the optimum value of concealed neurons through this study, a neural was examined with the different value of neurons in the concealed interval in the training and testing phase. Finally, a network with five neurons present in hidden layer was found to have the best generalization performance (Figure 10). So, an optimal ANN model with five neurons in the hidden layer and one neuron in the output layer was established based on the value of mean squares errors via iterations and regression coefficient [20-23].
The precise correlation of FZI conducted by ANN with rock samples-calculated FZI for test well (well Cc), as core-derived FZI and FZI predicted using ANN shown in tracks (a) and (b), respectively (Figure 13). This emphasizes the good regression constant among rock samples-calculated and conducted FZI detected in Figure 14. This clearly indicates that the ANN approach proves successful for FZI prediction in recently discovered carbonate reservoir. For integral work, the ANN model was propagated in well Dd which has only well-logs data (Figure 15). The present research represents a legitimate relationship between predicted HFU from our applied ANN technique and HFU conventionally calculated from the core and well logging data. So, we could apply the current ANN approach successfully to determine flow units across the field where most wells have only well log data available and core data are absent. Our method is better than other conventional methods done in the previous research that completely depend only on the presence of core data to predict the HFUs in the reservoir. Future study will be done to apply our model to other new geological basins of different lithology and environment of deposition [24,25].
In the present study, we have focused on prediction of flow units of the new carbonate formation in Zohr oilfield by intelligent network system. Microfacies analysis has led to the identification of five sedimentary facies. These microfacies have been deposited in lagoon, shoal and open marine environments. So, it was obvious that flow units controlled by rock property such as textural characteristics and diagenetic feature occurred in this reservoir. Therefore, the petrophysical well-logs which had legitimate and strong relationships with FZI data were chosen for prediction of FZI data using our ANN technique. Also, this research illustrated that each microfacies within the reservoir could have several flow units. Because the flow units are dependent on the porosity and permeability, hence the diagenetic processes result in different types of the flow units in sedimentary facies. The output of this work claims that the ANN procedure is useful for prediction of hydraulic flow zones in the recently discovered carbonate reservoir. The ANN approximation was used as a beneficial technique for prediction of HFUs from petrophysical data in uncored but logged wells throughout the oil field.
The researcher appreciates Eni Oil Company for information support and license to publish the output of that paper. The data for this paper are available by contacting the corresponding author at amir77_lala@yahoo.com.
[Crossref] [Google scholar].
[Crossref] [Google scholar].
[Crossref] [Google scholar].
[Crossref] [Google scholar].
[Crossref] [Google scholar].
[Crossref] [Google scholar].
[Crossref] [Google scholar].
[Crossref] [Google scholar].
[Crossref] [Google scholar].
[Crossref] [Google scholar].
[Crossref] [Google scholar].
[Crossref] [Google scholar].
[Crossref] [Google scholar].
[Crossref] [Google scholar].
[Crossref] [Google scholar].
[Crossref] [Google scholar].
[Crossref] [Google scholar].
[Crossref] [Google scholar].
[Crossref] [Google scholar].
[Crossref] [Google scholar].
Citation: Lala AMS (2022) Prediction of Hydraulic Flow in the New Zohr Carbonate Reservoir: Eastern Mediterranean using Artificial Neural Networks. J Geogr Nat Disasters. 12: 249.
Received: 03-Aug-2022, Manuscript No. JGND-22-18681; Editor assigned: 08-Aug-2022, Pre QC No. JGND-22-18681 (PQ); Reviewed: 24-Aug-2022, QC No. JGND-22-18681; Revised: 01-Sep-2022, Manuscript No. JGND-22-18681 (R); Published: 08-Sep-2022 , DOI: 10.35841/2167-0587.22.12.249
Copyright: © 2022 Lala AMS. This is an open-access article distributed under the terms of the Creative Commons Attribution License, which permits unrestricted use, distribution, and reproduction in any medium, provided the original author and source are credited.