Journal of Pollution Effects & Control
Open Access
ISSN: 2375-4397
ISSN: 2375-4397
Research Article - (2022)Volume 10, Issue 4
A pre-operational validation of the System for Integrated Modeling of Atmospheric Composition (SILAM) model for Indian application has been presented in this paper. The model configuration has been adjusted according to the atmospheric and emissive conditions of India. India is one of the most desired regions for Air Quality (AQ) research around the globe. The region is composed of different atmospheric and man-made pollution activities. The weather system of India is favorable for the deposition of particulate pollutants in the Indo-Gangetic plains; the northern part of the country. Stubble burning and lower planetary boundary layer height are significant factors that deteriorate the AQ of Delhi-NCR in post-monsoon and winter seasons. India Meteorological Department (IMD) is continuously monitoring the AQ of Delhi-NCR along with central pollution control board and state pollution control committees with stationary ambient air quality monitoring stations. This joint effort of all the agencies relies upon Graded Response Action Plan (GRAP); an initiative by the Government of India (GOI) for pollution control in the Delhi-NCR region. An accurate AQ forecasting system is needed for GOI to implement a decision support system in order to make citizens aware of their surroundings for outdoor activities. We have successfully deployed Indian application of SILAM model in collaboration with Finnish Meteorological Institute (FMI) in Environment Monitoring and Research Center, IMD. One month observations of coarse and fine mode particulate matter (PM 10 and PM 2.5) over Delhi have been compared with SILAM forecast f or December 2020. The modeled and observed values are reasonably correlated in general and model has successfully captured the pollution events throughout the time period. It is found that PM 10 forecasts over Delhi are fairly overestimated and PM 2.5 forecasts are slightly overestimated with a positive correlation of 0.7. Further research in surface emissions and extreme pollution events is needed to make the predictions more accurate.
Particulate matter; Air quality modeling; Air quality management; Pollution; Topography
Air quality is closely connected to a complex interaction of factors associated with anthropogenic emissions, atmospheric circulations and topography; also; most of the urban pollution present particulate pollutants and trace gases toxic to human health and responsible for damaged climate system. As large parts of northern India suffer under thick air pollution during post-monsoon and winter season, the GOI is continuously making efforts to establish a Decision Support System (DSS) for AQ management. The motive of this study is to implement an accurate AQ forecasting system that can provide inputs to DSS during extreme air pollution events. SILAM AQ forecasting system has been configured and designed for India in collaboration between IMD and FMI. An extensive set of experiments have been performed with different model settings to forecast the AQ including criteria pollutants and several other Volatile Organic Compounds (VOCs) over India. The model input datasets have been taken from Indian application of Weather Research and Forecasting (WRF) model at 3KMs spatial resolution as meteorological data and a dense network of 300+ stationary AAQMS across the country as AQ observations. For the present work, a numerical simulation of pollution events over mega city Delhi has been simulated using SILAM model at a spatial resolution of 5-kms. The modeled results implied that the model is very sensitive towards the initial boundary conditions, grid spacing, and emissions. The results are validated against available in-situ observations for particulate pollutant concentrations. The model forecasts with horizontal grid resolution fit well with the hourly measurements of AQMS and these experiments tend to over predict the peak level of about 150-200 μg/m3 . This analysis has been performed using grid points averaged concentrations of AQMS network across Delhi-NCR. Nearest neighbor algorithm has been used to retrieve grid point concentration of PM 10 and PM 2.5 similar to grid point observations from AQMS. SILAM 5-km simulation shows increased PM concentrations with a peak value of about 700 μg/m3 against an observed value of 640 μg/ m3. On the other hand predicted maximum value of PM 2.5 concentration was 580 μg/m3 as compared to that of measured value 430 μg/m3 during an increased pollution event. Another exercise of curve fitting has been performed in order to fit the predictions over observations using univariate linear regression analysis that showed much improved results that are described under results section. This exercise can be used in tuning the model for more accurate results [1-6].
Indian setup
SILAM model for India is configured to generate 72-hours hourly AQ forecast of criteria air pollutants at a spatial resolution of 5 KMs. The model is configured to use WRF modeled meteorological data at 3 KMs spatial resolution as meteorological inputs. WRF model is operated by Numerical Weather Prediction (NWP) division of IMD. NWP generates meteorological forecasts at 00, 06, 12 and 18 UTC; among those; previous day’s WRF forecast at 12 UTC is used as meteorological input to SILAM model initialization. SILAM initialization is composed of three basic elements: (a) SILAM global run, (b) SILAM previous day’s run for India and (c) meteorological parameters for SILAM boundary conditions. SILAM global run is performed at FMI which uses hourly forecasts of European Centre for Medium-Range Weather Forecasts (ECMWF) as meteorological inputs. The model output is in network common database file (netCDF) format and png files as static concentrations maps for modeled species. City wise forecasts are calculated in post-processing python scripts using grid area averaged concentration for Delhi-NCR and station-wise concentration for Kanpur, Lucknow and Varanasi; three major cities with moderate pollution activities in IGP region.
Emissions
The AQ and fire smoke in SILAM are computed using eulerian dispersion kernel, corresponding source terms and physio- chemical transformation modules. Emission information is equipped with concentration and deposition information of corresponding pollutant. Global emissions from the Copernicus Atmosphere Monitoring Service (CAMS) CB5v2 for Indian region are utilized for Indian application of SILAM. Sectoral emissions viz public power, industries, road transport, shipping, off road dust, agricultural waste and other stationary combustions are defined in corresponding categorical source term file for Indian application. The source term file has the information to source name, latitude, longitude, plume rise, release rate, release time definition if the source is activated for a certain time period.
The released composite entity is defined in the terms of hour in a day, day in a week, week-day relative intensity or month in a year. This information is highly required for Indian emissions and weather system as the IGP region is significantly affected by pollution events twice a year in the post-monsoon and winter season. TNO-MACC data set and IS4FIRES are supporting modules that provide information on anthropogenic emissions and wild-land fires along with embedded emission computations for sea salt, wind-blown dust, and natural VOCs [7,8].
Aerosols
SILAM is capable to process up to 496 different nuclides including primary and secondary aerosols. It is also able to calculate radioactive decays and transformations of chemical compounds; chemically active aerosols and gases. Primary aerosols are emitted directly from the source itself whereas secondary aerosols are formed by chemical and physical processes involving gaseous precursors. Secondary aerosols can be divided into two types: Secondary Organic Aerosols (SOAs) and Secondary Inorganic Aerosols (SIAs) [8-10]. Gaseous precursors for SOAs are VOCs, like isoprene and correspond to a mixture of many organic gases mainly composed of carbon, hydrogen and oxygen. Precursors of SIAs are the gaseous elements like ammonia, nitric acid and sulfuric acid. The modeling system is efficient to compute aerosol’s wet/dry deposition, gravitational settling and diffusion. Particulate aerosols in SILAM are described separately as PM 10 and PM 2.5 species. Both of the categories have a no. of chemical compounds that form corresponding PM. Standard mixture of pollutants is named as cocktail in SILAM. Each cocktail has associated description file that contains the information of almost every possible mixture of aerosols and gases along with their mass fraction in corresponding cocktail. The modifications and model architecture in SILAM application for India are described graphically as below in Figure 1.
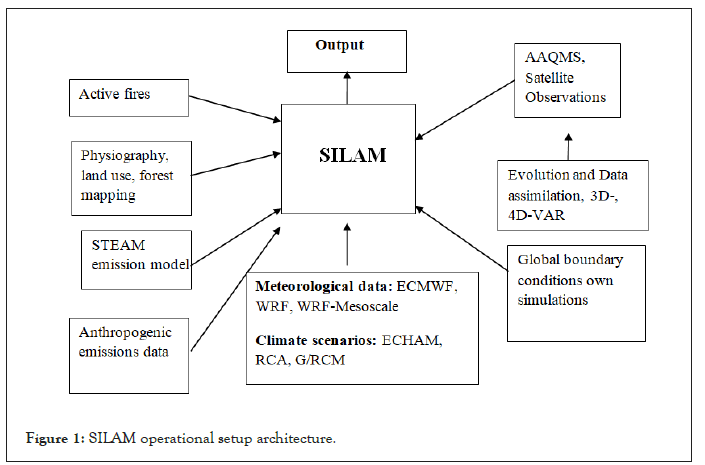
Figure 1: SILAM operational setup architecture.
SILAM output
SILAM outputs have been configured to provide two types of forecasts, i.e. spatial map and station-wise time series. The spatial forecast is a 5 KM × 5 KM hourly forecast over Indian sub- continent. The forecast parameters are all the criteria pollutants (PM 10, PM 2.5, CO, NO2, SO2 and O3) and few other parameters like dust, H2O2, HCHO, HNO3, H2O, HONO and NH3. Station wise time series is an interactive time series plot with information of 72Hrs forecast of each pollutant along with hourly AQ categorical index and 24 hours moving average of each pollutant. Output products are provided below in Figures 2a and 2b.
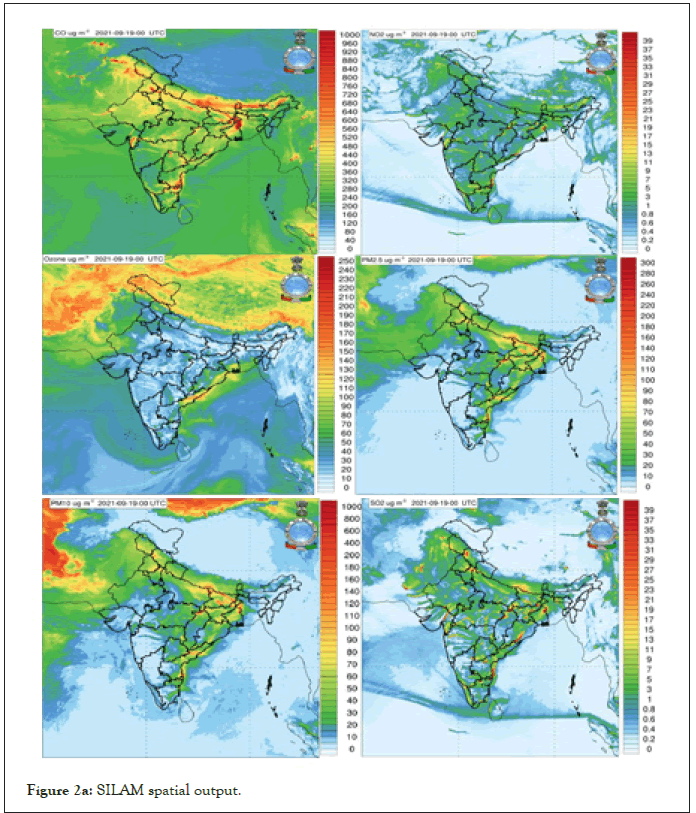
Figure 2a: SILAM spatial output.
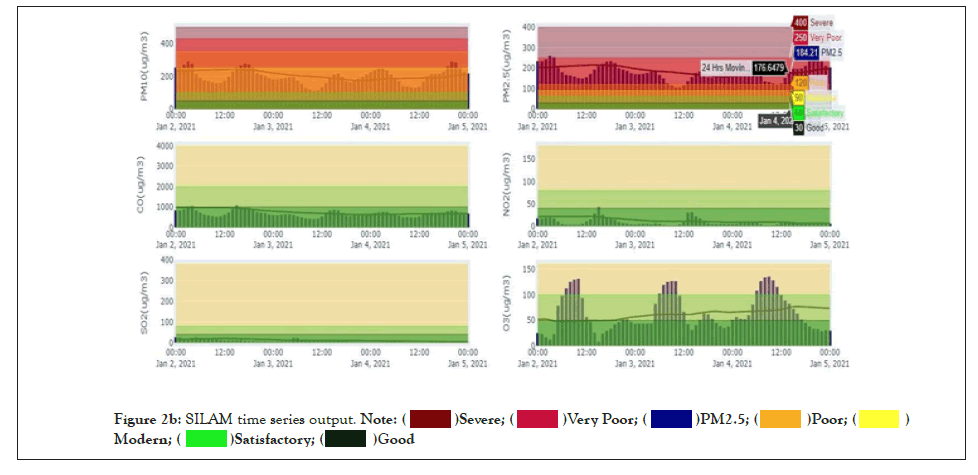
Figure 2b: SILAM time series output. 

Validation and statistical analysis of results for December 2020 have demonstrated a good agreement with observed values from stationary AAQMSs. Pair wise comparisons between PM modeled and observed values pair all together has evidenced a positive correlation which implies a valid PM trend in December 2020. However the model has fairly overestimated the PM concentrations but the results are acceptable as an initial phase. Diurnal variation of PM modeled and observed values during December 2020 are provided below in Table 1 and Figure 3.
| Hour | SILAM_PM10 | PM10_Observed | SILAM_PM2_5 | PM2_5_Observed |
|---|---|---|---|---|
| 0 | 297.6617 | 403.4142 | 212.637 | 252.2526 |
| 1 | 281.0464 | 436.0531 | 203.9226 | 254.9285 |
| 2 | 276.5521 | 468.6942 | 205.6286 | 251.7946 |
| 3 | 272.4314 | 475.1414 | 204.1843 | 240.3895 |
| 4 | 261.3009 | 440.8186 | 202.1041 | 241.6755 |
| 5 | 257.699 | 409.5492 | 206.2753 | 239.5954 |
| 6 | 266.7101 | 398.3519 | 209.676 | 234.2157 |
| 7 | 312.554 | 397.78 | 238.8326 | 234.9745 |
| 8 | 314.3835 | 374.0041 | 241.1873 | 245.6821 |
| 9 | 282.1499 | 373.1155 | 232.4795 | 260.0557 |
| 10 | 243.1388 | 351.9076 | 197.3329 | 247.1127 |
| 11 | 211.4612 | 348.9015 | 168.5067 | 233.8121 |
| 12 | 186.9875 | 353.7457 | 139.968 | 197.0683 |
| 13 | 161.4892 | 368.2803 | 125.3835 | 178.9067 |
| 14 | 139.7646 | 384.3631 | 114.3559 | 156.1497 |
| 15 | 125.2707 | 372.9344 | 102.4852 | 137.1606 |
| 16 | 123.8513 | 372.1216 | 97.3692 | 129.0553 |
| 17 | 142.4779 | 338.5226 | 107.239 | 139.7617 |
| 18 | 179.5197 | 291.3622 | 129.9326 | 162.2186 |
| 19 | 224.2192 | 272.4237 | 164.0881 | 207.2969 |
| 20 | 271.7711 | 256.9312 | 193.956 | 249.1171 |
| 21 | 295.8579 | 265.6943 | 214.1268 | 267.2541 |
| 22 | 319.5574 | 267.3263 | 227.4039 | 274.0133 |
| 23 | 303.8516 | 331.3929 | 218.7307 | 271.0087 |
Table 1: Diurnal variation of modelled and observed PM.
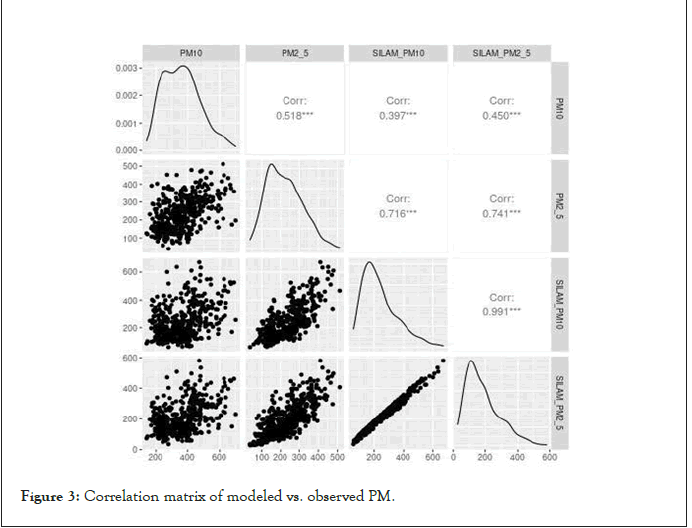
Figure 3: Correlation matrix of modeled vs. observed PM.
PM 10 statistics between 410 pairs of observations and modeled values has shown a positive Carl Pearson’s correlation coefficient of 0.4. PM10 predictions are slightly over and under estimated at different time stamps but this difference has been observed due to sudden increased pollution events evidenced by ground based observations. Wind pattern and transport of coarse particulates from the outer boundaries of Delhi are responsible factors that contribute in these sudden raised pollutants concentrations. PM 2.5 statistics between 407 pairs of modeled and observed values has shown a strong positive correlation of 0.74 with 90% confidence interval of 0.70 and 0.78. Paired samples t-test of 408 and 405 modeled and observed PM Pairs has validated the hypothesis between dependent SILAM PM and independent observed PM variables. Test statistics between measured and modeled PM are described below in Figures 4a and 4b. Analysis of variance (ANOVA) has also been performed to assess the variation within different order of fits in between SILAM predictions and observations. We have experimented 1st, 2nd, 3rd and 4th order polynomial fits against the observations using univariate regression analysis and the results have proven the best fits for both of the PM 10 and PM 2.5 with a positive correlation of more than 0.9. Curve fitting statistics are tabulated below in Table 2. Taylor diagrams for differently ordered fits are represented below in Figures 5 and 6.
| PM 10 | PM 2.5 | ||||||||
|---|---|---|---|---|---|---|---|---|---|
| Order | Adjusted R2 | F-Statistic | P-value | Pr(>|t|) | Order | Adjusted R2 | F-Statistic | P-value | Pr(>|t|) |
| 1st | 0.1554 | 84.17 | <2.2e-16 | 4.13e-8 | 1st | 0.5484 | 754.2 | <2.2e-16 | <2e-16 |
| 2nd | 0.1741 | 48.63 | <2.2e-16 | 0.0008 | 2nd | 0.5604 | 395.6 | <2.2e-16 | 0.028 |
| 3rd | 0.1838 | 34.94 | <2.2e-16 | 0.0041 | 3rd | 0.5597 | 263.3 | <2.2e-16 | 0.39 |
| 4th | 0.1821 | 26.16 | <2.2e-16 | 0.174 | 4th | 0.5506 | 136.7 | <2.2e-16 | 0.004 |
Table 2: Statistics of 1st, 2nd, 3rd and 4th order polynomial fits between modelled and observed values.
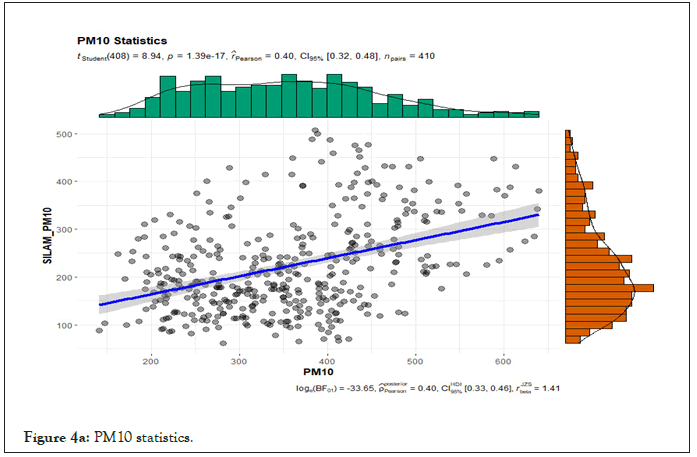
Figure 4a: PM10 statistics.
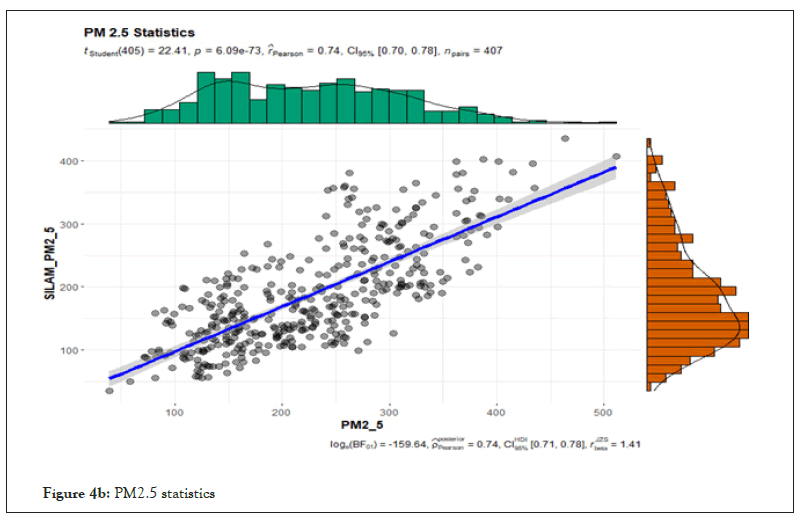
Figure 4b: PM2.5 statistics
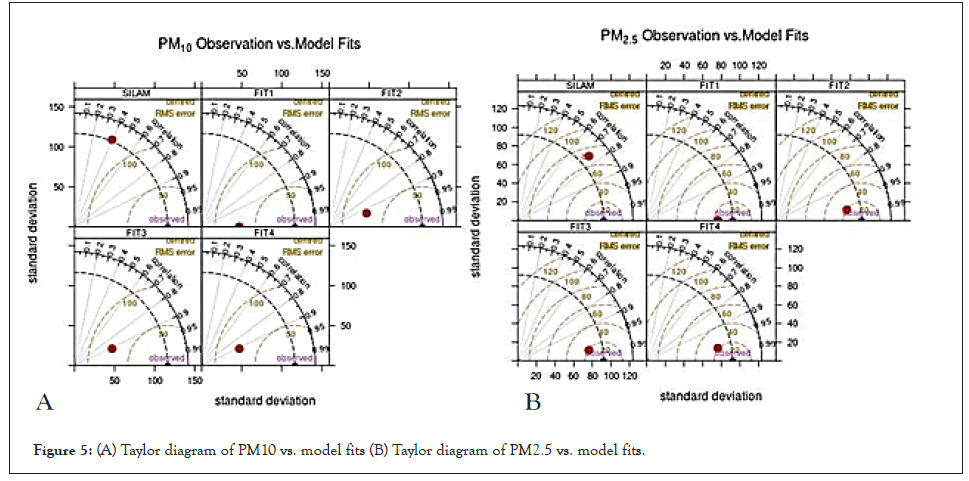
Figure 5: (A) Taylor diagram of PM10 vs. model fits (B) Taylor diagram of PM2.5 vs. model fits.
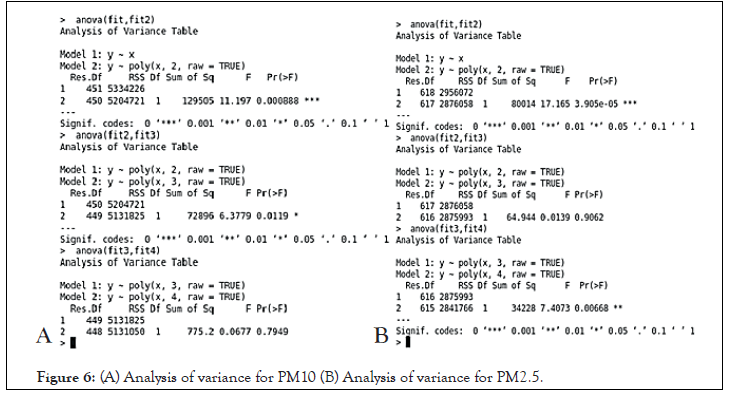
Figure 6: (A) Analysis of variance for PM10 (B) Analysis of variance for PM2.5.
Taylor diagrams and ANOVA tables clearly indicate that PM 10’s best fit has been observed at the 2nd order polynomial fit where the probability of rejection of hypothesis is 0.0008. On the other hand; 4th order polynomial fit is the best fit for PM 2.5 variable against observed values where the probability of acceptance is highest. Both of the fits have demonstrated improved RMS error and correlation coefficient. The results are acceptable as an initial pre-operational phase. Accuracy of the predictions can be improved by fine tuning the emissions and updating the land use land cover data of the region. Rapid construction and urbanization activities have resulted in increased pollution levels across the region. Updating the source lists, active hours of the sources will certainly help in improved model predictions.
Air Quality management has emerged as a prior challenge for India as the country lists among the most affected cities by air pollution in the world. Establishing an accurate AQ forecasting system is a challenging task for a large region like India. Lack of information on type of pollution from natural/man-made activities along with accurate spatial and temporal information is the key to model the forecasting system. Different sources of pollutants can be found in different parts of the country. Implementing the SILAM model for such a diverse country in terms of ecology, geography and climate system is probably first of its kind effort known to us. We are continuously engaged in tuning the model concerning sectoral emissions and updated land use maps. As a preliminary phase the model performance is acceptable as per the statistical significance of the results against observations. Better understanding of pollution events across different parts of the country will certainly aid in improved forecasting capability of SILAM for India.
Authors have no competing interests regarding this manuscript. There is no funding associated with this research work. Data is stored locally and it can be made available if required by the journal. SILAM model has been developed by Finnish Meteorological Institute, Finland and its application for India has been developed by India Meteorological Department, New Delhi. The research work has not been submitted anywhere else for publication. The research work is original as per our knowledge and is relevant to the journal for publication.
Citation: Tiwari A, Soni VK, Jena C, Kumar A, Bist S, Kouznetsov R (2022) Pre-Operational Validation of Air Quality Forecasting Model SILAM for India. J Pollut Eff Cont. 10:343.
Received: 04-Apr-2022, Manuscript No. JPE-22-17239; Editor assigned: 07-Apr-2022, Pre QC No. JPE-22-17239 (PQ); Reviewed: 21-Apr-2022, QC No. JPE-22-17239; Revised: 28-Apr-2022, Manuscript No. JPE-22-17239 (R); Published: 05-May-2022 , DOI: 10.35248/2375-4397.22.10.343
Copyright: © 2022 Tiwari A, et al. This is an open-access article distributed under the terms of the Creative Commons Attribution License, which permits unrestricted use, distribution, and reproduction in any medium, provided the original author and source are credited.