Journal of Proteomics & Bioinformatics
Open Access
ISSN: 0974-276X
ISSN: 0974-276X
Research Article - (2009) Volume 2, Issue 1
The goal of this study is to use principal component analysis (PCA) for multivariate analysis of proteome dynamics based on both protein abundance and turnover information generated by high-resolution mass spectrometry. We previously reported assessing protein dynamics in iron-starved Mycobacterium tuberculosis, revealing interesting interconnection among the cellular processes involving protein synthesis, degradation, and secretion (Anal. Chem. 80, 6860-9). In this study, we use target-decoy database search approach to select peptides for quantitation at a false discovery rate of 4.2%. We further use PCA to reduce the data dimensions for simpler interpretation. The PCA results indicate that the protein turnover and relative abundance properties are approximately orthogonal in the data space defined by the first three principal components. We show the potential of the Hotelling’s T2 (T2) value as a quantifiable index for comparing changes between protein functional categories. The T2 value represents the gross change of a protein in both abundance and turnover. Close examination of the antigen 85 complex demonstrates that T2 correctly predicts the coordinated changes of the antigen 85 complex proteins. The multi-dimensional protein dynamics data further reveal the secretion of the antigen 85 complex. Overall, this study demonstrates PCA as an effective means to facilitate interpretation of the multivariate proteome dynamics dataset which otherwise would remain a significant challenge using traditional methods.
Keywords: Principal component analysis, Protein turnover, Mass spectrometry, Iron metabolism, Mycobacterium tuberculosis.
Protein turnover is a fundamental cellular process in all cell types having important implications in many aspects of biological science (Eagle et al., 1959; Larrabee et al., 1980; Tan et al., 2006; Wilkinson, 2005). Advancement of highresolution proteomic technologies has provided the possibility to study protein turnover for multiple proteins simultaneously in complex cellular protein extracts (Beynon, 2005; Cargile et al., 2004; Pratt et al., 2002; Rao et al., 2008a; Rao et al., 2008b; Vogt et al., 2003). We recently showed that combination of protein abundance and turnover data provides highly interesting insight into the dynamic process of and interconnection among protein synthesis, degradation, and secretion (Rao et al., 2008a).
The addition of the protein turnover dimension (Pratt et al., 2002; Rao et al., 2008a) into the proteomic data space, however, poses a challenge for automated data dissemination for biological meanings. We previously utilized clustering technique to identify the patterns that revealed protein dynamics in iron-starved Mycobacterium tuberculosis cells responding to a change in iron abundance (Rao et al., 2008a). Even with the aid of a clustering method, the process still required intensive manual inspection. Thus, a more automated procedure for identifying the most affected groups of proteins by the change in iron abundance in M. tuberculosis is highly desirable. Undoubtedly, modern proteomics as well as other molecular biology technologies will continue to generate megavariate datasets that will place ever increasing challenge in subsequent data processing that often requires multivariate analysis techniques.
Principal component analysis (PCA) is a statistical analysis technique utilized in many fields including proteomics research. It is an intuitive method that reduces a large number of variables to a smaller number of groups that can be more readily visualized and understood (Ivosev et al., 2008). For example, it has been used to estimate peptide abundance ratios (Pan et al., 2006), to classify proteomic signatures associated with the exposure of mussels to different marine pollutants based on 2D-gel and MS analysis (Apraiz et al., 2006), to identify principal kinetic patterns in Streptomyces coelicolor undergoing defined metabolic changes (Vohradsky and Thompson, 2006), and to simplify combined transcriptome and proteome time-course data of S. coelicolor for evaluating correlations amongst functionally related genes and interpreting the biological significance of such dynamics (Jayapal et al., 2008). In addition to the benefit of data dimension reduction to facilitate easier visualization and interpretation, another advantage is that the“knowledge of the source or nature of the variables in a group allows them all to be appropriately treated, for example, removed if they result from uninteresting effects or replaced by a single representative for further processing” (Ivosev et al., 2008).
In this paper, we seek to utilize PCA to simplify the combined protein turnover and abundance data for M. tuberculosis undergoing a shift from an iron-starved to an ironsufficient state (Rao et al., 2008a). The goal is to evaluate the potential of the PCA approach for more automated interpretation of the multi-dimensional data in large-scale proteome dynamics studies for M. tuberculosis.
The procedures for cell culture growth, sample preparation, and LC/MS analysis were fully described previously (Rao et al., 2008a) and will not be repeated in detail here. Briefly, a M. tuberculosis H37Rv culture was grown in an unlabeled defined low-iron (LI) medium (Rodriguez et al., 2002) to late log phase, and diluted by about 8-fold into a high-iron (HI) and a LI fresh media respectively. The fresh media contained [15N] labeled asparagine which was the sole nitrogen source in the media. Both fresh cultures were allowed to grow until the cell density tripled. The cells were harvested and lysed in a SDS/PAGE sample buffer containing 2% SDS by heating and bead beating as described before (Rao et al., 2008a). An aliquot of each of the two cell lysates were precipitated by acetone and dissolved for typsin digestion. Each aliquot contained 50μg of proteins. To ensure removal of residual SDS, the digested peptide solutions were purified with ZipTipC18 tips (Millipore, Billerica, MA). Eluents were pooled, diluted by 10 times with 0.1% TFA to reduce the ACN content to <5%, and submitted for LC/MS analysis at the Research Resources Center of University of Illinois at Chicago on a hybrid-linear ion trap-Fourier transform mass spectrometer (LTQFT) coupled with nanoliquid chromatography (nanoLC). Each sample was analyzed in triplicate LC/MS injections (Rao et al., 2008a).
Peptide and Protein Identification
In the previous study, we used a strict cutoff of p <0.01 in BioWorks for accepting peptides for quantitation (Rao et al., 2008a). In this study, we established the peptide and protein acceptance threshold using the decoy database search strategy so as to maximize the number of peptides and proteins that could be quantified (Kall et al., 2008). For this purpose, the RAW files generated from the six LC/MS injections were converted to mzXML format using the Trans- Proteomic Pipeline web interface (http://tools.proteomecenter.org/software.php). Database search was performed using Sorcerer™-SEQUEST® (Sage-N Research, Inc, San Jose, CA) provided by the Proteomics and Informatics Services Facility at the Research Resources Center of University of Illinois at Chicago. The mzXML files were searched against the M. tuberculosis H37Rv NCBI database appended with its reversed decoy database (Reidegeld et al., 2008). The peptide mass tolerance was set at 15 ppm with methionine oxidation as a differential modification. Up to 2 missed cleavages and isotope check using mass shift of 1.003 amu were allowed. We only accepted MS/MS identifications with peptide probability above 0.5 for quantitation. This resulted in 3716 qualified peptide identifications at a false discovery rate (FDR) (Kall et al., 2008) of 4.2%. These 3716 peptide identifications were used for downstream PCS and protein quantitation.
Quantitative analysis of the LC/MS data for different iso topic forms of the peptides and proteins was essentially as previously described (Rao et al., 2008a). At the last stage of cell harvest, each protein consisted of two isotopic forms. One corresponds to the old protein synthesized in the unlabeled LI medium and survived degradation and/or excretion after the cells grew in the labeled media. The other corresponds to the young protein synthesized after the cells were diluted in the labeled media. The abundance of a protein was thus quantified in three forms that respectively corresponded to the old protein (AL), the young protein (AM), and the total protein (AT). AT was the sum of AL and AM. Since the LI and HI samples were analyzed in triplicate LC/MS injections, total six tables containing the AL, AM, and AT values for each protein were generated, with one table for each injection. These six protein tables were generated based on the six tables containing the AL,PCS, AM,PCS, and AT,PCS values for each detected PCS. For each LC/MS injection, the PCS intensities were normalized by the sum of extracted ion chromatographic (XIC) intensities from all PCSs in that injection, and expressed in the unit of ppm. If a PCS did not have a full set of non-zero triplicate XIC intensity values in either the LI or the HI cells, the PCS was excluded. If the PCS had one missing value, it was filled by the average of the two values in the same culture sample. If it had two or three missing values, the missing values were filled by the average minimum XIC intensity across the six LC/MS injections, which was determined to be 0.1 in the unit of ppm. A total of 696 PCSs passed the requirement and were accepted for further analysis (Table S1, supporting information).
The 696 PCSs resulted in a total of 287 unique proteins identified from all of the six LC/MS injections. The steps of chromatogram alignment and cross-reference allowed quantitation of all of these 287 proteins in each injection (Table S2, supporting information) as described previously (Rao et al., 2008a). For individual LC/MS injections, the number of proteins identified by MS/MS scans was 175, 174, and 165 in the triplicate injections of the LI sample, and 102, 91, and 99 in the triplicate injections of the HI sample. In Table S2, the individual proteins identified in each injection by MS/MS scan were indicated by the spectral counts obtained for the proteins in each injection. The unnormalized total XIC intensities (in arbitrary unit) for the LI sample triplicate injections were 2.5x10¹⁰, 2.6x10¹⁰ and 2.3x10¹⁰ respectively. Those for the HI sample triplicate injections were 1.8x10¹⁰, 1.2x10¹⁰ and 1.9x10¹⁰ respectively. The ratio of the total XIC intensities between the new proteins and the old proteins was 3.0, 2.9 and 3.0 for the triplicate injections of the LI sample respectively. And it was 3.4, 3.4, and 3.4 for the triplicate injections of the HI sample respectively.
Quantitation of the Six Protein Ratio Categories
Because the focus of this study is to examine the group behavior of proteins instead of individual proteins, we used a less stringent criterion for accepting peptides and proteins for quantitative analysis compared to the previous works (Rao et al., 2008a; Rao et al., 2008b). Peptide identifications were accepted at a FDR of 4.2%, and proteins with one unique peptide identification were also included. From the 696 PCSs (Table S1), 287 unique proteins were identified and quantified for the six protein ratio categories including RAL, RAM, RAT, SDLI, SDHI and and RSD (Table S2) as described previously (Rao et al., 2008a; Rao et al., 2008b). RAL, RAM, and RAT are the relative abundance of the old, young, and total proteins between the HI and LI cells respectively. SDLI and SDHI are the synthesis over degradation ratio (Cargile et al., 2004) for the LI and HI cells respectively, expressed as the ratio of AM over AL. RSD is the ratio of SDHI over SDLI.
Three different methods were used to calculate the protein ratio readouts, namely median, mean and sum. In the median method, the median of all the PCS ratios for a protein was sought to represent the values of RAL, RAM, RAT, SDLI, and SDHI. The median of the ratios between SDHI,PCS and SDLI,PCS for all the PCSs of a protein was calculated to represent RSD of that protein. The mean method was carried out similar to the median method except that the mean instead of median was calculated. In the sum method, the respective AL,PCS, AM,PCS, and AT,PCS values were summed for all the PCSs of a protein to calculate RAL, RAM, RAT, SDLI, and SDHI (Rao et al., 2008a). RSD was then calculated as the ratio between SDHI and SDLI. Griffin et al. employed the summation method to calculate the protein reporter ion ratios in the iTRAQ quantitation strategy and showed that summing provides “the added advantage of stronger reporter ion signal intensities being weighted more heavily in the calculation than weaker signals” (Griffin et al., 2007).
Since AL,PCS, AM,PCS, and AT,PCS were measured in triplicate in both LI and HI cells, complete permutation of the triplicate values between LI and HI cells generated 9 answers for each of RAL, RAM, and RAT. Similarly, complete permutation of the triplicate values for SDLI and SDHI generated 9 answers for RSD which is the ratio of SDHI over SDLI. Altogether, there were 9 permuted answers for each of RAL, RAM, RAT and RSD, resulting in 36 ‘ratio readouts’. With the triplicate values for each of SDHI and SDLI, there were 6 more ‘ratio readouts’. This led to a total of 42 ‘ratio readouts’ for the six ratio categories including RAL, RAM, RAT, SDLI, SDHI, and RSD. The term ‘ratio readout’ is used here because all the six ratio categories are ratio properties. The 42 ratio readouts generated by each of the three protein quantitation methods led to a total of 126 protein ratio readouts.
Alternatively, we first calculated the average intensities for the PCSs from the triplicate (Table S1). The average PCS intensities were then used to calculate the six protein ratio categories. Since three methods (i.e. median, mean, and sum) were used, it resulted in 18 protein ratio readouts (Table S2).
Principle Component Analysis
We perform PCA using Matlab (Mathwork, Natick, MA). For PCA, we input the 128 or the 18 ratio readouts of the 287 proteins (Table S2) into the function PRINCOMP. This function returns the loadings, the coordinates of the original data in the new coordinate system defined by the principal components, the variances explained by each principle component, and the Hotelling’s T2 (T2) values of the tested proteins. T2 is a statistical measure of the multivariate distance of each observation from the center of the dataset. More specifically, the T2 value represents the index of gross change of a protein in both abundance and turnover between the LI and HI conditions, because the ratio readout matrix input into PRINCOMP contains the ratios of either protein abundance or turnover of a protein between the HI and LI cells. Thus the T2 value reduces six protein ratio categories into one single index of gross change for a protein. It is a simpler representation of the gross change of a protein in both protein abundance and turnover dimensions. The T2 value is then used as a quantifiable index of gross change for comparing the difference between two protein functional categories by the Wilcoxon ranksum test for the LI and HI samples. The Wilcoxon ranksum test is performed using the function RANKSUM in Matlab. Classification of the protein functional categories is based on the Tuberculist (http://genolist.pasteur.fr/TubercuList/) or the TIGR (http:// cmr.jcvi.org) definition.
Since the goal of this study is to reduce the data dimensions for simpler interpretation using PCA, we chose to include the data from all possible combinations of ratio calculation for the six ratio categories, as well as from three different protein ratio calculation methods including median, mean, and sum (see Methods). The redundancy of the data should not affect PCA while potential variations due to different methods would possibly be separated by PCA.
In the following we describe several aspects of the data analysis and interpretation process. First, the overall data profile of the 126 ratio readouts generated by three protein quantitation methods are evaluated for consistency and adequacy for PCA. Second, PCA is performed to examine the relationship between the protein abundance and turnover properties and to define the reduced data space. Third, the PCA output is evaluated for predicting gorss changes incurred in both abundance and turnover properties when the M. tuberculosis cells were shifted from the LI to the HI conditions.
Overview of the Six Ratio Category Data
As defined in Methods, the six ratio categories include three relative abundance ratios (RAL, RAM, and RAT), two protein turnover measurements in terms of synthesis over degradation ratio (SDLI and SDHI) (Cargile et al., 2004), and relative SD ratio (RSD).
In multivariate analysis (Olivieri, 2008), different data processing approaches may lead to some discretion in results. To avoid potential bias introduced by one particular method that could obscure the outcome of PCA, we perform protein quantitation using three different methods including mean, median, and sum (see Methods). In addition, we also maximize the possible combinations when calculating the six ratio categories by including all the permutations generated using the triplicate values (Table S1). This resulted in 126 ‘ratio readouts’ as defined in Methods. We believe that this comprehensive dataset should allow us to better investigate the true relationship between the relative abundance and protein turnover properties and to derive a reliable reduction of the data dimensions.
Because the focus of this study is to examine the group behavior of proteins instead of individual proteins, we used a less stringent criterion for accepting peptides and proteins for quantitative analysis compared to the previous works (Rao et al., 2008a; Rao et al., 2008b). Peptide identifications were accepted at a FDR of 4.2%, and proteins with one accepted peptide identification are also included. This results in a total of 287 unique proteins for further analysis in this study (Table S2).
Non-parametric boxplot analysis and one-way ANOVA analysis were performed on the 126x287 matrix consisting of the 126 ratio readouts for the 287 proteins to visualize the global pattern of the data (Figure 1). Figure 1a shows the boxplots of the 126 ratio readouts, and Figure 1b is the multiple- comparison graph for the 126 ratio readouts based on one-way ANOVA statistics.

Figure 1: Data overview of the six protein ratio categories. RAL, RAM, RAT, SDLI, SDHI, and RSD were calculated by the three methods including median, mean, and sum. This resulted in 126 ratio readouts with 42 for each method. The group of ratio readouts belonging to a specific method is indicated by the vertical colored bars at the right edge of each panel. The ratio readouts belonging to a specific ratio category are indicated by the vertical arrow. Panel a shows the boxplots for the 126 ratio readouts stacked in vertical direction. The black dots on the boxplots represent the medians. Panel b shows the multiple comparison graph based on one-way ANOVA statistics. Each horizontal bar represents a ratio readout for the 287 proteins with the circle at the center representing the mean, and the length of the bar indicating 95% confidence interval of the mean. Overlap of the ends of the bars suggests that the means are not statistically different. This particular multiple comparison graph in panel b shows the comparison of number 1 ratio readout (indicated by the blue color) versus the rest 125 ratio readouts. The two gray vertical dash lines indicate the 95% confidence interval of the mean of number 1 ratio readout. The ratio readouts shown in gray bars do not have a mean different from that of number 1 ratio readout, and those shown in red bars have a different mean. This test can be performed for each of the rest 125 ratio readouts (not shown).
Both the boxplots and the multiple comparison graph show highly consistent pattern of ratio readouts corresponding to the 3 different protein quantitation methods. Both the means and medians of RAL, SDHI, and RSD were around 2 to 4- fold while those of RAM, RAT, and SDLI were near 1-fold. This suggests that the old proteins were degraded and/or excreted more rapidly in the HI cells than in the LI cells. This is reasonable because the HI cells probably degraded those proteins important for the LI but not the HI cells to sequester vital iron content from the LI medium. In addition, shifting from the LI to the HI growth condition could also stimulate new protein synthesis and secretion activities in the HI cells (Rao et al., 2008a). This is reflected by the increase in the means and medians of the SDHI and RSD values, consistent with our previous analysis of the 104 proteins showing that at least 24 proteins had elevated SD while only 5 proteins were upregulated in the HI cells (Rao et al., 2008a).
PCA
Two PCAs are carried out. In the first PCA, the 126 ratio readouts for all the 287 proteins are subject to PCA. The PCA results are visualized by the biplot (Figure 2a). In the biplot, each of the 126 ratio readouts is represented by a vector shown in blue. The direction and length of a vector indicates how each ratio readout contributes to the three principal components in the plot. It is noteworthy that the 126 ratio readout vectors naturally fall into 6 distinct clusters which correspond to the six ratio categories, as labeled in the graph. Each cluster consists of 42 individual vectors belonging to the same ratio category. Two approximately orthogonal planes are defined by these ratio readout vector clusters. One is defined by the RAL, RAM, and RAT vector clusters and the other by the SDLI and SDHI vector clusters. This confirms that the SD values bear distinct protein dynamic properties that warrant consideration separate from relative abundance ratios (Pratt et al., 2002; Rao et al., 2008a). It is interesting to note that the RSD vector cluster lies at the intersection of the two orthogonal planes. This is not surprising because RSD can be expressed mathematically as either SDHI over SDLI or RAM over RAL. Considering that we assess this relationship using the comprehensive dataset generated by multiple methods and combinations, we believe that the orthogonal relationship between the protein abundance and turnover properties exists and is not an artifact of data processing.

Figure 2: Biplots based on the PCA results from the 126 individual ratio readouts (panel a) and the 18 average ratio readouts (panel b) for the six protein ratio categories RAL, RAM, RAT, SDLI, SDHI, and RSD. Each of the 126 ratio readouts (panel a) or the 18 average ratio readouts (panel b) is represented in the plot by a vector, and the direction and length of the vector indicates how each ratio readout contributes to the three principal components in the plots. Each of the 287 proteins is represented by a red dot in the plots. Since the ratio readouts belonging to the same protein ratio category tend to cluster together, they are collectively labeled with the corresponding protein ratio category. The vectors for the ratio readouts are not individually labeled which would have become too crowded.
In the second PCA, we want to simplify the graph of Figure 2a for easier visualization and down stream processing. To do so, we recalculate the readouts of the six ratio categories based on the average values of the triplicate PCS intensities (Table S1). We still use the three protein quantitation methods including medium, mean, and sum. This results in 18 ratio readouts for the six ratio categories. Each ratio category has 3 ratio readouts corresponding to the 3 different protein quantitation methods. PCA is performed on the resulting 18x287 matrix and the biplot is shown in
Comparison of the two biplots in Figure 2 indicates that the relative spatial orientation among the 6 ratio category vectors remains the same. It is noted that there is one nonessential difference that would not affect the PCA outputs. In Figure 2a, the plane define by the relative abundance properties aligns with the plane of components 1 and 2, and the plane defined by the turnover properties aligns with that of components 2 and 3. In Figure 2b, on the other hand, the plane define by the relative abundance properties aligns with the plane of components 2 and 3, and the plane defined by the turnover properties aligns with that of components 1 and 2. As expected, the RSD ratio category vectors lies at the interface of the two orthogonal planes in both biplots.
We further compare the variances borne by the first 3 principal components in the two PCAs shown in Figure 2. The variances explained by the first three principal components are 63% and 94% in Figure 2a and 2b respectively. This indicates that additional variances are contributed by those individual permuted ratio readouts, which however appear to also spread out into the principle components other than the first three. Use of the average PCS abundance values (Table S1) appears to remove many of those random fluctuations, and improves the PCA as shown by the increased percentage of variances explained by the first three principal components.
Regardless of the difference in percentage of variances explained by the first 3 principal components for the two PCAs shown in Figure 2, the results clearly indicate that the variances brought about by the shift in iron availability dominates over that caused by errors in the protein quantitation process. Thus, the PCA is adequate for evaluating the impact of iron availability shift on the proteome dynamics of M. tuberculosis. The results confirm that the two PCAs reveal the same correlation between the protein abundance and turnover properties, and both correctly distinguish all the six ratio categories. Given that the second PCA is less prone to experiment errors, hereafter, further analysis is based on the output from the second PCA (Figure 2b) unless specified otherwise.
The Scree plot of the PCA shows the percentage of variances explained by the first 3 principal components (Figure 3a). It is interesting to note that the loadings in principal component 1 are dominated by SDLI, SDHI, and RSD (Figure 3b) while principal component 3 contains loadings mostly from RAL, RAM and RAT (Figure 3d). These results confirm the observation in Figure 2 that the plane defined by RAL, RAM, and RAT is approximately orthogonal to that defined by SDLI and SDHI. RSD has the largest loading in principal component 2 (Figure 3c) but also has significant loading in the other 2 principal components, consistent with that the RSD vectors are positioned at the intersection between the plane defined by SDLI and SDHI, and that by RAL, RAM, and RAT. Principal component 1 explains 62% variances while that of principal component 3 explains 12%, suggesting that SDLI, SDHI, and RSD have larger changes than RAL, RAM, and RAT. This was indeed the case as found in the previous study that nearly five times more proteins were found to have elevated SD than to have upregulated abundance when the M. tuberculosiscells were shifted from LI to HI conditions (Rao et al., 2008a).

Figure 3: Variances borne by the first 8 principal components (a) and loadings of the first 3 principal components (b-d) based on the PCA of the 287x18 matrix consisting of the 287 proteins with the 18 average ratio readouts shown in Figure 2b. In b, c and d, the loadings belonging to the median, mean, and sum methods are colored blue, green, and red respectively.
Although the first 2 principal components represent 82% variances and the 3rd principal component represents only 12%, we choose to map the 287 proteins into the 3-D space defined by the first 3 principal components instead of a 2-D plane defined by the first 2 principal components. This is because of the dominant contribution of RAL, RAM, and RAT to the 3rd principal component (Figure 3d).
The T2 value is a statistical measure indicating the multivariate distance of each protein from the center of the dataset. This is used to find the proteins with extreme changes in the data. As expected and shown in Figure 4, the proteins with T 2 5 , which is the median T2 for the 287 proteins, mostly distribute at the outer shell of the data cluster. We also examine the distribution of the proteins with different spectral counts. Figure 4 shows that the proteins at the most outward space tend to have lower spectral counts. This however does not imply that proteins with a large spectral count have lower T2 values, as verified in Figure S1. In other words, significant changes occur at all levels of protein abundance. This excludes the possibility that the changes observed were mainly due to experimental error or computational method bias. This is also confirmed in Figure 3. The highly ordered contribution of the six protein ratio categories to the first 3 principal components (Figure 3) does not support that measurement variations play a dominant role in the patterns we have observed. In Figure 3, the first 3 principal components almost perfectly explain all of the variances (94%). The six ratio categories have distinct distribution patterns among the first 3 principal components. Thus, the PCA results correctly reflect that the M. tuberculosis cells adjust protein synthesis, degradation, or secretion to adapt between the LI and HI conditions (Rao et al., 2008a).

Figure 4: Scatter plots of the scores from the PCA shown in Figure 2b for all the 287 proteins (a), the proteins with >1 spectral counts (b), the proteins with >3 spectral counts (c), and the proteins with >5 spectral counts (d). Each open red circle represents a protein. A red circle overlaid by a concentric blue dot indicates that the protein has a T2 value greater than 5 which is the median T2 for the 287 proteins.
Analysis on Functional Categories
We perform statistical analysis on different functional categories of proteins using T2 as the index of gross change of a protein incurred in both abundance and turnover. As shown in Figure 5, we group the 287 proteins based on the 12 functional categories defined in Tuberculist to test whether a functional category of proteins has more significant changes than others. The regulatory proteins (FCC =9) turn out to have a median T2 statistically higher than that of all the 287 proteins, as well as higher than those of several other functional categories (Figure 5). Since the TIGR functional category definition is more detailed, we also group the 287 proteins based on the 25 TIGR functional categories (Figure S2) to verify the result found with the Tuberculist definition. Based on the TIGR definition, the regulatory protein functional category still has a median T2 larger than those of most other functional categories. The median T2 of the proteins in the regulatory functional category is statistically higher than those of three other functional categories. The result is consistent with what we observe using the Tuberculist definition. Among the detected regulatory proteins is Rv1626, a two-component system transcriptional regulator. It has a T2 value of 36.1 and 3 detected peptides. The results from the three protein quantitation methods indicate that Rv1626 has RAL of 0.78-1.1, RAM of 1.5-2.0, RAT of 1.4-1.7, and RSD of 1.4-3.4 (Table S2), suggesting possible upregulation of its de novo synthesis at the HI condition. Rv1626 has been proposed to be a putative transcriptional antiterminator from M. tuberculosis based on a structural study (Morth et al., 2004). It is a RNA binding protein and was shown to be required for optimal growth of M. tuberculosis (Sassetti and Rubin, 2003).

Figure 5: Boxplots of the T2 values for groups of proteins falling into different functional categories based on the Tuberculist functional category codes (FCCs): 0-virulence, detoxification, adaptation; 1- lipid metabolism; 2-information pathways; 3- cell wall and cell processes; 7- intermediary metabolism and respiration; 9- regulatory proteins; 10- conserved hypotheticals; 16- conserved hypotheticals with an orthologue in M. bovis. ‘FCC=all’ means all proteins are included. The blue boxplots have median T2 statistically different from that of the red boxplots based on Wilcoxon ranksum test, and the black boxplots do not. The number of proteins (n) in each functional category is indicated under each boxplot. In each boxplot, the two ends of the box represent the first quartile and the third quartile of the T2 values of the proteins in the functional category. The line across the middle of the box at the notch represents the median T2 value. The whiskers are set as 1.5 times the interquartile range. The T2 values beyond the whiskers are marked as ‘+’.
It is intriguing to observe that these regulatory proteins collectively have higher T2 values. On the other hand, most of these regulatory proteins are expressed at low abundance as suggested by their small number of detected peptides (1 to 2). This does not allow us to further analyze many of them on an individual basis with statistical confidence. This will await further in-depth analysis of the proteome. Nevertheless, the results here demonstrate that T2 as an index is useful for analyzing groups of proteins. Upon the availability of larger dataset, T2 may be useful for studying pathway response based on protein dynamics data as well.
Other Proteins with Large T2 Values
The list of the proteins having T2 values greater than the third quartile T2 include many of those proteins previously found to have statistically significant changes in protein turnover, such as AtpD (Rao et al., 2008a; Rao et al., 2008b), SodA (Rao et al., 2008a; Rao et al., 2008b), KatG (Rao et al., 2008a; Rao et al., 2008b), Mce1D (Rao et al., 2008a), and Rv0284 (Rao et al., 2008a) (Figure 6). Together with AtpD, the other two detected F0F1-ATP synthase subunits AtpA and AtpH are also within these 71 proteins having T2 greater than the third quartile T2. These 71 proteins also include 17 of the 26 proteins found to have statistically significant protein turnover change in the previous study (Rao et al., 2008a). These results strongly support that T2 is a very useful index of gross change for ranking proteins having a significant change in protein dynamics. In this study, T2 values are calculated using both protein turnover and relative abundance information generated by several complementary quantitation methods. We anticipate T2 to be a more comprehensive means to capture changes originating from the proteome dynamics, compared to using protein turnover or relative abundance data alone. It also makes the integration of the protein abundance and turnover data seeminglessly straightforward.

Figure 6: Seventy-one proteins having T2 greater than the third quartile of 17.3. The proteins in red are several characteristic examples found to have significant protein turnover in previous studies under iron regulated conditions for mycobacteria (Rao et al., 2008a; Rao et al., 2008b).
Using the antigen 85 complex as an example, we further examine the consistency of using T2 in discerning changes for proteins having related functions. The antigen 85 complex is a predominant secreted component identified in all filtrates of mycobacterial species examined to date (Daffe, 2000). The antigen 85 proteins are encoded by the fibronectin-binding protein (Fbp) genes. These proteins have mycoloyltransferase activity, and catalyze the transfer of a mycoloyl residue from one molecule of α, α'trehalose monomycolate to another that leads to the formation of α, α' trehalose dimycolate. They thus have an important role in cell wall integrity and permeability. Interestingly, isoniazid induces the overexpression of the antigen 85 complex in M. tuberculosis (Garbe et al., 1996). This is however not surprising because isoniazid targets InhA which results in blockage of the biosynthesis of mycolic acids which are major lipids of the mycobacterial envelope (Marrakchi et al., 2000). The antigen 85 complex proteins also exhibit fibronectinbinding activity. They could facilitate the entry of mycobacteria into host cells (Hetland and Wiker, 1994), suggesting that they also involve in pathogenicity. Indeed, disruption of the antigen 85A gene in this complex attenuated the virulence of H37Rv in mice, but the mutant retained vaccinogenic potential (Copenhaver et al., 2004). The antigen 85 complex consists of three proteins in mycobacteria, including FbpA, FbpB, and FbpC. These multiple Fbp enzymes have partial redundancy in mycoloyltransferase activity and are not specific for the various arabinogalactan mycoloylation regions (Puech et al., 2002). Completion of the M. tuberculosis genome (Cole et al., 1998) revealed that a fourth gene, fbpD, is also present and codes for a Fbpresembling protein. All of FbpA, FbpB, FbpC, and FbpD are detected in this study. Based on the function redundancy and similarity, we anticipate these Fbps to share similar trend of changes.
The Fbps have similar T2 values ranging from 15.6 to 19.2, which are around the third quartile T2 of 17.3. From Table 1, it is first noticeable that most of the relative abundance ratios are below 1, concurring with the fact that these Fbps are major secreted proteins in the mycobacterial filtrates. The highly consistent RAL values (between 0.45 and 0.61) for FbpA, FbpB, and FbpC indicate that these proteins are secreted by a similar proportion. The RAL value measures how much of the old fraction of a protein remained in the cells after the cultures grew by 2-fold increase in cell density in the LI and HI media respectively (Rao et al., 2008a). The RAL values would remain at 1 if no secretion or degradation occurs. The data here indicate that about 45% more of the old FbpA, FbpB, and FbpC were secreted in the HI cells than in the LI cells, suggesting accelerated secretion of FbpA, FbpB, and FbpC in the HI cells. If there was no difference in de novo synthesis rate between the LI and HI cells, the RAM values should remain similar to the RAL values. The data in Table 1 show the opposite. The RAM values are collectively higher than the RAL values, suggesting increased accumulation of new fraction of the proteins in the HI cells. This increased accumulation of the de novo synthesized proteins, however, does not result in upregulation of the intracellular abundance of these Fbps. The total abundance of these Fbps actually deceases in the HI cells as shown by the observation that the RAT values are all less than 1. We exclude the possibility that these proteins were downregulated in expression, because the protein turnover values (SD) are higher than 2 for FbpA, FbpB, and FbpC. A theoretical value of 2 is expected for SD because the cultures grew by 2-fold increase in cell density (Rao et al., 2008a). Deviation from this expected value is a reflection of protein degradation, secretion, or change in expression. FbpA, FbpB, and FbpC have SD values greater than 2, indicating active de novo synthesis. With a rate of de novo synthesis greater than that of secretion or degradation, secretion or degradation contributes to a higher SD value (Rao et al., 2008b). Thus, the data indicate active de novo synthesis as well as secretion of FbpA, FbpB, and FbpC. The RSD values have the overall trend of being greater than 1 but this is not statistically significant. Thus, the data only indicate slight regulation of turnover for these Fbps by the shift in iron availability. Nevertheless, FbpA, FbpB, and FbpC share similar trend of changes as predicted by their T2 values.
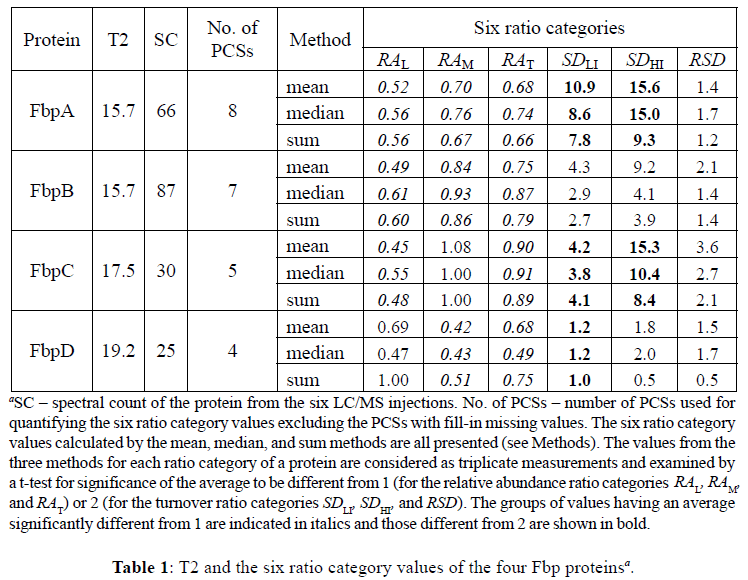
Although FbpD shares similar trend of changes in relative abundance with the other Fbps, it differentiates itself from the other three Fbps in protein turnover. The SDLI and SDHI values are smaller than 2 for FbpD. This indicates that de novo synthesis was slower for FbpD than for the other three Fbps. This different pattern of change for FbpD is not surprising. Although FbpD resembles the other Fbps in amino acid sequence, the three critical amino acids of the carboxypeptidase catalytic site in the other Fbps were replaced in FbpD (Ronning et al., 2000), rendering FbpD without mycoloyltransferase activity. FbpD is thus most probably an inactive enzyme (Puech et al., 2002).
Combination of protein turnover and abundance data provides multi-dimensional information for more sensitively dissecting the proteome dynamics of iron-starved M. tuberculosis cells in response to a change in iron availability. Meanwhile, the data represent a challenge for automated interpretation of biological meanings. In this study, we have demonstrated that PCA can be used to reduce the data dimension with little loss of information. We have used the T2 value as the index of gross change to compare the proteins belonging to different functional categories. The results suggest that the proteins belonging to the functional category of regulatory proteins show a median T2 value that is statistically higher than those from some other functional categories. We also closely examine the antigen 85 complex, demonstrating that T2 correctly predicts the coordinated changes of the antigen 85 complex proteins.
This study shows that T2 is a useful quantifiable index for analyzing the response of groups of proteins in proteome dynamics studies. The T2 value will probably be also adequate for pathway analysis using both protein turnover and abundance information which is under ongoing study.
This work was supported by the Hans Vahlteich Research Award from College of Pharmacy at University of Illinois at Chicago, and the NIH grant R03AI073469-01A1. We thank G. Marcela Rodriguez and Issar Smith for kindly reading the manuscript and providing helpful comments.