Chemotherapy: Open Access
Open Access
ISSN: 2167-7700
ISSN: 2167-7700
Research Article - (2022)Volume 10, Issue 4
Background: Bladder Cancer (BLCA) is one of the most common human cancers its incidence is on the rise, especially in females. The Tumor Micro Environment (TME) acts a significant part in the development and progression of the tumor. We surveyed the expression profiles of BLCA in the Cancer Genome Atlas Program database and investigated genes that might affect the composition of the Tumor Micro Environment (TME). We then analyzed the relationship between genes and tumor prognosis, looking for immune prognostic markers which might lead to new styles for the diagnosis and treatment of BLCA.
Methods: We got the RNA-seq data of BLCA from The Cancer Genome Atlas (TCGA); utilized the Estimation of Stromal and Immune Cells in the Malignant Tissues Expression (ESTIMATE) data algorithm to compute the immune and stromal score. The differentially expressed genes were performed in COX regression analysis and used to construct a Protein-Protein Interaction (PPI) network.
Results: Intersection analysis demonstrated that Matrix Metalloproteinase-9 (MMP9) is the only crossover gene. We computed the percent of Tumor-Infiltrating immune Cells (TICs) in BLCA through the Cell-type Identification by Estimating Relative Subsets of RNA Transcripts (CIBERSORT) algorithm. The differences in the high and low expression groups of MMP9 in TICs were established. The expression levels of MMP9 in each kind of TICs were then correlated. Via survival, clinical, and enrichment analyses, MMP9 was found to be an immune prognostic factor for BLCA and act a significant part in the tumor microenvironment. Ultimately, the correlation analysis between MMP9 and the immune checkpoint genes indicated that MMP9 can forecast the effect of immunotherapy on BLCA.
Conclusion: MMP9 is an immune prognostic marker gene. MMP9 is involved in regulating the immunological process of BLCA through multiple pathways and is closely related to PD-1 and CTLA4 immune targets. The expression of MMP9 may impact the prognosis of BLCA, indicating that it may be a prognostic-related marker of BLCA.
Bladder cancer; MMP9; Bioinformatics analysis; Immune infiltration; Immune checkpoint
BLCA: Bladder Cancer; TME: Tumor Microenvironment; TCGA: Cancer Genome Map; DEGs: Differentially Expressed Genes; MMP: Stromal Metalloproteinase; FDR: False Discovery Rate; PPI: Protein-Protein Interaction; GO: Gene Ontology; KEGG: Kyoto Encyclopedia of Genes and Genomes; TICs: Tumor Infiltrating Immune Cells; ECM: Extracellular Stromal.
L Bladder Cancer (BLCA) is one of the most common cancers among men, and the incidence also has been on the rise in female recently [1]. There are many risk factors associated with BLCA. Tobacco exposure is thought to be the most important one [2]. Early diagnosis and treatment can greatly decrease the risk of metastasis and disease-specific mortality. Checkpoint inhibitors, targeted therapies, and immunotherapy provide are now available for patients in various stages of the disease. Thus, identification of biomarkers and therapeutic targets that can accurately identify and predict the prognosis of BLCA has become paramount importance. The tumor microenvironment is complicated and dynamic environment. Besides addition to basal cells, fibrocytes and endotheliocytes, TME also includes many innate and adaptive immune function cells [3]. Recent studies have been concentrating on the mechanism of tumor microenvironment to identify biomarkers that can serve as predictors for immunotherapeutic response, and to explore new venues for immunotherapeutic interventions [4]. In this research, we downloaded data from the Cancer Genome Atlas (TCGA); used ESTIMATE data algorithm to assign stromal score and immune score for BLCA samples to screen for differential genes. Concurrently, we used Cell-type Identification by Estimating Relative Subsets of RNA Transcripts (CIBERSORT) algorithm to find out tumor infiltrating immune cells (TICs) in the samples to screen the marker Matrix Metallo Proteinase-9 (MMP9) gene [5].
The analytic process is shown in Figure 1. The data of TCGA database was downloading first, and then we used the ESTIMATE method to score the samples and use the CIBERSORT method to evaluate TICs. Then differential genes were screened out via immune and stromal score by using the ESTIMATE method, which applied to perform the PPI networks and univariate COX regression analysis. Then we dug out the MMP9 as the only overlapping gene. Finally, we complete survival analysis, clinical stage correlation analysis, enrichment analysis, TIC correlation analysis and correlation analysis of immune checkpoint genes of MMP9 (Figure 1).
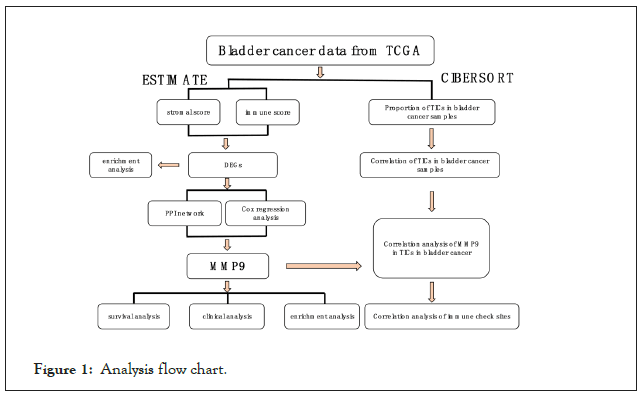
Figure 1: Analysis flow chart.
Data sources
The transcriptome RNA-sequence and clinical data of 412 BLCA patients from TCGA were downloaded and used to follow-up analysis.
Immune score and stromal score
We used the R version 4.1.1 of the "ESTIMATE " packages to score each sample's immune score and stromal score. The summation of the above two score was then used for further analysis. The ratio of the scores to the corresponding components is positively correlated. A high score indicated that the components appeared frequently in TME.
Survival and clinical stage correlation analysis of high and low score group
Based on above two scores and gene expression levels, we analyzed the clinical data of the 412 cases utilizing the R tool "survival" and "survminer" packages to select the optimal cutoff value and divide them into high and low expression groups. The Kaplan-Meier survival curve was then plotted, and significant differences were assessed through log rank test. p<0.05 was deemed significant. Additionally, we compared samples in the different clinical stages using either Wilcoxon or Kruskal-Wallis rank tests.
Immune score and stromal score to screen out differential expressed genes
The "limma" package of R tool was used to determine differentially expressed genes (DEGs) between the high and low score groups. A threshold was set to log |fold change|>2 and a false discovery rate (FDR) of<0.01. The "heat map" package of R tool was then chosen to draw a heat map of DEGs.
Enrichment analysis
We used the "clusterProfiler", “enrichplot”, and “ggplot2” packages of R tool to draw charts for Gene Ontology (GO) enrichment analysis and for the Kyoto Encyclopedia of Gene and Genomes (KEGG) pathway enrichment analysis of the 280 DEGs. P values and FDR<0.05 denoted significant enrichment.
Building protein-protein interaction networks
The PPI networks were built via STRING and visualized through Cytoscape version 3.9.0.
Construct COX regression analysis
The DEGs was used to perform univariate COX regression analysis through the "survival" packages of R tool.
Gene set enrichment analysis
GSEA software version 4.1.0 was used to make the KEGG enrichment analysis for the transcriptome of all tumor samples. P<0.05 and FDR<0.05 represented acceptable results.
Analysis about relative proportion of TIC and correlation analysis of immune checkpoint genes
CIBERSORT algorithm was employed to compute the relative scale of TICs in the BLCA specimen. Samples with difference in the expression of candidate biomarkers p<0.05 were selected. Correlation analysis of checkpoint genes was then performed.
Finally, immune and stromal scorings were derived using the ESTIMATE method. The percentage of TICs was computed through CIBERSOR. The MMP9as a TME-related gene was identified by utilizing the univariate Cox regression analysis and Protein-Protein Interaction (PPI) networks.
Analysis process
Correlation between ESTIMATE score and prognosis: The immune and stromal score both have negative correlation with the survival rate of BLCA patients, but the estimate score has no correlation with the survival rate of BLCA (Figure 2).
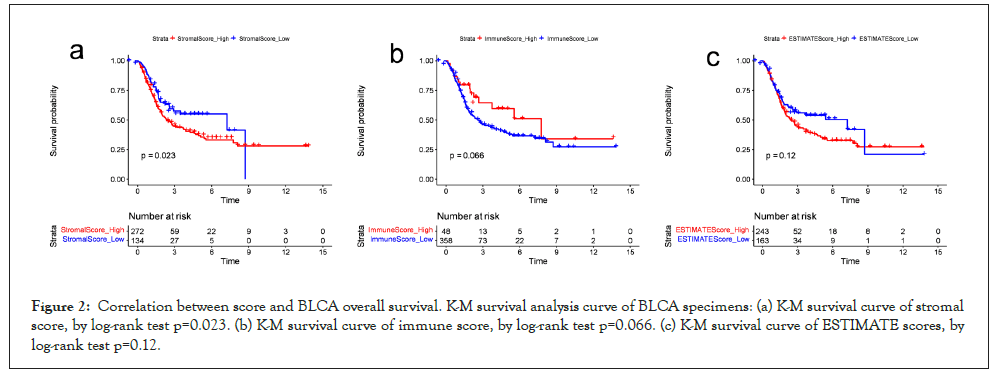
Figure 2: Correlation between score and BLCA overall survival. K-M survival analysis curve of BLCA specimens: (a) K-M survival curve of stromal score, by log-rank test p=0.023. (b) K-M survival curve of immune score, by log-rank test p=0.066. (c) K-M survival curve of ESTIMATE scores, by log-rank test p=0.12.
Next, we compare the clinic pathological staging and gender of the two high and low score groups. Shown in Figure 3, stromal score and estimate score is correlated with stage II and III, stage II and IV in tumor stage respectively, and immune score has no significant correlation with tumor stage; however, all the score was uncorrelated with the clinical stage, indicating that two types of scores are relevant to the progression of BLCA. Moreover, all scores are also related to gender. Our result shows that the prevalence of men is higher than that of women, which is consistent with previous conclusions (Figure 3).
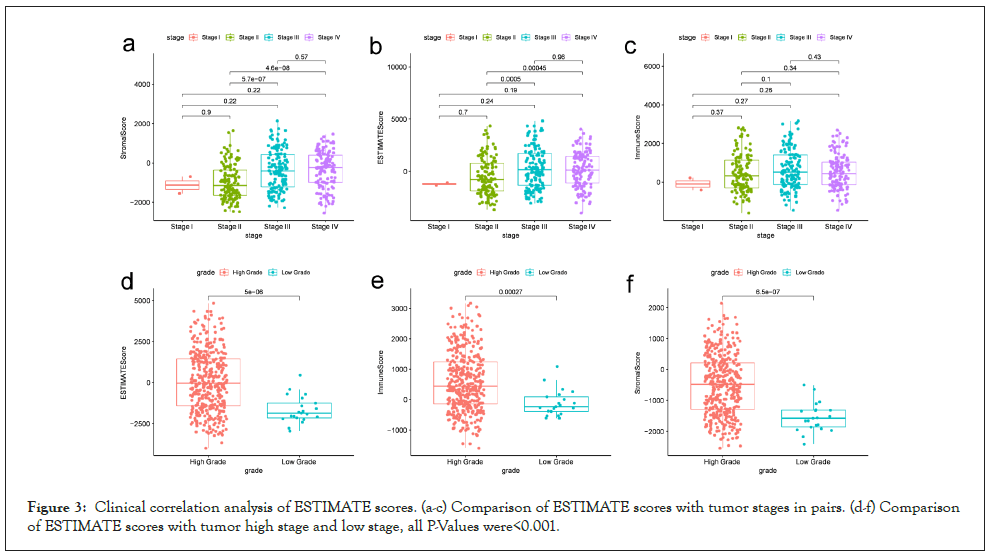
Figure 3: Clinical correlation analysis of ESTIMATE scores. (a-c) Comparison of ESTIMATE scores with tumor stages in pairs. (d-f) Comparison of ESTIMATE scores with tumor high stage and low stage, all P-Values were<0.001.
Filter DEGs by score: There are 461 up-regulated DEGs and 35 down-regulated DEGs screened totally in immune score analysis. 496 up-regulated DEGs and 54 down-regulated DEGs screened in stromal score analysis. At the same time, we acted GO and KEGG pathway analysis of 280 co-expressed genes. The results of GO analysis show that the co-expressed genes are mainly enriched in the regulation of immune effect process, immune cell proliferation and cytokine activation, etc. and immune response. KEGG analysis results show that DEGs are mainly enriched in cytokines, the formation of extracellular bactericidal network of neutrophils and phagosomes, which are all related to immunity. Summing up the two above enrichment analysis results, we conclude that the function of differential genes may be involved in immune reaction, showing that immune reaction is essential to the TME of BLCA (Figure 4).
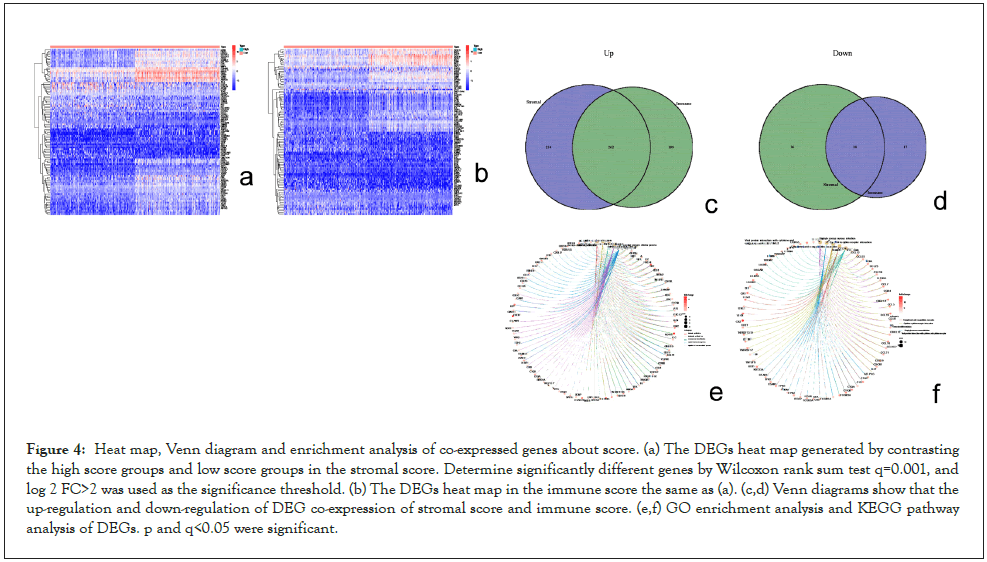
Figure 4: Heat map, Venn diagram and enrichment analysis of co-expressed genes about score. (a) The DEGs heat map generated by contrasting the high score groups and low score groups in the stromal score. Determine significantly different genes by Wilcoxon rank sum test q=0.001, and log 2 FC>2 was used as the significance threshold. (b) The DEGs heat map in the immune score the same as (a). (c,d) Venn diagrams show that the up-regulation and down-regulation of DEG co-expression of stromal score and immune score. (e,f) GO enrichment analysis and KEGG pathway analysis of DEGs. p and q<0.05 were significant.
PPI networks and COX regression analysis of co-expressed genes: We employed the STRING online tool to build a PPI network in order to analyze the relationship between DEGs, and then visualized it via Cytoscape version 3.9.0. And then we the top 30 genes were selected in the number of protein interaction network nodes. What’s over, we completed univariate COX regression analysis to find the relationship between the above genes and BLCA, and finally got 4 genes. Then, we used the Venn diagram to take the intersection that obtained from the top 30 genes in the number of protein interaction network nodes and the genes gotten via the univariate COX regression analysis. Finally, we screened out the MMP9 (Figure 5).
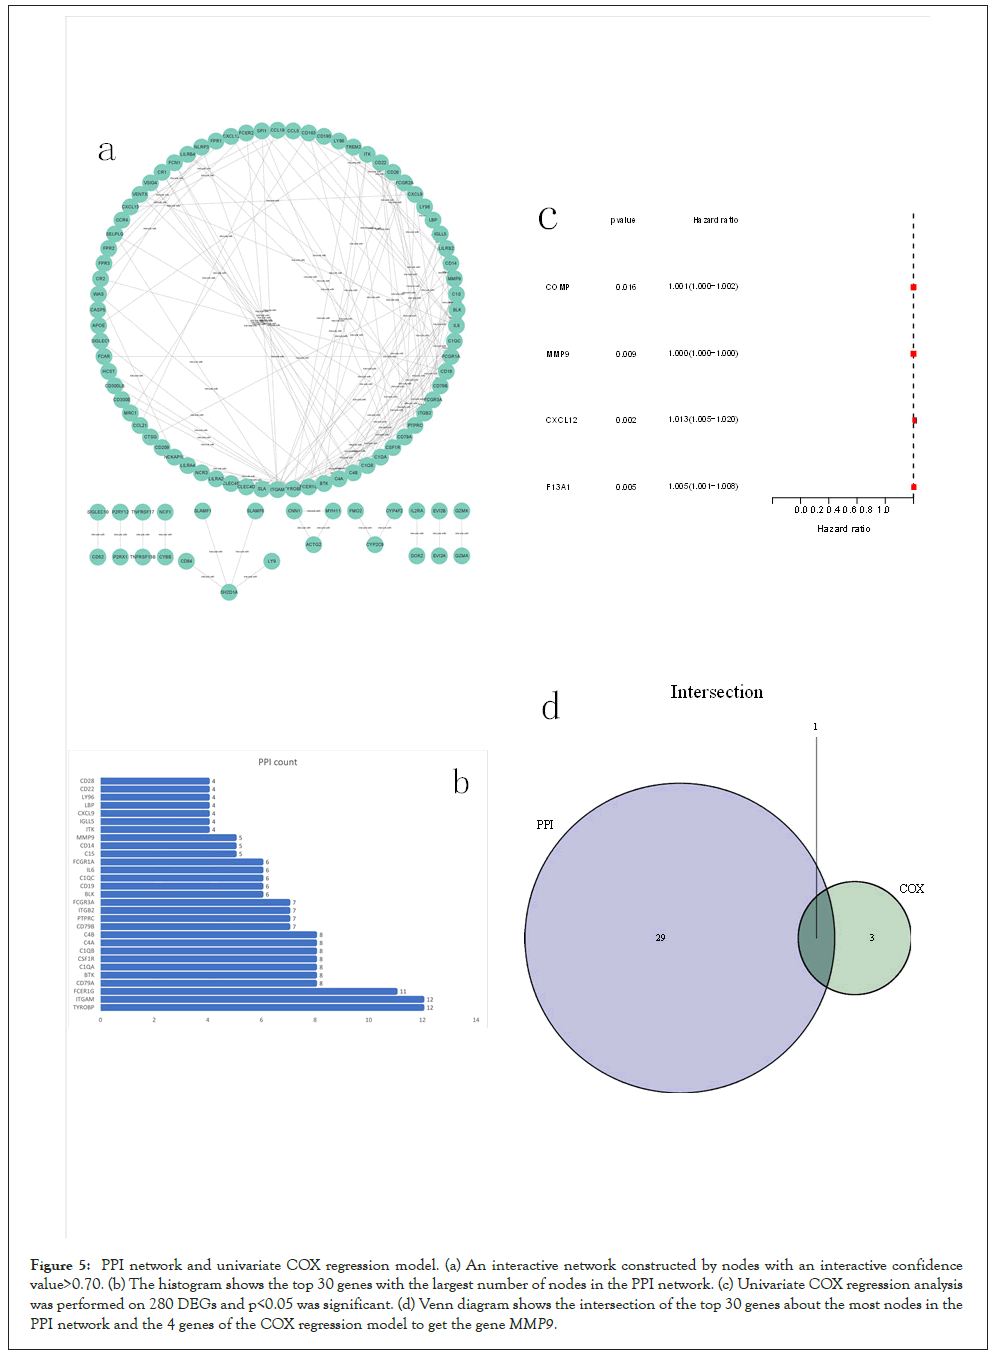
Figure 5: PPI network and univariate COX regression model. (a) An interactive network constructed by nodes with an interactive confidence value>0.70. (b) The histogram shows the top 30 genes with the largest number of nodes in the PPI network. (c) Univariate COX regression analysis was performed on 280 DEGs and p<0.05 was significant. (d) Venn diagram shows the intersection of the top 30 genes about the most nodes in the PPI network and the 4 genes of the COX regression model to get the geneMMP9.
Expression difference of MMP9 and clinical correlation analysis: After obtaining the gene, we analyzed the expression differences of MMP9 in the tissue of normal and tumor and studied its relationship with BLCA. MMP9 is significantly differently expressed in the tumor tissue and normal tissue, it expressed highly in the tumor tissue (P=0.003). The results of the survival analysis showed that the survival rate of patients about MMP9 gene high expression is lower than that with low expression in BLCA (P=0.021). Besides, MMP9 has significant differences in expression with tumor stage, including stage II and stage III and stage IV (P<0.001). The higher the staging, higher the expression. In summary, it may be related to the prognosis of BLCA about the expression of MMP9 (Figure 6).
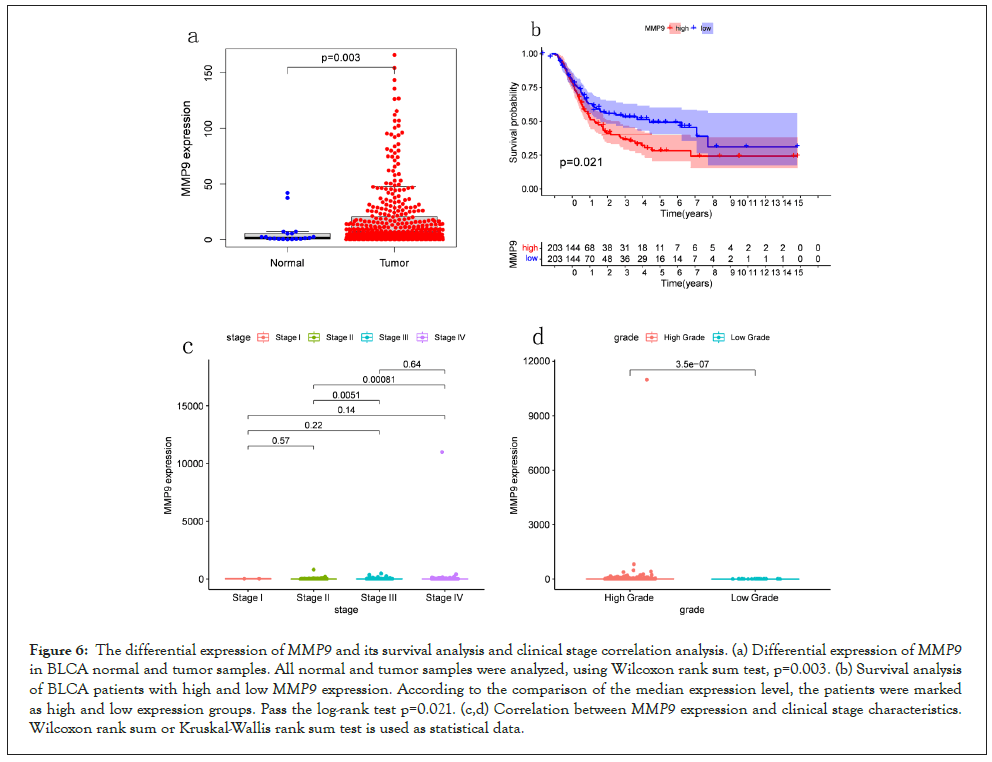
Figure 6: The differential expression ofMMP9 and its survival analysis and clinical stage correlation analysis. (a) Differential expression ofMMP9 in BLCA normal and tumor samples. All normal and tumor samples were analyzed, using Wilcoxon rank sum test, p=0.003. (b) Survival analysis of BLCA patients with high and lowMMP9 expression. According to the comparison of the median expression level, the patients were marked as high and low expression groups. Pass the log-rank test p=0.021. (c,d) Correlation betweenMMP9 expression and clinical stage characteristics. Wilcoxon rank sum or Kruskal-Wallis rank sum test is used as statistical data.
Enrichment analysis of MMP9: Then we make enrichment analysis via GSEA version 4.1.0. The co-expressed genes are mostly enriched in chemokine signaling pathways, cytokine, and Cell Adhesion Molecules (CAMs), all of which are related to immune response in the high expression group of MMP9. Interestingly, the enrichment analysis of MMP9 low expression is not significant. The enrichment analysis results show that there is a very close relationship between MMP9 and TME for bladder cancer (Figure 7).
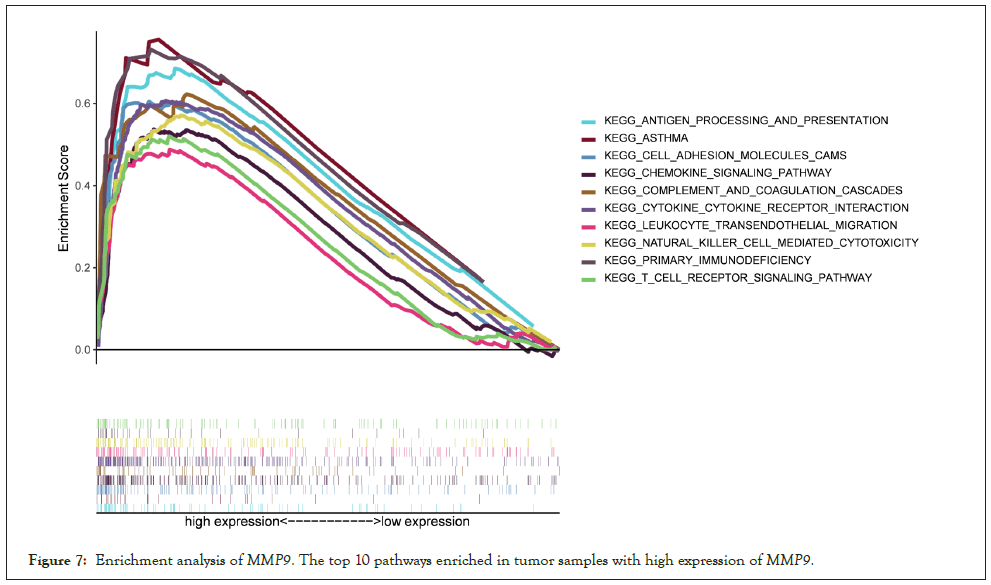
Figure 7: Enrichment analysis ofMMP9. The top 10 pathways enriched in tumor samples with high expression ofMMP9.
Correlation between MMP9 and TICs: We analyzed the proportion of 22 types of TICs determined in BLCA case by the way of CIBERSORT algorithm in R tool. Then we made a difference and correlation analysis between the high expression groups and low expression groups of MMP9 and TICs to further confirm the role of MMP9 in TME. Difference analysis showed that 7 types of TICs were related to the expression of MMP9. Correlation analysis externalized that the 10 types of TICs were correlated with the expression level of MMP9. Then we obtained 6 types of TICs related to the expression of MMP9when taking the intersection of the two analysis results. Among them, macrophages M0 and eosinophils are positively correlated with the expression of MMP9. On the other hand, activated dendritic cells, mast cells, CD8 T cells, and monocytes are negatively correlated with the expression of MMP9. The above results further prove that MMP9 may have great importance in the immune response of bladder cancer TME (Figures 8A-8E).
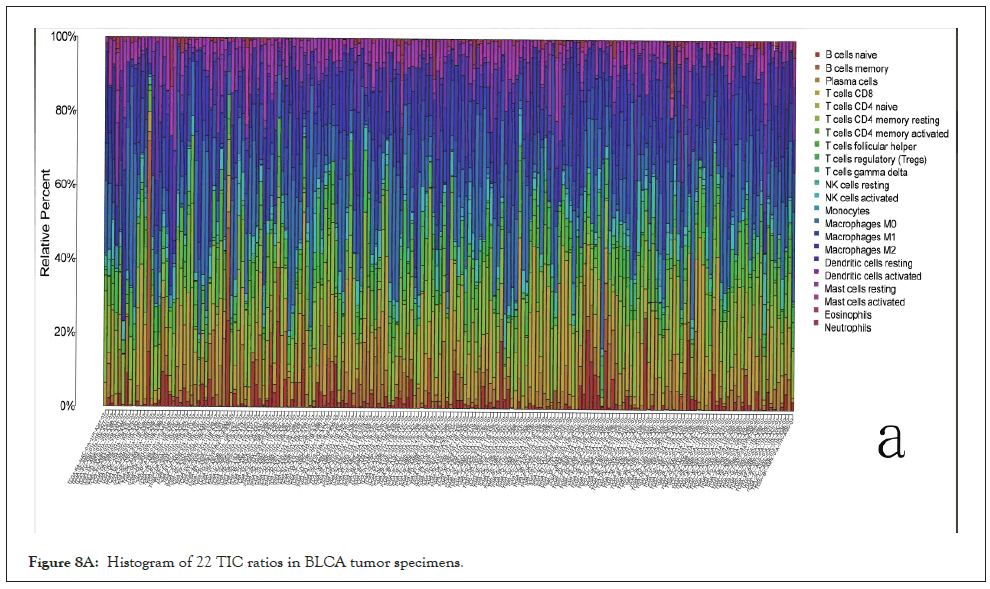
Figure 8A: Histogram of 22 TIC ratios in BLCA tumor specimens.
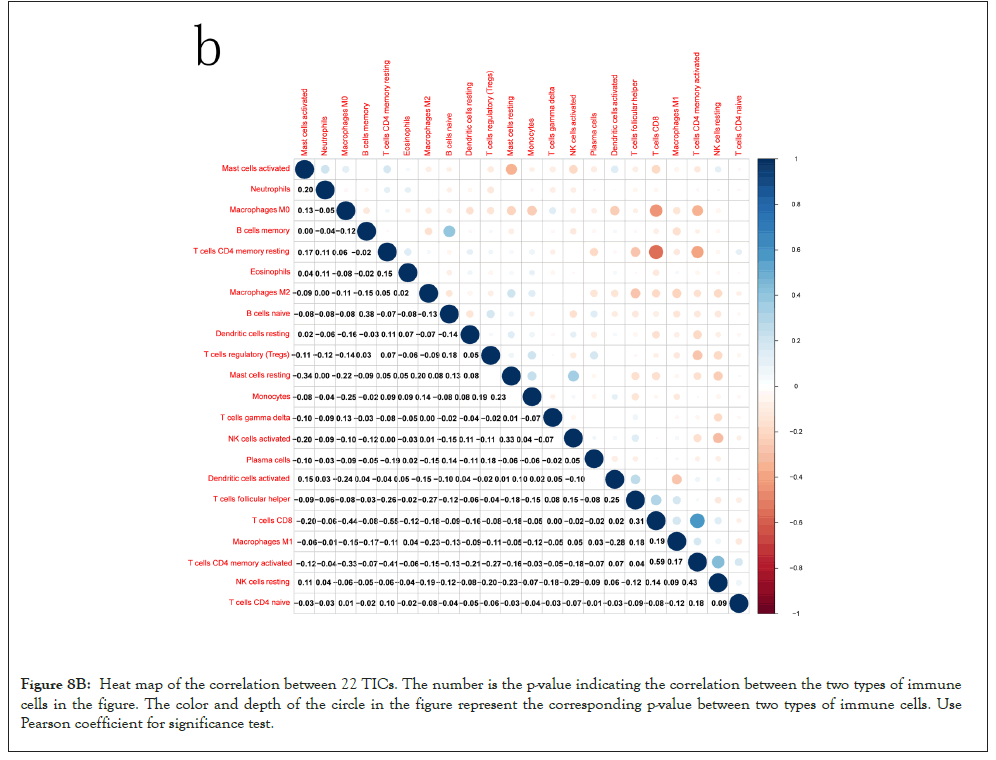
Figure 8B: Heat map of the correlation between 22 TICs. The number is the p-value indicating the correlation between the two types of immune cells in the figure. The color and depth of the circle in the figure represent the corresponding p-value between two types of immune cells. Use Pearson coefficient for significance test.
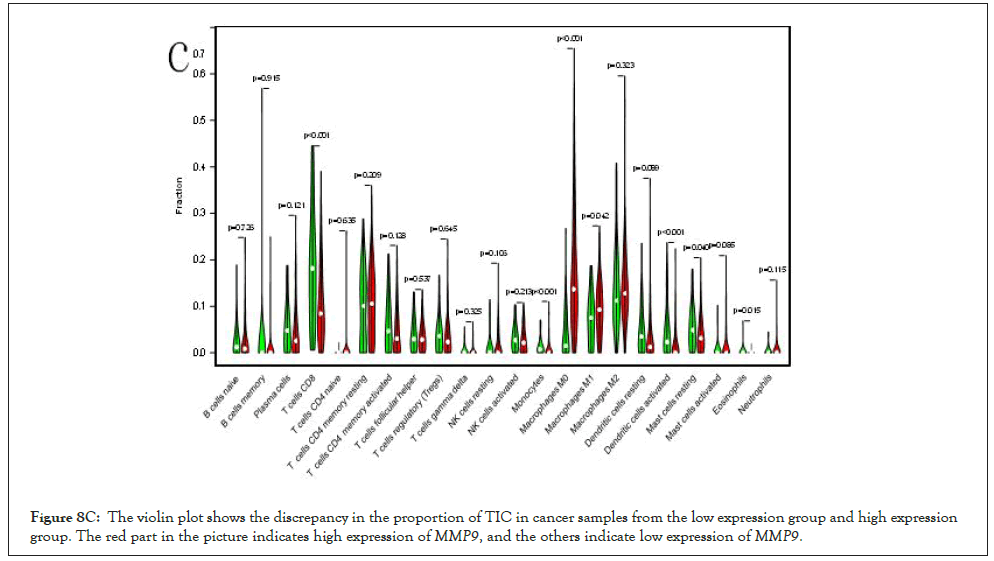
Figure 8C: The violin plot shows the discrepancy in the proportion of TIC in cancer samples from the low expression group and high expression group. The red part in the picture indicates high expression ofMMP9, and the others indicate low expression ofMMP9.
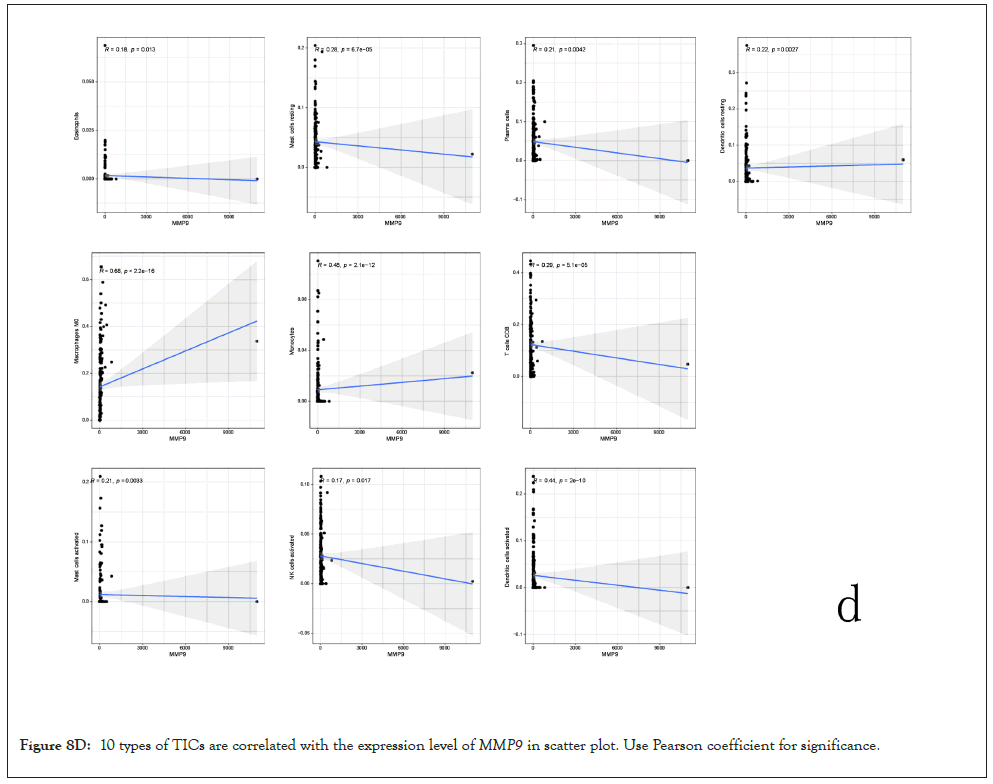
Figure 8D: 10 types of TICs are correlated with the expression level ofMMP9 in scatter plot. Use Pearson coefficient for significance.
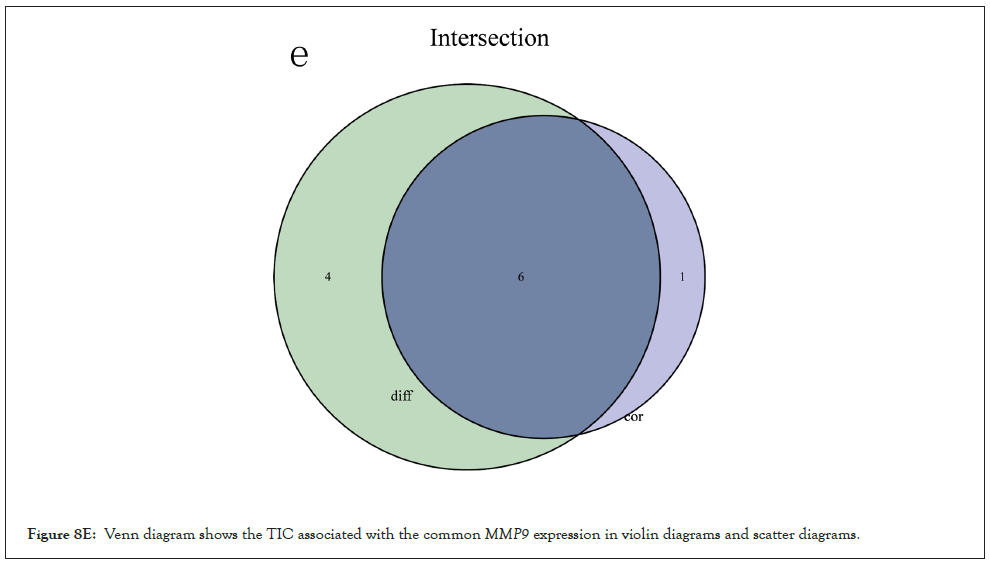
Figure 8E: Venn diagram shows the TIC associated with the commonMMP9 expression in violin diagrams and scatter diagrams.
Correlation analysis of immune checkpoint genes: We performed the correlation analysis of immune checkpoint genes through the R tool, suggesting that it is positively correlated with the expression levels of MMP9 and 36 immune check sites (Figure 9).
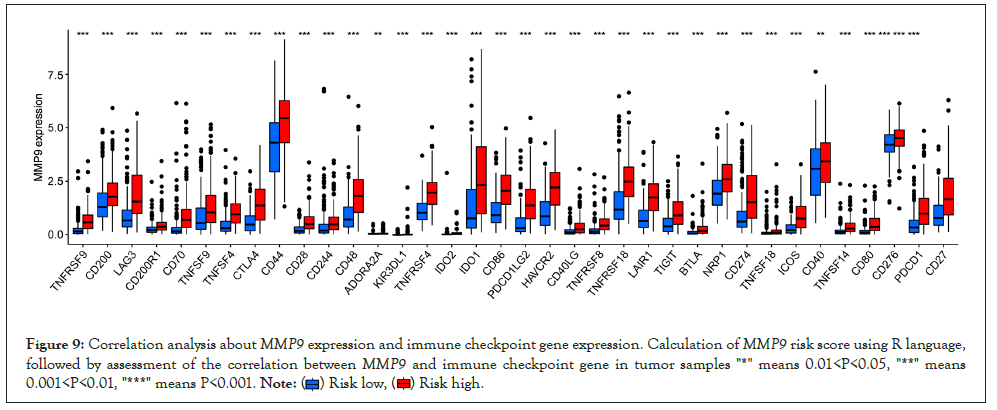
Figure 9: Correlation analysis aboutMMP9 expression and immune checkpoint gene expression. Calculation ofMMP9 risk score using R language,
followed by assessment of the correlation betweenMMP9 and immune checkpoint gene in tumor samples "*" means 0.01<P<0.05, "**" means
0.001<P<0.01, "***" means P<0.001. .
.
Current research shows that tumor microenvironment is essential to the development of cancer [3]. It is believed that the characteristics of cancer are determined the cancer cells alone, same as the stromal cells and immune cells surrounding the tumor, and the cytokines they secrete [6]. Even though the diagnostics and treatment methods advance rapidly, the prognosis of BLCA is not satisfactory. The research of BLCA on TME has received increasing attention to scholars, but there is still less research of immune response in BLCA related to immune cells and stromal cells, which are the components of TME. Therefore, it’s particularly significant to explore the function and mechanism of tumor microenvironment in BLCA, looking for effective immune prognostic markers and create new approaches for the diagnosis and therapies of BLCA. In this paper, we probed the expression profiles of BLCA case in the TCGA database, explored genes that affect the composition of tumor microenvironment in BLCA, and analyzed the relationship between genes and prognosis. We use ESTIMATE algorithm to perform stromal score and immune score on BLCA case. The stromal score was negatively correlated with lifetime of BLCA patients. The correlation analysis between the Stromal score and clinical stages indicated that the score shows an upward trend from stage II to stage III, then to stage IV, but it is no significant difference between stage I and other stages. We surmised that this result may arise from the deficiency of samples. There is no significant correlation between the immune score and the tumor stage, but the tumor stage of the two scores is significantly correlated when the two groups are compared. At the same time, we found that there is a significant correlation between the score and gender, which is consistent with the previous research that the occurrence of bladder cancer is related to gender [7]. Then we identified 262 up-regulated and 18 down-regulated DEGs based on the stromal score and immune score. The enrichment analysis of GO and KEGG indicated that DEGs are mainly relevant to the immune response process. Finally, we got the crossover gene MMP9 by constructing a protein interaction network and univariate COX regression analysis. Besides, we studied the differential expression of MMP9 between normal tissues and tumor tissues, and the results also showed significant differences. The survival analysis revealed that the expression of MMP9 was negatively correlated with the survival rate of BLCA patients. GSEA enrichment analysis revealed that high MMP9 expression was mostly enriched in CAMs and chemokine signaling pathways and so on, which are immunerelated pathways. All above showed that MMP9 is essential to the immune response of TME of BLCA.
MMPs are a zinc-dependent endopeptidase family with 24 different members of humans, and MMP9 is one of its members [8]. The main role of MMPs is to regulate the extracellular stromal by directly degrading ECM proteins (such as collagen, proteoglycan and fibronectin); and to release biologically active proteins such as cytokines, growth factors and chemokines [9]. Among them, the ability of MMP9 degrading extracellular stromal components and regulating the activity of a variety of soluble proteins is essential to the reproduction, growth, development, inflammation, vascular and proliferative diseases [10]. A number of studies have shown that MMP9 has a promoting effect on gastric cancer, colorectal cancer, lung cancer, breast cancer and pancreatic cancer [11-15]. Mehner et al. found that MMP9 promotes tumor angiogenesis and accelerates the metastasis in of breast cancer [16]. Yousef EM and others found that the expression of MMP9 is different in different subtypes of breast cancer [17]. Other studies have shown that MMP9 induces mesenchymal transformation of pancreatic cancer cells through protease-activated Receptor 1 (PAR1) activation and accelerates the development of pancreatic cancer [18]. On the other hand, MMP9 plays the role of a tumor suppressor gene in Colitis-Related Cancers (CAC) by activating the EGFR-Sp1 signaling pathway and the MMP9-Notch1-ARF-p53 axis to maintain the integrity of the epithelial mucosa. The research results are not consistent. Therefore, we speculate that MMP9 has different roles in different types of tumors. Studies have found that compared with the urine of healthy patients, the activity and total amount of MMP9 in the urine of patients with bladder cancer have increased and increased significantly in patients of highly aggressive bladder cancer [19]. It suggests that MMP9 plays a role in promoting cancer in BLCA.
In terms of immune infiltration, the expression of MMP9 has positive correlation with M0 macrophages and eosinophil’s, and inversely related with CD8 T cells, activated dendritic cells, mast cells, and monocytes. These cells participate in the immune response from various stages, further confirming the role of MMP9 in tumor TME. Correlation analysis between MMP9 and TICs shows that MMP9 can promote cancer by regulating TME of BLCA. Therefore, MMP9 inhibitors can exert anti-cancer effects by inhibiting the expression of MMP9. A variety of studies have proved that natural and synthetic MMP inhibitors (MMPIs) exert anti-cancer effects by inhibiting the cascade of MMPs [20,21]. In inflammatory and neoplastic diseases such as ulcerative colitis and colorectal cancer, selective MMP9 inhibitors can inhibit the up-regulation of MMP9 to exert a tumor suppressor effect, and MMP9 is expected to become a new anti-cancer target [22]. In addition, we also studied the correlation between the expression of MMP9 and the expression of common immune checkpoint genes to predict the effect of immunotherapy. The results showed that MMP9 is related to most of the immune examination sites of bladder cancer, including CD274, CTLA-4, NFRSF9, LAG3, HAVCR2, etc. Among them, MMP9 has a significant positive correlation with PD-1 and CTLA-4, which indicates that MMP9 may be involved in immunotherapy. A recent study showed that the small molecule MMP2/MMP9 inhibitor SB-3CT enhanced the efficacy of PD-1 or CTLA-4 blockers in the treatment of primary and metastatic tumors [23]. Although anti-PD-1 immunotherapy can improve the survival rate of patients with sensitive tumors, most advanced patients will develop resistance, and we know little about the mechanism of resistance [24]. Studies have shown that MMP-mediated proteolytic lysis may limit the immunosuppressive ability of PD-1 ligands of tumor-related cells. MMP9 can promote the ability of PD-1 response by reducing the expression of tumor PD-L1 [25]. Another study of mouse melanoma showed that the TGFβ pathway promotes the MMP9-dependent lysis of PD-L1 surface expression, leading to anti-PD-1 resistance [26]. From this we theorized that MMP9 has a great clinical significance in tumor immunotherapy. This study is based on the prediction model of MMP9 that can predict the status of immune cell infiltration in BLCA and can also be used as a novel biomarker to predict the prognosis of BLCA. But our research has limitations. We need more independent data sets and further experiments to verify our conclusions.
MMP9 plays a critical role in the tumor microenvironment of BLCA and can be used as a novel prognostic marker for BLCA. MMP9 may also be an immune prognostic gene of the TME in BLCA. Further research is needed to confirm the function of MMP9 in BLCA's TME.
Not applicable.
HL and WL constructed the idea of this research and completed the processing and visualization of the data. HL and NF completed the writing of the first draft, SZ and SC participated in the writing and revision of the first draft, and JH and JL reviewed and revised the first draft. All authors have read and agreed to the final manuscript.
Not applicable.
The datasets generated and/or analyzed during the current study are available in the Cancer Genome Atlas (TCGA) repository, https://portal.gdc.cancer.gov/
The data of the article is obtained from the public database, and no ethical approval has been applied.
Not applicable.
The authors declare that they have no competing interests.
[Crossref] [Google Scholar] [PubMed]
[Crossref] [Google Scholar] [PubMed]
[Crossref] [Google Scholar] [PubMed]
[Crossref] [Google Scholar] [PubMed]
[Crossref] [Google Scholar] [PubMed]
[Crossref] [Google Scholar] [PubMed]
[Crossref] [Google Scholar] [PubMed]
[Crossref] [Google Scholar] [PubMed]
[Crossref] [Google Scholar] [PubMed]
[Crossref] [Google Scholar] [PubMed]
[Crossref] [Google Scholar] [PubMed]
[Crossref] [Google Scholar] [PubMed]
[Crossref] [Google Scholar] [PubMed]
[Crossref] [Google Scholar] [PubMed]
[Crossref] [Google Scholar] [PubMed]
[Crossref] [Google Scholar] [PubMed]
[Crossref] [Google Scholar] [PubMed]
[Crossref] [Google Scholar] [PubMed]
[Crossref] [Google Scholar] [PubMed]
[Crossref] [Google Scholar] [PubMed]
[Crossref] [Google Scholar] [PubMed]
[Crossref] [Google Scholar] [PubMed]
[Crossref] [Google Scholar] [PubMed]
[Crossref] [Google Scholar] [PubMed]
[Crossref] [Google Scholar] [PubMed]
[Crossref] [Google Scholar] [PubMed]
Citation: Lin HS, Liu WW, Feng NZ, Zhong SZ, Chen SJ, He JW, et al. (2022) Prognostic Marker of MMP9 Related to the Immune Cell Infiltration in the Tumor Microenvironment of Bladder Cancer. Chemo Open Access. 10:160.
Received: 30-Mar-2022, Manuscript No. CMT-22-17185; Editor assigned: 01-Apr-2022, Pre QC No. CMT-22-17185 (PQ); Reviewed: 15-Apr-2022, QC No. CMT-22-17185; Revised: 22-Apr-2022, Manuscript No. CMT-22-17185 (R); Published: 30-Apr-2022 , DOI: 10.4172/2167-7700.22.10.157
Copyright: © 2022 Lin HS, et al. This is an open-access article distributed under the terms of the Creative Commons Attribution License, which permits unrestricted use, distribution, and reproduction in any medium, provided the original author and source are credited.