Journal of Proteomics & Bioinformatics
Open Access
ISSN: 0974-276X
ISSN: 0974-276X
Research - (2019)Volume 12, Issue 7
Optimization of cellulase activity is vital for synthesizing the end-products of second generation biofuel production. The slightest change in fermentation parameters can reduce the secretion of necessary enzymes to degrade cellulosic biomass. Determining the ecological effects of certain key media components is essential to understand how bacterial species will respond in a fluid environment. For our experiment a cellulosic media was designed to enhance the industrially important thermophile, Bacillus licheniformis YNP5-TSU. After several attempts to simplify the carboxymethylcellulose (CMC) media composition, impaired biofilm maturation and cellulase activity was noticed. This negative artifact occurred only when magnesium sulphate was removed from media. To analyze the shift in gene expression caused by magnesium stress, biofilm associated proteins were extracted from both control (4.0 mM MgSO4) and magnesium depleted (0.0 mM MgSO4) media at 24 hr and 48 hr incubation periods. These proteins were quantified through isobaric labeling and raw data generated from nanoLC-MS/MS identified over 2,000 proteins from the Bacillus licheniformis YNP5-TSU proteome (NCBI accession number MEDD00000000). After statistical normalization and false discovery rate were calculated, a total of 161 proteins from magnesium depleted media and 238 proteins from control media were deemed statistically relevant. A closer look through STRING interconnected webs, data mining, and NCBI annotations revealed several up/down regulated proteins that had linkage to biofilm formation and cellulase secretion. In this study we are able to provide significant evidence that; (1) biofilm maturation and cellulase production are highly correlated and (2), their optimization is dependent on the expression of several key proteins.
Biofilm proteins; Bacillus licheniformis YNP5-TSU; Proteomic sequencing; Cellulase degradation; Industrial microbiology; Magnesium stress
The genus Bacillus is highly diverse and over the past few decades has gained much attention for its implementation into second generation biofuel. Large amounts of research towards the classification of the Bacillus genome and full scale fermentation production with this organism have contributed to this trend [1]. Many species belonging to this group (B. subtilis, B. cereus, B. licheniformis, etc.) are facultative anaerobes which produce biofilms, allowing them to survive a wide range of bioreactor conditions [2]. Biofilms are intertwined exopolysaccharides (EPS) and proteins, connecting the cell to the extracellular matrix (ECM) and providing protection, connectivity and signaling to surrounding communities. The ECM is important to many industries as this is where degradation of larger polysaccharides takes place [3]. In the case of second generation biofuel, bioreactors are typically packed with pre-treated waste ligno-cellulosic biomass. This biomass is generally comprised of large plant polysaccharides which can then be degraded into free glucose for production of bio-ethanol [4]. The more cost effective method, consolidated bio-processing (CBP), allows this biomass to be directly converted into bio-ethanol without the need to separate the mixture (biomass, glucose, and ethanol) into various other bioreactors [5]. One of the less studied species, Bacillus licheniformis, has potential in CBP as it can secrete a multitude of cellulolytic enzymes effectively and consistently [6]. Optimized utilization of biomass feedstock by Bacillus licheniformis is critical for profitability [7] and can be improved upon through modeling of cellulosic media [8]. By tailoring the composition of the cellulosic media through the addition or removal of trace minerals, cellulase activity from specific Bacillus species can be boosted. One of the most important, magnesium (Mg2+) can dramatically influence growth and metabolism of cells during cell culture and fermentation [9]. For this study a defined cellulosic media was created to identify the effected proteins of magnesium stress on cellulase activity of Bacillus licheniformis YNP5-TSU. This thermophilic isolate was recently identified from Whiterock Springs (44.7803, -110.6981) inside Yellowstone National Park (#YELL-2015-SCI-6074). The YNP5-TSU genome was sequenced using Illumina Hi-seq 3000 150 bp paired end reads and through annotation (NCBI Prokaryotic Genome Annotation Pipeline ver. 4.4) is predicted to express over 30 various cellulolytic enzymes: xylanase, endoglucanase, exoglucanase, cellobiase, and arabinase [10]. This species also reaches maximum growth capabilities at 60°C [10], allowing for implantation into open-fermentation and making it an ideal candidate for cellulolytic magnesium stress CBP modeling. The proteo-genomic data collected from this study is highly significant and displays the role of magnesium sulfate in biofilm and cellulase production. By eliminating the addition of magnesium sulfate in broth media the proteomic expressional shift of B. licheniformis YNP-TSU can be seen. This is useful for bio-fermentation industry applications where biofilm is a nuisance or must be controlled for end-product formation. Gene knockouts and cloning techniques can also be designed around the results from this study to manipulate the B. licheniformis genome and create an industry specific “super cellulosic bug”.
Composition of cellulosic media and growth curve formulation
With carboxymethylcellulose (CMC) as a carbon source, YNP5 broth media was comprised of 1.0% M9 minimal salts (Sigma- Aldrich, CA, USA), 1.0% casamino acids (Sigma-Aldrich, CA, USA), and 1.0% CMC (Acros Organics, NJ, USA). Magnesium sulfate (MgSO4) was added into control YNP5 broth at a 4.0 mM concentration (0.05%) [11]. To stimulate magnesium stress, no magnesium sulfate was added to experimental YNP5 broth media. Growth curves were constructed using a SpectraMax® M5 microplate reader (Molecular Probes®) with clear flat bottom 96- well plates. An initial inoculum of OD600 = 0.4, obtained through (1:100) serial dilution from overnight growth in LB-CMC culture, was pipetted into 96-well plates (200 μLs) and incubated at 45°C. (OD600 was recorded every 15 min for 18 hrs) [11].
Biofilm maturation and cellulase assays
Biofilm maturation was calculated using the microtiter dish biofilm formation assay as performed by O’Toole [12]. Triplicates of a 1:100 dilution from overnight culture of both YNP5 CMC and YNP5 CMC-noMg broth were inoculated into 96-well plates of corresponding fresh broth media. Each well (contained 125 μls) was allowed to incubate at 45°C for 24 hrs. After this, remaining liquid from each well was removed and 125 μls of 0.1% crystal violet was added and incubated for 10 min at room temperature. Crystal violet was removed and a 30% solution of acetic acid was added for an additional 10 min. This solution was extracted and quantified at 550 nm using a SpectraMax® M5 microplate spectrophotometer (Molecular Probes, OR, USA). Cellulase activity of Bacillus licheniformis YNP5-TSU was measured using treated and non-treat YNP5 MgSO4 media by modified DNS assay, performed by Ghose [13]. For each DNS assay overnight cultures were centrifuged at 13,000 g for 10 min and extracted supernatant was used as crude enzyme solution [5]. For quantification of cellulase activity 0.5 mls of crude extract was added to 0.5 mls of substrate (2% CMC) in a 7.0 pH phosphate buffer and incubated at 50°C for 30 min (in triplicates). Dinitrosalicylic acid (DNS) was then added in 1 ml aliquots and reaction was boiled at 95°C for exactly 5 min. Colorimetric change was measured at 540 nm in SpectraMax® M5 microplate reader.
Extraction of biofilm associated proteins
Single colonies of Bacillus licheniformis YNP5-TSU were incubated in both YNP5 CMC control broth (.05% MgSO4) and YNP5 CMC experimental broth (no MgSO4) for 24 hrs and 48 hrs (in triplicate) at 45°C in Erlenmeyer baffled 250 ml flasks at 50rpm in a New Brunswick Scientific™ I 24 rotary shaker. After 24 hrs and 48 hrs top biofilm layer from each flask was removed and grounded into a dry powder with mortar and pestle after addition of liquid nitrogen [14]. Then, 1.0 g of this powdered sample was transferred into a phenol (pH 8.0) and dense sodium dodecyl sulfate (SDS) buffer (30% sucrose, 2% SDS, 5% β-mercaptoethanol (v/w) in 0.1 M Tris-HCl, pH 8.0) [15]. Following incubation at 4°C for 2 hrs, solution was centrifuged at 16,000 g at 4°C for 15 min. The upper phenol phase was transferred to 0.1 M ammonium acetate in methanol overnight at −20°C. The next day sample was centrifuged again at 16,000 g for 15 min at 4°C. The pellet was collect and again, added to 500 μl methanol where upon a second centrifugation was air-dried and suspended in 30 μls of a 500 mM triethylammonium bicarbonate (TEAB) buffer. To quantify and the amount of extracted biofilm protein from each sample, a Qubit® 3.0 Fluorometer (Thermo Fisher Scientific, CA, USA) was used. Samples were standardized so each contained 600 μg/mL; replicates with a higher concentration were diluted with 500 mM TEAB buffer accordingly. To visualize uniform concentrations, protein band intensity was observed by loading 10 μg of sample onto precast Criterio TGX 10% polyacrylamide gels (Bio-Rad, CA, USA).
Isobaric labeling of proteins and quantification through nanoLC-MS/MS
Following the TMT10plex Mass Tag Labeling Protocol (Thermo Scientific, CA, USA), 100 μg from each sample (in triplicate) was transferred into a new tube and adjusted to a final volume of 100 μL with 100 mM TEAB. Proteins were reduced with 200 mM TCEP at 55°C for 1 hour followed by alkylation with 5 μL idoacetamide for 30 minutes. Cold acetone precipitant from overnight (pre-chilled, -20°C, 6x volume) was centrifuged at 8000 × g (4°C) for 10 minutes. Resuspended proteins were digested with trypsin, (2.5 μg per 100 μg protein) supplied with TMT10plex Mass Tag Labeling Kit #90110, overnight at 37°C (Thermo Scientific, CA, USA). Cells incubated in YNP broth media with 4 mM MgSO4 were labeled with tags 24 hrs (127C, 128N, 126) and 48 hrs (130C, 128C, 129N) and cells incubated in YNP5 broth media with no MgSO4 were labeled with tags 24 hrs (128C, 130N, and 127N) and 48 hrs (131, 127C, 129C). Protein samples labeled from 4.0 mM MgSO4 and 0.0 mM MgSO4 were pooled into separate tubes, and Oasis MCX cartridge was used to remove SDS and nonionic solvents following the manufacturer’s instructions (Waters; Milford, MA, USA). Peptides were eluted in 75% acetonitrile (CAN)/10% NH4OH and dried at reduced pressure using a CentiVac Concentrator (labConco, Kansas City, MO, USA). Prior to reconstitution for analysis by mass spectrometry, the samples were re-suspended in 100 μl DI water and re-dried. From samples, hpRP chromatography was carried out using a Dionex UltiMate 3000 HPLC system with micro fraction collection and UV detection (Sunnyvale, CA) reported previously by Yang and colleagues [16]. During this process TMT 10-plex tagged tryptic peptides were reconstituted in buffer A (20 mM ammonium formate pH 9.5 in water), and loaded onto an XTerra MS C18 column (3.5 μm, 2.1 × 150 mm) from Waters, (Milford, MA) with 20 mM ammonium formate (NH4FA), pH 9.5 as buffer A and 80% acetonitrile (ACN)/20% 20 mM NH4FA as buffer B. The LC was performed using a gradient from 10-45% of buffer B in 30 minutes at a flow rate 200 μL/ min. Forty-eight fractions were collected at 1 minute intervals and pooled into a total of 12 fractions based on the UV absorbance at 214 nm and with multiple fraction concatenation strategy [17]. All of the fractions were dried and reconstituted in 100 μL of 2% ACN/0.5% formate (FA) for nanoLC-MS/MS analysis. NanoLCMS/ MS analysis was carried out at the Functional & Comparative Proteomics Center, USDA-ARS, Cornell University, Ithaca, NY, using an Orbitrap Fusion (Thermo-Fisher Scientific, San Jose, CA) mass spectrometer equipped with nano ion source using high energy collision dissociation (HCD) similar to previous reports [18]. The Orbitrap is coupled with the UltiMate3000 RSLCnano (Dionex, Sunnyvale, CA). Each reconstituted fraction (8 μL) was injected onto a PepMap C-18 RP nano trap column (3 μm, 75 μm × 20 mm, Dionex) with nanoViper Fittings at 20 μL/min flow rate for on-line desalting and then separated on a PepMap C-18 RP nano column (3 μm, 75 μm × 15 cm), and eluted in a 120 min gradient of 5% to 38%\ACN in 0.1% formic acid at 300 nL/min., followed by a 7-min ramping to 95% ACN-0.1% FA and a 7-min hold at 95% ACN-0.1% FA. The column was re-equilibrated with 2% ACN-0.1% FA for 20 min prior to the next run. The Orbitrap Fusion is operated in positive ion mode with nano spray voltage set at 1.6 kV and source temperature at 275°C. External calibration for FT, IT and quadrupole mass analyzers was performed. An internal calibration was performed using the background polysiloxane ion signal at m/z 445.120025 as the celebrant. The instrument was operated in data-dependent acquisition (DDA) mode using FT mass analyzer for one survey MS scan for selecting precursor ions followed by Top 3 second data-dependent HCD-MS/MS scans for precursor peptides with 2-7 charged ions above a threshold ion count of 10,000 with normalized collision energy of 37.5%. MS survey scans at a resolving power of 120,000 (fwhm at m/z 200), for the mass range of m/z 400-1600 with AGC =3e5 and Max IT = 50 ms, and MS/MS scans at 50,000 resolution with AGC=1e5, Max IT = 120ms and with Q isolation window (m/z) at 1.6 for the mass range m/z 105-2000. Dynamic exclusion parameters were set at 1 within 50s exclusion duration with ±10 ppm exclusion mass width. All data was acquired under Xcalibur 3.0 operation software and Orbitrap Fusion Tune 2.0 (Thermo-Fisher Scientific).
Data processing and quantification of identified proteins
All MS and MS/MS raw spectra from TMT10-plex experiments were processed and database searched using the Sequest HT software within the Proteome Discoverer 2.1 (PD 2.1, Thermo). The database used was B. licheniformis YNP5-TSU protein fasta_ OHAIR_protein database (4522 sequences) generated from annotated (NCBI Prokaryotic Genome Annotation Pipeline ver. 4.4) Hi-seq 3000 150 bp paired end read sequencing. The default search settings used for 10-plex TMT quantitative processing and protein identification in PD 2.1 searching software were: two miscleavages for full trypsin with fixed Carbamidomethyl of cysteine, fixed 10-plex TMT modifications on lysine and N-terminal amines and variable modifications of methionine oxidation and deamidation on asparagine and glutamine residues. Only peptide spectra containing all reporter ions were designated as “quantifiable spectra” and used for peptide/protein quantitation. The abundance of reporter ions was log2-transformed. Transformed abundances with at least 2 unique peptides were fit to a normalized curve (p<0.01) following a t-test and false discovery rate (FDR) analysis [19]. All protein abundance ratios with a p-value ≤ 0.05 and in the statistical range ≥2σ (CI=95%) were considered significant. To calculate fold change the antilog of log2 transformed abundances was used. All statistical analysis was completed using SAS software (version 9.3; SAS Institute, Cary, NC, USA) [20]. All collected data was done in triplicates from replicated independent samples of YNP5 CMC media and YNP5 CMC noMg media.
Cellulolytic and biofilm associated protein pathway functionality
The Bacillus licheniformis YNP5-TSU protein fasta_OHAIR_protein database was used to identify all peptide sequences and subsequent proteins. In order to provide evidence linking up/downregulated significant biofilm-cellulase associated proteins, the STRING consortium was used [21]. STRING was used to show relationships of significant protein co-occurrence, text-mining, co-expression and protein homology. From this data a deeper search on each identified cellulase or biofilm protein was done using KEGG (gene function) [22], Uniprot (biosynthesis pathway information) [23], and RefSeq (protein product information) [24].
Proteomic accession number
The mass spectrometry proteomics data has been deposited to the ProteomeXchange Consortium (http://www.proteomexchange.org/) via PRIDE partner repository with the dataset identifier PXD009275".
Effects of magnesium on biofilm formation and cellulase activity
YNP5 CMC media was chosen for this experiment based on simplicity (minimal interference with LC-MS/MS) and optimal cellulase activity which was tested against other cellulose based nutrient media (not shown). When MgSO4 was removed from YNP5 CMC media (Figure 1A) lack of an air-interface biofilm was noticed after 48 hrs at 45°C. Cellular growth (Figure 1) was also diminished as apparent by the decreased logarithmic growth phase (orange line) when compared with media containing MgSO4 (green line). Biofilm density, measured using the biofilm maturation assay (Figure 2), was also significantly affected by the lack of MgSO4 in media. A cell absorbance reading at 550nm provided a value of 0.736, reduced from 2.532 when compared to control media. Cellulase activity (IU/ml), defined as the amount of enzyme required liberating 1 μmol of glucose per minute, declined in conjunction with decreased biofilm formation and was confirmed by DNS assay. Extracted crude enzyme from B. licheniformis 117YNP5-TSU averaged 0.042 IU/ml but when magnesium was removed enzyme activity decreased 4 fold to 0.0165 IU/ml on average (Figure 3).
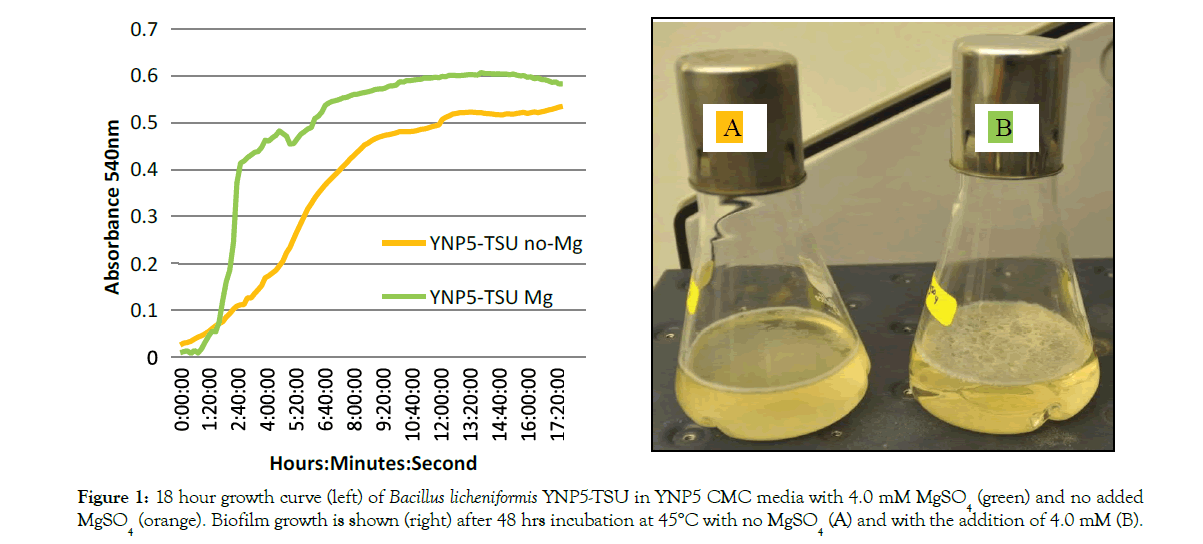
Figure 1: 18 hour growth curve (left) of Bacillus licheniformis YNP5-TSU in YNP5 CMC media with 4.0 mM MgSO4 (green) and no added MgSO4 (orange). Biofilm growth is shown (right) after 48 hrs incubation at 45°C with no MgSO4 (A) and with the addition of 4.0 mM (B).
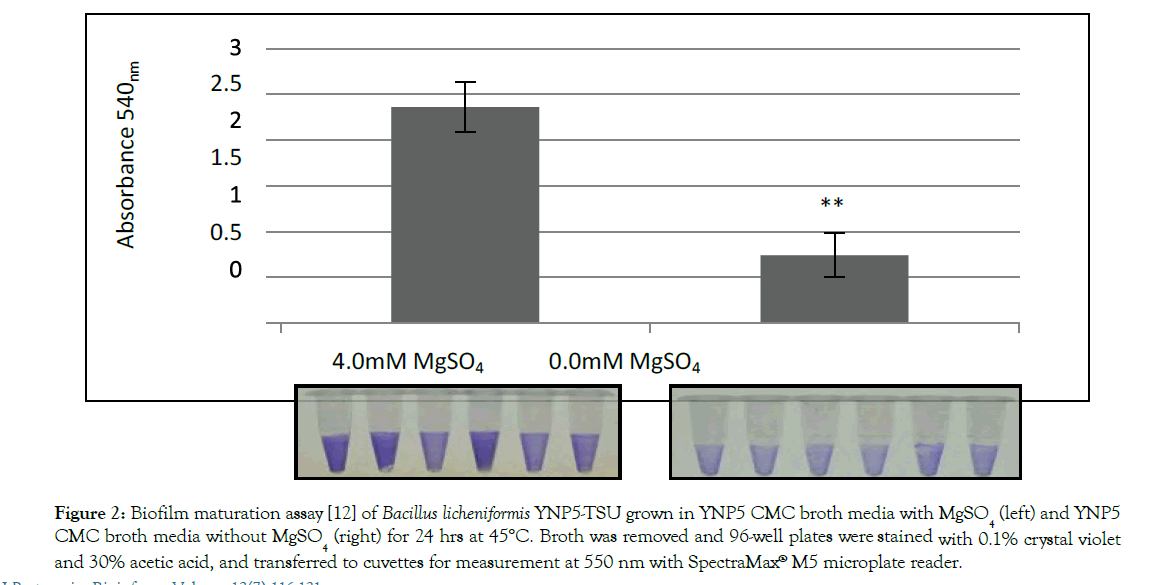
Figure 2: Biofilm maturation assay [12] of Bacillus licheniformis YNP5-TSU grown in YNP5 CMC broth media with MgSO4 (left) and YNP5 CMC broth media without MgSO4 (right) for 24 hrs at 45°C. Broth was removed and 96-well plates were stained with 0.1% crystal violet and 30% acetic acid, and transferred to cuvettes for measurement at 550 nm with SpectraMax® M5 microplate reader.
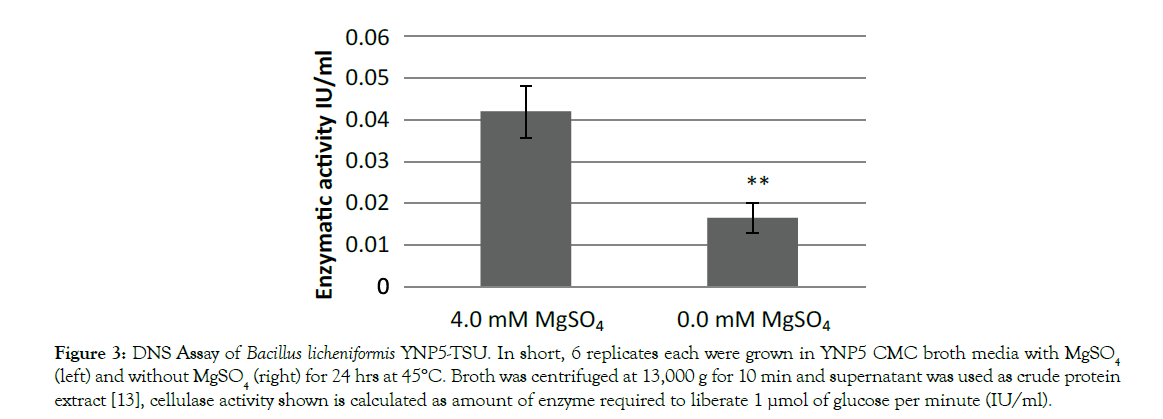
Figure 3: DNS Assay of Bacillus licheniformis YNP5-TSU. In short, 6 replicates each were grown in YNP5 CMC broth media with MgSO4 (left) and without MgSO4 (right) for 24 hrs at 45°C. Broth was centrifuged at 13,000 g for 10 min and supernatant was used as crude protein extract [13], cellulase activity shown is calculated as amount of enzyme required to liberate 1 µmol of glucose per minute (IU/ml).
Effects of magnesium on B. licheniformis proteome
The protein expression pattern of both media was analyzed using nanoLC-MS/MS and database searching of reporter ion abundances using Bacillus licheniformis YNP5-TSU protein fasta_OHAIR_protein database (4522 sequences). A total of 2,291 proteins from Bacillus licheniformis YNP5-TSU in YNP5 CMC media lacking MgSO4, and 2,191 from Bacillus licheniformis YNP5-TSU in YNP5 CMC with 4.0 mM MgSO4 were identified. These totals were reduced to 1,759 proteins (4.0 mM MgSO4) (Figure 4) and 1,929 proteins (no MgSO4 media) (Figure 5) when a minimum of 2 peptides were required for confirmation. For each control media (4.0 mM MgSO4) and treatment media (0.0 mM MgSO4) 2 peptide abundant proteins were normally distributed using SAS software (version 9.3) yielding a mean/standard deviation (μ=-0.17669, σ = 0.625627) (Figure 4) and (μ=0.000285, σ=0.405972) (Figure 5) respectively. A total of 161 proteins from media lacking MgSO4 and 238 proteins from media with MgSO4 were deemed statistically significant proteins with a p≤0.05 and a standard deviation 1.5σ or greater (highlighted areas) following the 95% CI statistic benchmark (Figures 4 and 5). Of the 161 statistically relevant proteins identified after 24 hrs and 48 hrs from media lacking MgSO4, only 10 were downregulated while the rest (151) were upregulated proteins (Figure 6). Under MgSO4 concentrations of 4.0 mM the proteome shifted, and 117 downregulated and 121 upregulated proteins were detected (Figure 7). The greatest change between none-Mg (Figure 6) and Mg media (Figure 7) protein expression profiles were from translational (4 proteins), transcriptional (9 proteins), sporulation (6), not classified (24), and enzyme (20) families after classification using a manual search in uniport [23].
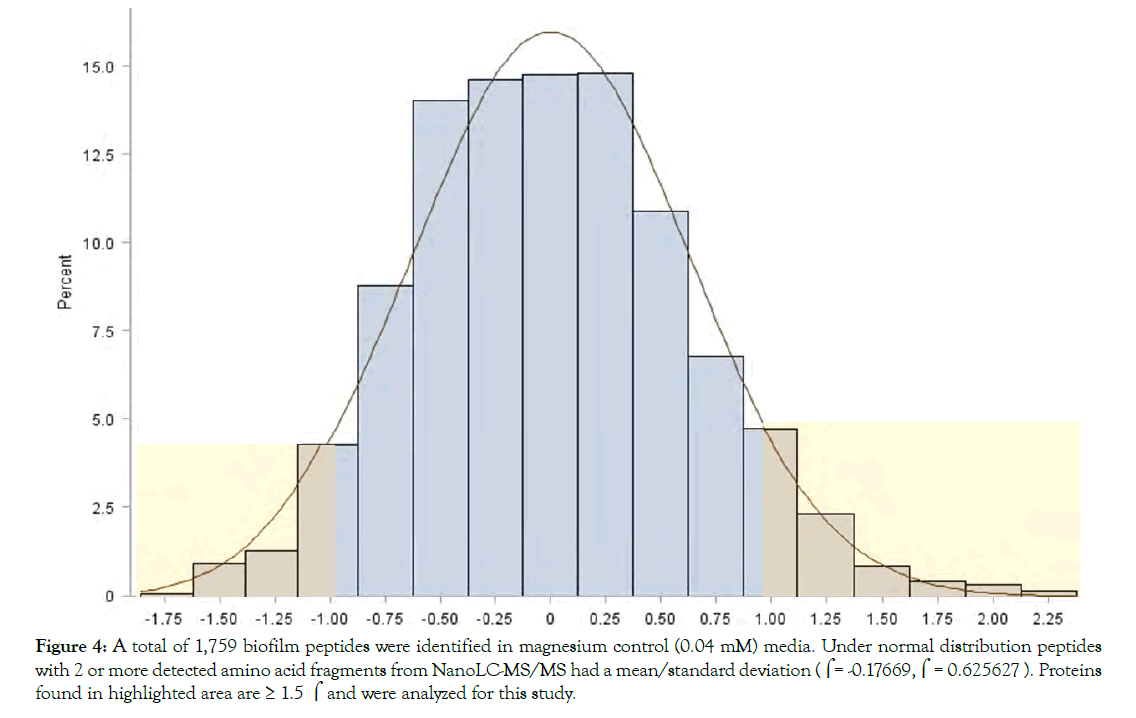
Figure 4: A total of 1,759 biofilm peptides were identified in magnesium control (0.04 mM) media. Under normal distribution peptides with 2 or more detected amino acid fragments from NanoLC-MS/MS had a mean/standard deviation ((= -0.17669,( = 0.625627 ). Proteins found in highlighted area are = 1.5 ( and were analyzed for this study.
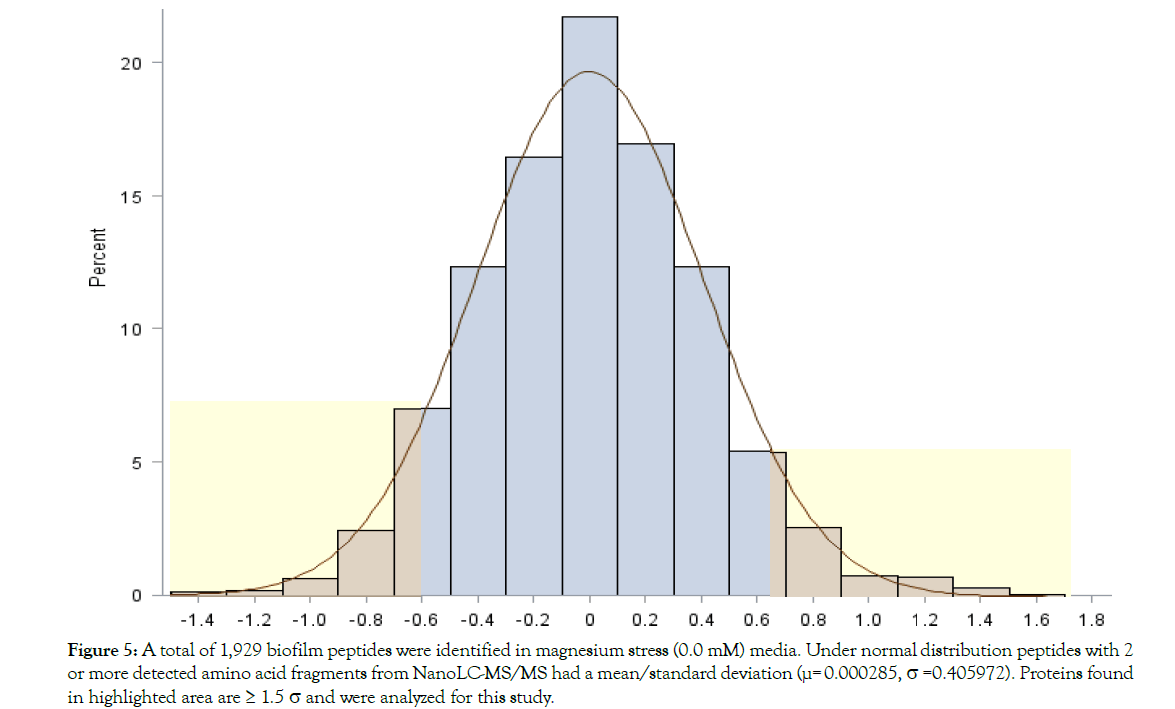
Figure 5: A total of 1,929 biofilm peptides were identified in magnesium stress (0.0 mM) media. Under normal distribution peptides with 2 or more detected amino acid fragments from NanoLC-MS/MS had a mean/standard deviation (µ= 0.000285, s =0.405972). Proteins found in highlighted area are = 1.5 s and were analyzed for this study.
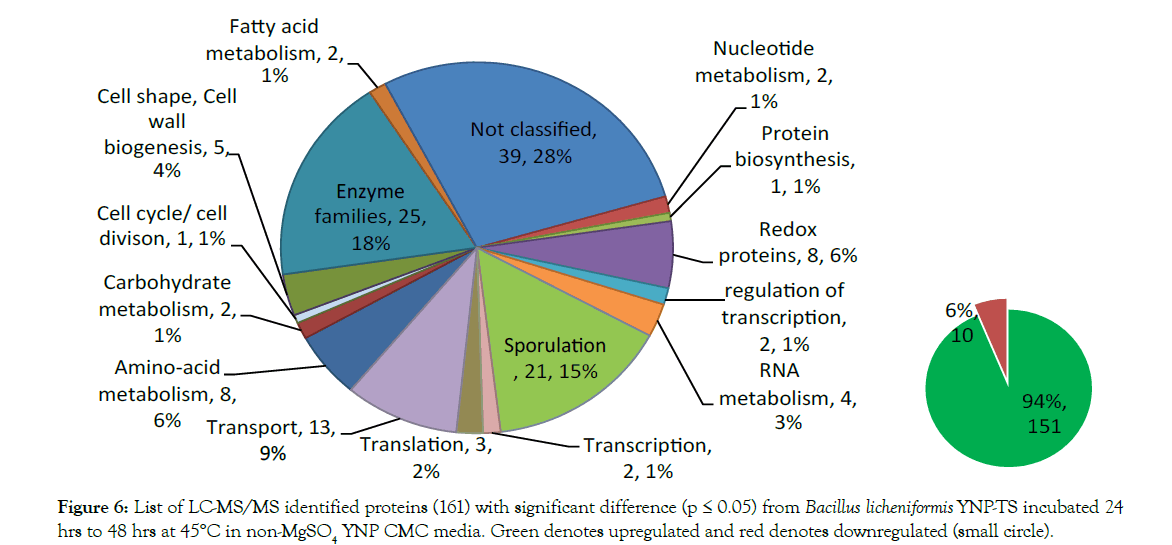
Figure 6: List of LC-MS/MS identified proteins (161) with significant difference (p = 0.05) from Bacillus licheniformis YNP-TS incubated 24 hrs to 48 hrs at 45°C in non-MgSO4 YNP CMC media. Green denotes upregulated and red denotes downregulated (small circle).
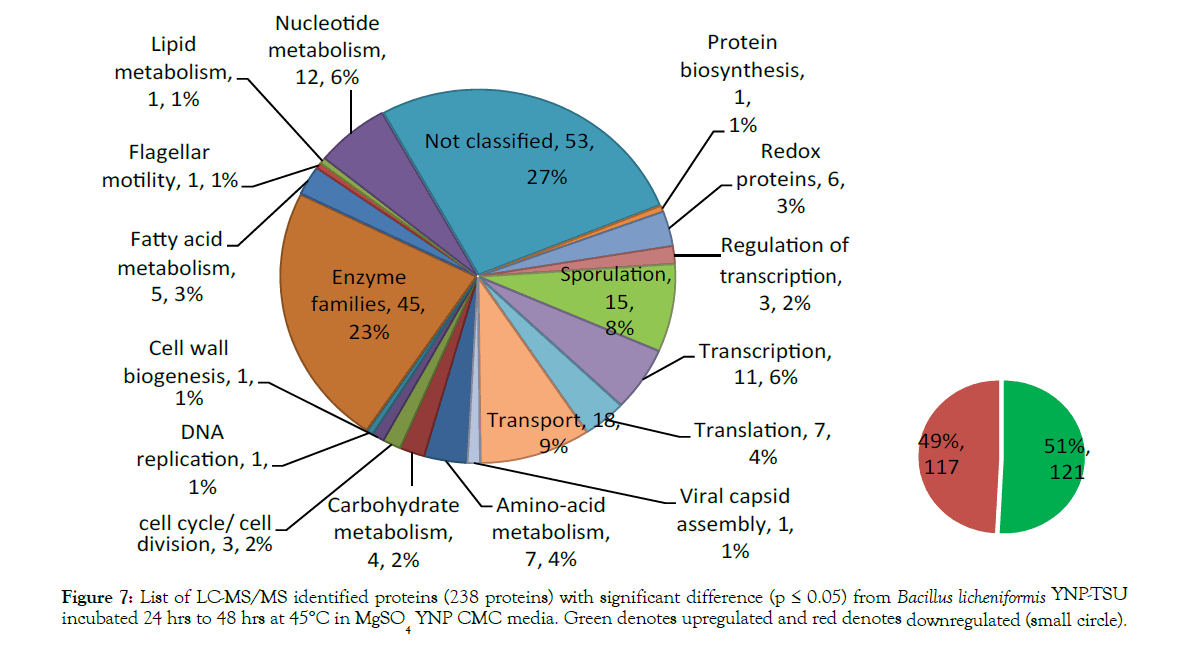
Figure 7: List of LC-MS/MS identified proteins (238 proteins) with significant difference (p = 0.05) from Bacillus licheniformis YNP-TSU incubated 24 hrs to 48 hrs at 45°C in MgSO4 YNP CMC media. Green denotes upregulated and red denotes downregulated (small circle).
Data mining of biofilm expressed proteins detected in magnesium stress and magnesium control media
When comparing the proteomic expressions of the control sample (4.0 mM MgSO4) and magnesium stress media (0.0 mM MgSO4), several individual proteins showed a large fold change with linkage to biofilm, cellulase activity, or cell growth. In Figure 8, an intertwine web of proteins were dependent on metabolically relevant OJT64701. Using the STRING consortium, through experimentally proven linkages, OJT64701 was annotated as a subunit of glutamate synthase when cross-referenced with Bacillus licheniformis ATCC 14580. Upregulated 2.45 fold and expressed only in media with magnesium, OJT64701 had significant impact on protein expression. OJT64701 is linked to several Bacillus licheniformis ATCC 14580 proteins with a medium confidence (0.40) and includes; transcriptional regulators araR (arabinose operon), spoIIID (sigma factor for DNA transcription/sporulation), and rbsR (ribose operon) [22]. It also shares expressional evidence with glutamate synthesis (gltB) and thioredoxin (trxA) the latter providing reducing power to the cell via NADPH/NADH [25]. OJT65048, a NCBI annotated sporulation protein only expressed in media with MgSO4 and upregulated 3.04 fold and shown to function as a glycoside hydrolase family protein transcribed by the gene ydhD [26]. Glycoside hydrolases such as these catalyze the endo-hydrolysis of (1→4)-β-D-glucosidic linkage to form cellodextrin from cellulose, a common exopolysaccharide in biofilm [27]. Absent from the biofilm expressed proteome of media lacking MgSO4, this protein also shares responsibility to correct biofilm maturation. Another upregulated protein found in both control (2.62 fold) and experiment (1.94 fold) was OJT63420. This protein is extremely important in creating a hydrophobic biofilm cap, which allows the pellicle to float on-top of air-water interfaces [28]. Without expression of this protein biofilms would sink thus altering structure and function of attached cells. Indicating a healthy cycle of both growth and decline in cell numbers was competence protein OJT6404 (comM). As a post-transcriptional regulator this protein helps activate, along with comK, natural competency which is triggered by an increase in cell density [29,30]. Expression of OJT64043 was isolated after 48 hrs only in MgSO4 CMC media. In magnesium stress media (0.0 mM MgSO4), expression pattern was much different from 24 hr to 48 hrs. Many upregulated proteins were connected with OJT63171, annotated as sporulation and transcriptional regulator gene spoIIID [31]. Along with the high fold increase of OJT63171 (2.19), five other spore coat proteins; OJT62218 (2.51), OJT62095 (2.39), OJT64642 (2.33), OJT62097 (2.20), OJT62306 (1.87) were identified (only in magnesium stress media). The cell signaling under a magnesium depleted environment upregulates these key proteins with expression focused more on sporulation and survival rather than cellulase production and biofilm attachment. This proteome shift is also supported by the upregulation (1.60 fold) of OJT63928, a carbon starvation protein cstA. In nutrient depleted environments starvation can have a negative impact on biofilm by triggering a cascade of effects to signal cellular detachment [32].
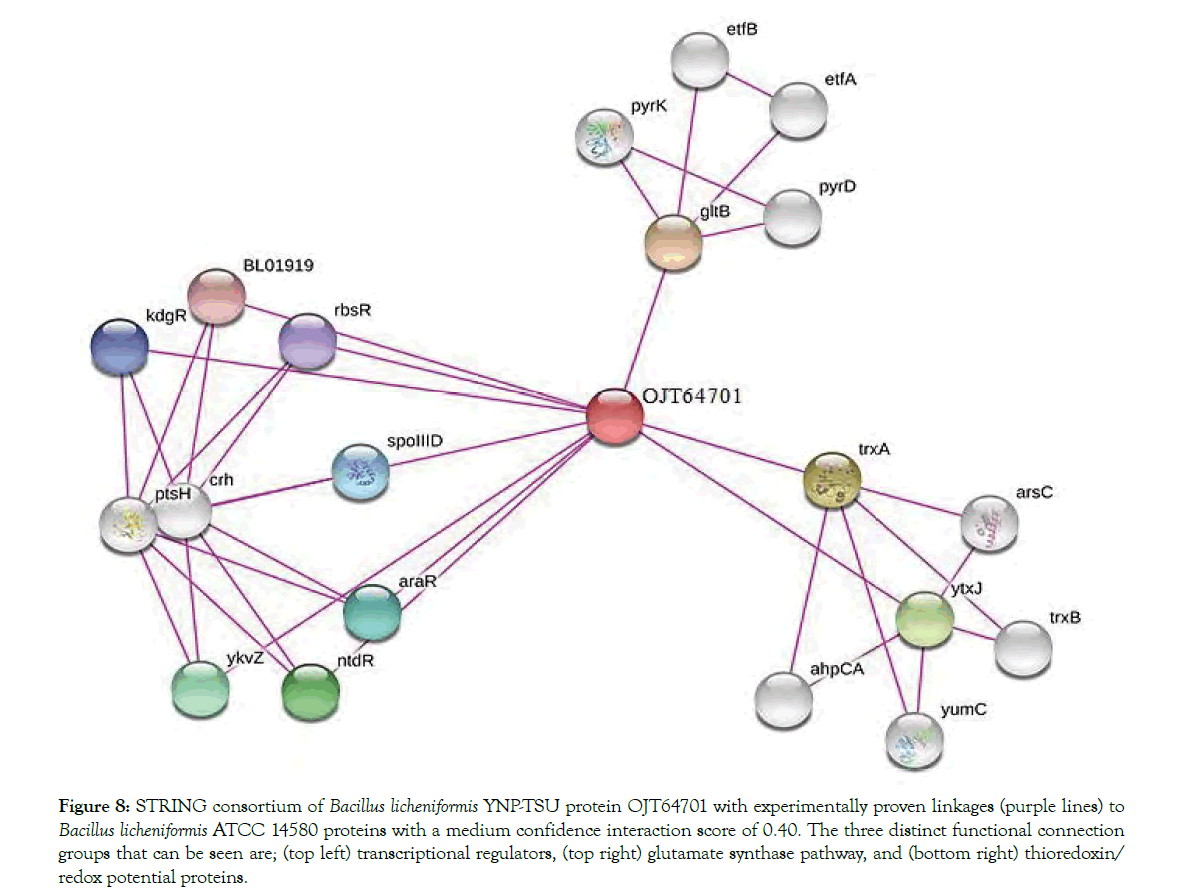
Figure 8: STRING consortium of Bacillus licheniformis YNP-TSU protein OJT64701 with experimentally proven linkages (purple lines) to Bacillus licheniformis ATCC 14580 proteins with a medium confidence interaction score of 0.40. The three distinct functional connection groups that can be seen are; (top left) transcriptional regulators, (top right) glutamate synthase pathway, and (bottom right) thioredoxin/ redox potential proteins.
Contributing to a decrease in cellulase activity (Figure 3) was the downregulation of OJT64348 or celA, an important part of the phosphotransferase system (PTS) specifically the cellobiose-specific component IIB. The expression of this protein was decreased by half in MgSO4 stress media pointing towards a downregulation of cellulolytic carbohydrates into the cell [33].
One of the most influential proteins from this study was OJT64158. Expressed only in media with MgSO4, OJT64158 was upregulated 3.24 fold and fell above 2σ under normal distribution. OJT64158 was only annotated as a hypothetical protein through NCBI prokaryote database, but upon KEGG [22] and Uniprot [23] literature and sequence analysis it was shown to be a novel collagen-like protein (CLP). CLPs are long chain proteins with the repeating amino acid sequence (Glycine-X-Y) and required for biofilm formation and adhesion [34]. In a study conducted by Zhao et al., Bacillus species; B. cereus, B. licheniformis, B. anthracis, and B. amyloliquefaciens CLP gene mutagenesis resulted in colonies that were isolated from one another suggesting that CLPs are attached to the cell surface and play an important role in cell auto-aggregation and cell adhesion to biofilms [34].
Relevance of magnesium for biofilm and other cellular functions
Without the proper cell signaling this reduction in biofilm connectivity can greatly impact the cellulase production via upregulation of survival pathways. Magnesium stress, can affect many protein expression pathways related to biofilm and subsequent cellulose degradation via alternative carbohydrate utilization. While our study was focused on the effects of low magnesium stress, other studies have been able to show the same is true for environments with high (50 mM) MgSO4 concentrations as well [35]. Oknin et al. were able to show that Mg2+ ions are specific to inhibition of biofilm formation, which depends on the maturation of the extracellular matrix. This is controlled by the epsA-O and tapA operons, and linked to the gene expression of β-galactosidase [35,36]; a connection between biofilm and cellulase production. Mg2+ ions play a key role in the growth and metabolic functions of bacteria.
The manipulation of extracellular and intracellular magnesium can alter the efficiency of microbial substrate conversion and can be detrimental in optimizing cellulase for bio-ethanol production. Proteins identified from this study can also significantly impact current techniques to minimize biofilm formation on various other plastics or metal surfaces. Through similar studies the field of proteomics has an immeasurable opportunity for advancing the microbial fermentation industry. A closer look through STRING interconnected webs, data mining, and NCBI annotations revealed several up/down regulated proteins that had linkage to biofilm formation and cellulase secretion. In this study we are able to provide significant evidence that; (1) biofilm maturation and cellulase production are highly correlated and (2), their optimization is dependent on the expression of several key proteins.
"The mass spectrometry proteomics data have been deposited to the ProteomeXchange Consortium via the PRIDE partner repository with the dataset identifier PXD009275". We would like to thank the Yellowstone National Park Service for access and collection of specimens from hydrothermal areas under permit# YELL-2015-SCI-6074 and YELL-2017-SCI-6074. Stacey Gunther, Sarah Haas, and Annie Carlson were invaluable for their help in permit coordination and field sampling guidance at Yellowstone National Park. We also thank Tennessee State University for their facilities and graduate student support. Funding was provided by 1890 Institution Teaching, Research and Extension Capacity Building Grants (CBG) Program, Award No. 2018-38821-27737, 2014-02868, and the Evans-Allen Research Funds for USDANIFA and the ARS CRIS Projects 1907-21000-036/037-00D. ARS disclaimer: “Mention of trade names or commercial products in this publication is solely for the purpose of providing specific information and does not imply recommendation or endorsement by the U.S. Department of Agriculture.”
The authors declare that they have no conflict of interest.
Citation: O’Hair JA, Li H, Rangu M, Thapa S, Yong Y, Fish T, et al. (2019) Proteomic Effects of Magnesium Stress on Biofilm Associated Proteins Isolated from Cellulolytic Bacillus licheniformis YNP5-TSU. J Proteomics Bioinform 12:7. doi: 10.35248/0974-276X.19.12.504
Received: 05-Nov-2019 Accepted: 22-Nov-2019 Published: 29-Nov-2019 , DOI: 10.35248/0974-276X.19.12.504
Copyright: © 2019 O’Hair JA, et al. This is an open-access article distributed under the terms of the Creative Commons Attribution License, which permits unrestricted use, distribution, and reproduction in any medium, provided the original author and source are credited.