Journal of Physical Chemistry & Biophysics
Open Access
ISSN: 2161-0398
ISSN: 2161-0398
Research Article - (2017) Volume 7, Issue 2
A quantitative structure-property relationship (QSPR) study was performed to predict the melting points of 60 carbocyclic nitroaromatic compounds using the electronic and topologic descriptors computed respectively, with ACD/ ChemSketch and Gaussian 03W programs. The structures of all 60 compounds were optimized using the hybrid density functional theory (DFT) at the B3LYP/6-31G(d) level of theory. In both approaches, 50 compounds were assigned as the training set and the rest as the test set. These compounds were analyzed by the principal components analysis (PCA) method, a descendant multiple linear regression (MLR) analyses and an artificial neural network (ANN). The robustness of the obtained models was assessed by leave-many-out cross-validation, and external validation through test set. This study shows that the PCA and MLR have served also to predict melting point and some other physicochemical properties, but when compared with the results given by the ANN (R=0.997), we realized that the predictions fulfilled by this latter were more effective and much better than other models.
<Keywords: DFT; QSPR; Energetic compounds; Melting point; Artificial neural network; Cross validation
Energetic materials contain metastable compounds, for many of which the experimental thermophysical property data have not been published yet. Due to their expensive and often hazardous synthesis, testing, and fielding, elimination of a poor candidate before investing in synthesis and testing is of great value [1]. Furthermore, the safety for the scientists and engineers who work with them should be considered.
The relationship between the molecular structures of energetic compounds and their various properties such as performance, sensitivity, physical and thermodynamic properties is very important [2-4]. For new energetic compounds, the calculated properties can help to decide whether it is worth attempting a new and complex synthesis [5]. Recently a number of methods have been introduced to predict the thermochemical properties of different classes of energetic compounds, such as heat of sublimation [6-8], impact sensitivity [9-12], heat of formation [13-17], and detonation temperature [16,18].
Prediction of the melting point (Mp) of energetic compounds has become an important subject because melting point is one of the fundamental physical properties used in chemical identification and purification as well as in the calculation of other physicochemical properties such as vapor pressure and aqueous solubility.
One approach for the calculation of melting point of energetic compounds was developed special attention has been paid on the evaluation of melting point because large numbers of experimental data exist for melting points of different classes of energetic compounds. Quantitative structure-property relationships (QSPR) [19] has been recently introduced to predict melting points, it can be used to predict physicochemical parameters based on the structure of an organic compound. They connect physical or chemical properties to a set of molecular descriptors, which have developed relationships for use in different fields [19]. However, the main aim of QSPR is the identification of the appropriate set of descriptors that allow the desired attribute of the compound to be adequately predicted. This method has a key limitation because the set of organic compounds used to develop the relationship should be similar to those compounds, for which predictions are desired.
In this study, we have modeled the melting point of energetic compounds (Mp) of a series of carbocyclic nitroaromatic compounds (Table 1), using several statistical tools, principal components analysis (PCA), multiple linear regression (MLR)and artificial neural network (ANN) calculations [20,21]. The quantitative structure-propriety relationship (QSPR) method focuses on the motto that the properties of chemical compounds are determined by their molecular structures [22]. Thus, based on accurate experimental data of only some of the chemicals in one group, the melting point (Mp) of chemicals in the whole group can be predicted using the suitable models, including compounds that have not yet been experimentally synthesized [23-27].
| No | Compound | Mp | No | Compound | Mp | No | Compound | Mp |
|---|---|---|---|---|---|---|---|---|
| 1 | 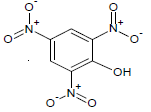 |
395 | 21 | 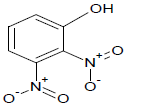 |
417 | 41 | 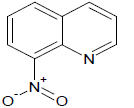 |
361.65 |
| 2 | 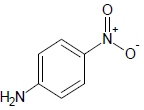 |
420 | 22 | 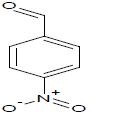 |
377.15 | 42 | 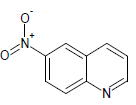 |
421.65 |
| 3 | 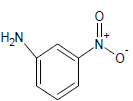 |
386 | 23 | 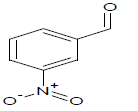 |
331.65 | 43 | 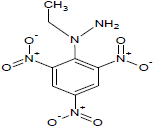 |
369 |
| 4 | 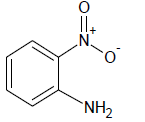 |
344 | 24 | 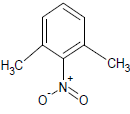 |
288 | 44 | 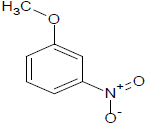 |
311.15 |
| 5 | 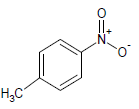 |
325 | 25 | 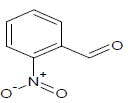 |
312.65 | 45 | 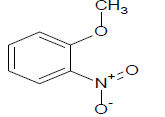 |
282.35 |
| 6 | 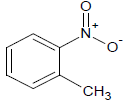 |
271 | 26 | 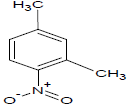 |
282.68 | 46 | 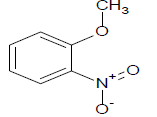 |
309 |
| 7 | 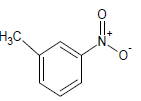 |
288.59 | 27 |  |
260.9 | 47 | 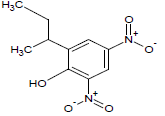 |
316.42 |
| 8 | 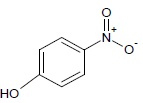 |
385 | 28 | 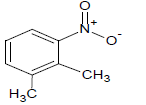 |
287.4 | 48 | 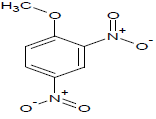 |
359.9 |
| 9 |  |
318 | 29 |  |
301.7 | 49 |  |
489.1 |
| 10 |  |
368 | 30 | 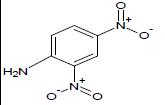 |
453.05 | 50 | 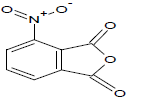 |
436.6 |
| 11 | 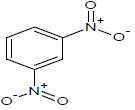 |
363 | 31 | 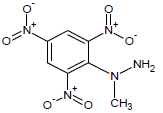 |
402.6 | 51 | 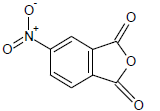 |
388 |
| 12 | 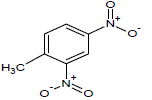 |
341 | 32 |  |
317 | 52 |  |
278.9 |
| 13 | 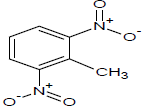 |
339 | 33 | 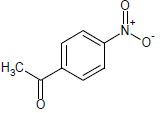 |
353.65 | 53 | 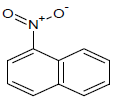 |
327.7 |
| 14 | 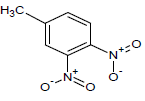 |
329 | 34 |  |
414.15 | 54 | 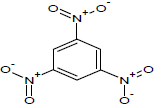 |
394.2 |
| 15 | 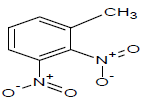 |
330 | 35 | 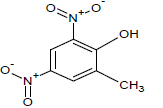 |
360.25 | 55 |  |
348.1 |
| 16 | 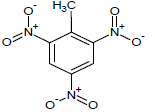 |
355.1 | 36 | 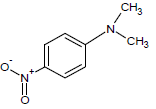 |
436.9 | 56 |  |
327.1 |
| 17 | 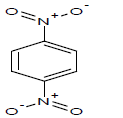 |
444.2 | 37 | 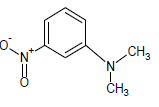 |
333.65 | 57 | 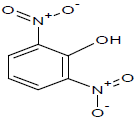 |
336 |
| 18 | 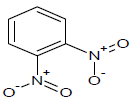 |
387.7 | 38 |  |
419 | 58 | 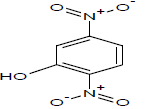 |
381 |
| 19 | 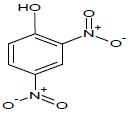 |
388 | 39 | 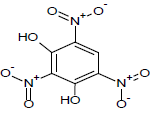 |
454.9 | 59 | 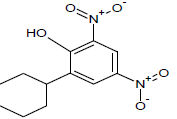 |
378.7 |
| 20 | 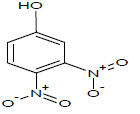 |
407 | 40 | 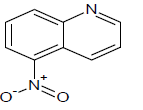 |
343 | 60 | 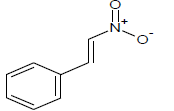 |
331 |
Table 1: Experimental values of melting point (Mp) of carbocyclic nitroaromatic compounds.
The objectives of this work are to develop predictive QSPR models for the melting point Mp of our studied molecules. On the other hand, several quantum chemical methods and Quantum-chemistry calculations have been performed in order to study the molecular structure and electronic properties. The more relevant molecular properties were calculated, these properties are the: highest occupied molecular orbital energy EHOMO, lowest unoccupied molecular orbital energy ELUMO, energy gap ΔE, dipole moment μ, total energy ET, activation energy Ea, absorption maximum λmax andfactor oscillation strengths f.o.
In the present work, multiple linear regression (MLR) and artificial neural network (ANN) were used to establish the quantitative relationship between molecular structure and melting point for the same data used by Keshavarz and Pouretedal [28]. We used the Gaussian 03 on the calculated electronic descriptors to generate QSPR sets, i.e., the training and test sets. Then, MLR was utilized to select the structural features of the molecules relevant to the melting point and to construct the linear model. Using the selected descriptors as inputs, the nonlinear model was constructed by ANN. Both models were validated by an internal validation methods including cross-validation to characterize robustness and an external validation to estimate the predictive power of the models. Final, the ultimate objective was to establish reliable QSPR models for the melting point prediction of carbocyclic nitroaromatic compounds.
Experimental data
The experimental Mp values for the 60 carbocyclic nitroaromatic compounds were taken from the literature [29]. The compounds and their corresponding Mp values are listed in Table 1.
Calculation of molecular descriptors
Calculation of descriptors using Gaussian 03W: DFT (density functional theory) methods were used in this study. These methods have become very popular in recent years because they can reach similar precision to other methods in less time and less cost from the computational point of view. In agreement with the DFT results, energy of the fundamental state of a polyelectronic system can be expressed through the total electronic density, and in fact, the use of electronic density instead of wave function for calculating the energy constitutes the fundamental base of DFT [30,31] using the B3LYP functional [32] and a 6-31G(d) basis set. The B3LYP, a version of DFT method, uses Becke’s three-parameter functional (B3) and includes a mixture of HF with DFT exchange terms associated with the gradient corrected correlation functional of Lee, Yang and Parr (LYP). The geometry of all species under investigation was determined by optimizing all geometrical variables without any symmetry constraints.
Several quantum chemical methods and quantum-chemistry calculations have been performed in order to study the molecular structure and electronic properties, from the results of the DFT calculations, the quantumchemistry descriptors were obtained for the model building as follows: the total energy ET(ev), the highest occupied molecular orbital energy EHOMO(ev), the lowest unoccupied molecular orbital energy ELUMO(ev), the energy difference between the LUMO and the HOMO energy Gap(ev), the total dipole moment of the molecule μ (Debye), activation energy Ea (ev), absorption maximum λmax (nm) and factor of oscillation f.o. [33-35].
ChemSketch program (Demo version 10.0) [10] was employed to calculate the others molecular descriptors, Molar Volume (MV (cm3)), Molecular Weight (MW), Molar Refractivity (MR (cm3)), Parachor (Pc (cm3)), Density (D (g/cm3)), Refractive Index (n), Surface Tension (γ (dyne/cm), and Polarizability (α (cm3)).
Statistical analysis
Principal Components Analysis (PCA): The energetic compounds of carbocyclic nitroaromaticderivatives (1 to 60) were studied by statistical methods based on the principal component analysis (PCA) [36] using the software XLSTAT 2009.
This is an essentially a descriptive statistical method which aims to present, in graphic form, the maximum information’s contained in the data Table 1.
PCA is a statistical technique useful for summarizing all the information’s encoded in the structures of compounds. It is also very helpful for understanding the distribution of the compounds.
Multiple Linear Regressions (MLR): The multiple linear regression statistic technique was used to study the relation between one dependent variable and several independent variables. It is a mathematic technique that minimizes differences between actual and predicted values. The qualities of the statistics of the MLR equation were judged by parameters such as the Rvalue (coefficient of correlation), the F value (Fischer statistics) and the RMSE value (the Root Mean Squared Error).
The multiple linear regression model (MLR) [37] was generated using the software XLSTAT 2009, to predict the melting point Mp. It has served also to select the descriptors used as the input parameters for a back-propagation network (ANN).
Artificial Neural Networks (ANNs): Nonlinear models were then developed by submitting the selected descriptors from MLR to a threelayer, fully connected, feedforward ANN. The number of input neurons was equal to that of the descriptors in the linear model. The number of hidden neurons was optimized by a trial and error procedure on the training process. One output neuron was used to represent the experimental Mp. To avoid overtraining, one tenth of the data from the training set was randomly selected as a separate validation set to monitor the training process; that is, during the training of the network the performance was monitored by predicting the values for the systems in the validation set. When the results for the validation set ceased to improve, the training was stopped [38].
Model evaluation and validation: In order to check the reliability and the stability of QSPR model elaborated by MLR and ANN methods, both the internal and external validations were conducted. The goodness of the fitting was firstly characterized by the coefficient of determination (R2) between calculated and experimental values for the molecules of the training set. The formula is given by equation (1):
 (1)
(1)
where  are the observed value, calculated value and mean value of the activity, respectively.
Cross-validation is one of the most popular methods of estimating the robustness of a model. In this work, the internal predictive capability of the model was evaluated by the leave-many-out (8% out) cross-validation ( CV R ), following the mathematic form:
 (2)
(2)
The reliability and robustness of the models were further validated by using the external test set composed of data not used to develop the prediction models. The external  for the test set is determined with the following equation:
 (3)
(3)
where  are the observed value, the calculated value in the test set and the mean value of the activity in the training set, respectively.
This study was carried for a series of 60 carbocyclic nitroaromatic compounds, in order to determine a quantitative relationship between the structural information and the Mp of the carbocyclic nitroaromatic compounds.
Table 2 shows the values of the calculated parameters obtained by DFT/B3LYP 6-31G* optimization of the studied compounds.
| N° | Mp | Et | EHOM O | ELUM O | Gap | m | Ea | λmax | f.o | MW | MR | MV | Pc | n | γ | D | α |
|---|---|---|---|---|---|---|---|---|---|---|---|---|---|---|---|---|---|
| 1 | 395 | -25077.60 | -8.242 | -3.900 | 4.342 | 1.768 | 4.810 | 257.79 | 0.0004 | 229.104 | 47.77 | 123.3 | 388.7 | 1.701 | 98.5 | 1.86 | 18.93 |
| 2 | 420 | -17461.12 | -8.343 | -3.508 | 4.834 | 0.113 | 2.115 | 586.35 | 0.0026 | 138.124 | 37.03 | 103.5 | 288.5 | 1.634 | 60.3 | 1.33 | 14.68 |
| 3 | 386 | -13400.02 | -6.140 | -2.246 | 3.894 | 5.653 | 5.007 | 247.60 | 0.0009 | 128.124 | 37.03 | 103.5 | 288.5 | 1.634 | 60.3 | 1.33 | 14.68 |
| 4 | 344 | -13399.41 | -7.043 | -1.632 | 5.411 | 5.068 | 5.329 | 232.66 | 0.0038 | 138.124 | 37.03 | 103.5 | 288.5 | 1.634 | 60.3 | 1.33 | 14.68 |
| 5 | 325 | -12963.38 | -7.369 | -2.317 | 5.051 | 5.207 | 5.923 | 209.34 | 0.1054 | 137.136 | 37.62 | 117.5 | 300.4 | 1.553 | 42.6 | 1.17 | 14.91 |
| 6 | 271 | -12963.06 | -7.060 | -1.965 | 5.096 | 3.713 | 5.951 | 208.35 | 0.0456 | 137.136 | 37.62 | 117.5 | 300.4 | 1.553 | 42.6 | 1.17 | 14.91 |
| 7 | 289 | -12963.36 | -7.273 | -2.357 | 4.916 | 4.886 | 5.958 | 208.11 | 0.0343 | 137.136 | 37.62 | 117.5 | 300.4 | 1.553 | 42.6 | 1.17 | 14.91 |
| 8 | 385 | -13940.34 | -7.042 | -1.982 | 5.060 | 4.033 | 5.920 | 209.42 | 0.0995 | 139.108 | 34.67 | 99.7 | 277.7 | 1.612 | 60.2 | 1.40 | 13.74 |
| 9 | 318 | -13940.44 | -6.666 | -1.807 | 4.858 | 5.114 | 5.123 | 242.00 | 0.0346 | 139.108 | 34.67 | 99.7 | 277.7 | 1.612 | 60.2 | 1.40 | 13.74 |
| 10 | 368 | -13940.83 | -6.784 | -2.398 | 4.386 | 5.826 | 5.852 | 211.87 | 0.0318 | 139.108 | 34.67 | 99.7 | 277.7 | 1.612 | 60.2 | 1.40 | 13.74 |
| 11 | 363 | -17461.14 | -8.419 | -3.137 | 5.281 | 4.220 | 4.806 | 257.96 | 0.0003 | 168.107 | 39.34 | 113.1 | 318.2 | 1.612 | 62.6 | 1.49 | 15.59 |
| 12 | 341 | -18531.49 | -7.813 | -2.880 | 4.934 | 4.495 | 4.796 | 258.52 | 0.0004 | 182.133 | 44.16 | 129.3 | 355.8 | 1.598 | 57.2 | 1.41 | 17.50 |
| 13 | 339 | -18531.47 | -7.912 | -2.864 | 5.048 | 2.988 | 4.781 | 259.34 | 0.0003 | 182.133 | 44.16 | 129.3 | 355.8 | 1.598 | 57.2 | 1.41 | 17.50 |
| 14 | 329 | -18531.35 | -7.735 | -2.924 | 4.811 | 7.304 | 4.742 | 261.46 | 0.0005 | 182.133 | 44.16 | 129.3 | 355.8 | 1.598 | 57.2 | 1.41 | 17.50 |
| 15 | 330 | -18531.31 | -7.678 | -2.879 | 4.799 | 6.608 | 4.725 | 262.38 | 0.0004 | 182.133 | 44.16 | 129.3 | 355.8 | 1.598 | 57.2 | 1.41 | 17.50 |
| 16 | 355 | -24099.79 | -8.465 | -3.495 | 4.970 | 1.478 | 4.778 | 259.51 | 0.0002 | 227.131 | 50.71 | 141.2 | 411.3 | 1.637 | 71.9 | 1.61 | 20.10 |
| 17 | 444 | -17461.12 | -8.343 | -3.508 | 4.834 | 0.113 | 2.115 | 586.35 | 0.0026 | 168.107 | 39.34 | 113.1 | 318.2 | 1.612 | 62.6 | 1.49 | 15.59 |
| 18 | 388 | -17460.68 | -7.941 | -3.036 | 4.904 | 6.672 | 2.054 | 603.76 | 0.0009 | 168.107 | 39.34 | 113.1 | 318.2 | 1.612 | 62.6 | 1.49 | 15.59 |
| 19 | 388 | -19509.04 | -7.642 | -2.824 | 4.818 | 6.017 | 4.779 | 259.42 | 0.0012 | 184.106 | 41.22 | 111.5 | 333.2 | 1.660 | 79.6 | 1.65 | 16.34 |
| 20 | 407 | -19508.85 | -7.442 | -2.874 | 4.568 | 7.903 | 4.749 | 261.06 | 0.0007 | 184.106 | 41.22 | 111.5 | 333.2 | 1.660 | 79.6 | 1.65 | 16.34 |
| 21 | 417 | -19508.40 | -7.267 | -2.403 | 4.863 | 7.655 | 4.751 | 260.98 | 0.0006 | 184.106 | 41.22 | 111.5 | 333.2 | 1.660 | 79.6 | 1.65 | 16.34 |
| 22 | 377 | -14978.44 | -7.580 | -3.121 | 4.459 | 2.506 | 5.048 | 245.61 | 0.0003 | 151.119 | 39.55 | 112.9 | 307.8 | 1.617 | 55.1 | 1.34 | 15.67 |
| 23 | 332 | -14978.47 | -7.519 | -2.841 | 4.678 | 2.205 | 4.788 | 258.95 | 0.0113 | 151.119 | 39.55 | 112.9 | 307.8 | 1.617 | 55.1 | 1.34 | 15.67 |
| 24 | 288 | -14033.73 | -6.957 | -1.963 | 4.994 | 3.376 | 5.926 | 209.21 | 0.029 | 151.162 | 42.44 | 133.8 | 338.0 | 1.547 | 40.7 | 1.13 | 16.82 |
| 25 | 313 | -14978.05 | -7.391 | -2.600 | 4.791 | 6.520 | 4.592 | 269.98 | 0.0225 | 151.119 | 39.55 | 112.9 | 307.8 | 1.617 | 55.1 | 1.34 | 15.67 |
| 26 | 283 | -14033.70 | -6.831 | -1.897 | 4.934 | 4.184 | 5.904 | 210.01 | 0.0744 | 151.162 | 42.44 | 133.8 | 338.0 | 1.547 | 40.7 | 1.13 | 16.82 |
| 27 | 261 | -14033.73 | -7.237 | -2.288 | 4.949 | 4.233 | 5.942 | 208.65 | 0.0345 | 151.162 | 42.34 | 134 | 339.3 | 1.544 | 41 | 1.13 | 16.78 |
| 28 | 287 | -14033.80 | -7.030 | -2.171 | 4.859 | 4.565 | 3.957 | 313.36 | 0.0394 | 151.162 | 42.44 | 133.8 | 338.0 | 1.547 | 40.7 | 1.13 | 16.82 |
| 29 | 302 | -14034.00 | -7.136 | -2.253 | 4.883 | 5.456 | 5.915 | 209.62 | 0.0587 | 151.162 | 42.44 | 133.8 | 338.0 | 1.547 | 40.7 | 1.13 | 16.82 |
| 30 | 453 | -18968.71 | -6.889 | -2.804 | 4.085 | 6.699 | 4.793 | 258.66 | 0.0003 | 182.121 | 43.58 | 115.3 | 344.0 | 1.679 | 79 | 1.59 | 17.27 |
| 31 | 403 | -27112.96 | -7.040 | -3.068 | 3.972 | 5.368 | 3.283 | 377.63 | 0.0082 | 257.16 | 59.1 | 150.1 | 464.9 | 1.717 | 92 | 1.71 | 23.43 |
| 32 | 317 | -15104.43 | -6.911 | -2.049 | 4.862 | 4.345 | 3.970 | 312.34 | 0.0378 | 165.189 | 47.27 | 150.1 | 375.6 | 1.542 | 39.2 | 1.10 | 18.74 |
| 33 | 354 | -16049.23 | -7.327 | -2.937 | 4.390 | 3.651 | 5.212 | 237.91 | 0.0053 | 165.146 | 42.82 | 132.8 | 347.9 | 1.558 | 47.1 | 1.24 | 16.97 |
| 34 | 414 | -17027.49 | -7.887 | -2.654 | 5.234 | 5.277 | 5.247 | 236.28 | 0.0056 | 167.119 | 39.72 | 113.8 | 324.8 | 1.615 | 66.4 | 1.47 | 15.74 |
| 35 | 360 | -20579.73 | -7.478 | -2.724 | 4.754 | 6.721 | 4.814 | 257.53 | 0.0008 | 198.133 | 46.05 | 127.8 | 370.8 | 1.639 | 70.8 | 1.55 | 18.25 |
| 36 | 437 | -15540.80 | -5.828 | -1.829 | 3.999 | 8.068 | 4.792 | 258.74 | 0.0002 | 166.177 | 47.11 | 139.2 | 364.7 | 1.591 | 47 | 1.19 | 18.67 |
| 37 | 334 | -15540.69 | -5.662 | -2.130 | 3.532 | 6.166 | 4.194 | 295.63 | 0.0009 | 166.177 | 47.11 | 139.2 | 364.7 | 1.591 | 47 | 1.19 | 18.67 |
| 38 | 419 | -17027.10 | -7.571 | -2.488 | 5.083 | 5.395 | 5.158 | 240.37 | 0.0066 | 167.119 | 39.72 | 113.8 | 324.8 | 1.615 | 66.4 | 1.47 | 15.74 |
| 39 | 455 | -27125.80 | -8.015 | -3.716 | 4.299 | 1.646 | 4.818 | 257.35 | 0.0003 | 245.103 | 49.65 | 121.8 | 403.7 | 1.750 | 121 | 2.01 | 19.68 |
| 40 | 343 | -16512.77 | -6.845 | -2.158 | 4.687 | 1.943 | 4.281 | 289.63 | 0.0629 | 174.156 | 48.73 | 128.6 | 360.7 | 1.682 | 61.8 | 1.35 | 19.31 |
| 41 | 362 | -16512.75 | -6.787 | -2.010 | 4.776 | 5.905 | 4.211 | 294.44 | 0.0681 | 174.156 | 48.73 | 128.6 | 360.7 | 1.682 | 61.8 | 1.35 | 19.31 |
| 42 | 422 | -16512.80 | -6.915 | -2.067 | 4.848 | 3.758 | 4.354 | 284.76 | 0.0427 | 174.156 | 48.73 | 128.6 | 360.7 | 1.682 | 61.8 | 1.35 | 19.31 |
| 43 | 369 | -28183.51 | -7.004 | -3.096 | 3.907 | 5.249 | 3.331 | 372.26 | 0.0098 | 271.187 | 63.73 | 166.6 | 504.7 | 1.690 | 84.2 | 1.63 | 25.26 |
| 44 | 311 | -15011.16 | -6.630 | -2.325 | 4.305 | 6.041 | 5.767 | 215.00 | 0.0273 | 153.135 | 39.47 | 125.2 | 319.4 | 1.542 | 42.2 | 1.22 | 15.64 |
| 45 | 282 | -15010.78 | -6.514 | -1.747 | 4.766 | 4.889 | 5.780 | 214.51 | 0.0512 | 153.135 | 39.47 | 125.2 | 319.4 | 1.542 | 42.2 | 1.22 | 15.64 |
| 46 | 309 | -14917.21 | -7.404 | -2.798 | 4.605 | 5.124 | 4.758 | 260.60 | 0.2417 | 141.082 | 31.85 | 95.7 | 261.7 | 1.579 | 55.9 | 1.47 | 12.62 |
| 47 | 316 | -23791.17 | -7.363 | -2.652 | 4.711 | 7.238 | 4.810 | 257.75 | 0.0014 | 240.213 | 60.04 | 178.1 | 488.0 | 1.589 | 56.3 | 1.35 | 23.80 |
| 48 | 360 | -20579.40 | -7.441 | -2.731 | 4.710 | 6.681 | 4.779 | 259.45 | 0.0014 | 198.133 | 46.02 | 137.1 | 374.9 | 1.586 | 55.8 | 1.44 | 18.24 |
| 49 | 489 | -17556.88 | -6.852 | -2.500 | 4.352 | 2.466 | 5.135 | 241.46 | 0.0091 | 180.161 | 47.07 | 134.3 | 366.4 | 1.617 | 55.3 | 1.34 | 18.66 |
| 50 | 437 | -20080.35 | -8.174 | -3.327 | 4.847 | 6.121 | 3.963 | 312.84 | 0.0589 | 193.113 | 42.22 | 114.4 | 340.1 | 1.659 | 78.1 | 1.69 | 16.74 |
| 51 | 388 | -20080.35 | -8.249 | -3.179 | 5.070 | 2.833 | 3.552 | 349.06 | 0.0757 | 193.113 | 42.22 | 114.4 | 340.1 | 1.659 | 78.1 | 1.69 | 16.74 |
| 52 | 279 | -11892.39 | -7.232 | -1.967 | 5.265 | 4.016 | 5.963 | 207.91 | 0.0699 | 123.109 | 32.79 | 101.2 | 262.7 | 1.561 | 45.3 | 1.22 | 13.00 |
| 53 | 328 | -16076.09 | -6.357 | -1.971 | 4.386 | 4.013 | 4.388 | 282.56 | 0.0792 | 173.168 | 50.64 | 135.3 | 366.5 | 1.671 | 53.7 | 1.28 | 20.07 |
| 54 | 394 | -23028.48 | -8.368 | -2.954 | 5.413 | 0.007 | 4.796 | 258.52 | 0.0001 | 213.104 | 45.88 | 124.9 | 373.7 | 1.655 | 80 | 1.71 | 18.19 |
| 55 | 348 | -19691.60 | -5.728 | -2.310 | 3.417 | 4.440 | 4.834 | 256.47 | 0.0297 | 214.22 | 62.17 | 167.3 | 456.1 | 1.665 | 55.2 | 1.28 | 24.64 |
| 56 | 327 | -15011.24 | -6.765 | -2.161 | 4.604 | 6.000 | 5.311 | 233.45 | 0.0056 | 153.136 | 39.47 | 125.2 | 319.4 | 1.542 | 42.2 | 1.22 | 15.64 |
| 57 | 336 | -19509.25 | -7.536 | -3.363 | 4.173 | 4.044 | 6.071 | 204.24 | 0.0203 | 184.106 | 41.22 | 111.5 | 333.2 | 1.660 | 79.6 | 1.65 | 16.34 |
| 58 | 381 | -19509.49 | -7.491 | -3.636 | 3.855 | 1.168 | 4.813 | 257.60 | 0.0003 | 184.106 | 41.22 | 111.5 | 333.2 | 1.660 | 79.6 | 1.65 | 16.34 |
| 59 | 379 | -25899.67 | -7.273 | -3.185 | 4.089 | 4.576 | 4.086 | 303.42 | 0.0039 | 266.25 | 67.08 | 192.7 | 539.6 | 1.612 | 61.4 | 1.38 | 26.59 |
| 60 | 331 | -14000.35 | -6.950 | -2.634 | 4.316 | 5.867 | 5.691 | 217.86 | 0.0009 | 149.147 | 43.53 | 126.6 | 328.9 | 1.603 | 45.4 | 1.18 | 17.25 |
Table 2: Values of the calculated parameters obtained by DFT/B3LYP 6-31G* optimization of the studied compounds.
The set of sixteen descriptors encoding the 60 of carbocyclic nitroaromatic compounds, electronic, energetic and topologic parameters are submitted to PCA analysis [38]. The first three principal axes are sufficient to describe the information provided by the data matrix. Indeed, the percentages of variance are 42.93%, 22.33% and 9.72% for the axes F1, F2 and F3, respectively. The total information was estimated to a percentage of 74.99%. The principal component analysis (PCA) [38] was conducted to identify the link between the different variables. Bold values are different from 0 at a significance level of p=0.05.
The Pearson correlation coefficients were summarized in the following Table 3 and 4. The obtained matrix provides information on the negative or positive correlation between variables.
| Variables | Mp | Et | EHOMO | ELUMO | Gap | m | Ea | λmax | f.o | MW | MR | MV | Pc | n | γ | D | α |
|---|---|---|---|---|---|---|---|---|---|---|---|---|---|---|---|---|---|
| Mp | 1 | ||||||||||||||||
| Et | -0.471 | 1 | |||||||||||||||
| EHOMO | -0.250 | 0.385 | 1 | ||||||||||||||
| ELUMO | -0.467 | 0.686 | 0.741 | 1 | |||||||||||||
| Gap | -0.219 | 0.296 | -0.538 | 0.167 | 1 | ||||||||||||
| m | -0.122 | 0.122 | 0.409 | 0.373 | -0.132 | 1 | |||||||||||
| Ea | -0.454 | 0.423 | 0.289 | 0.440 | 0.127 | 0.167 | 1 | ||||||||||
| λmax | 0.381 | -0.262 | -0.323 | -0.404 | -0.033 | -0.225 | -0.934 | 1 | |||||||||
| f.o | -0.343 | 0.364 | 0.149 | 0.316 | 0.178 | -0.013 | 0.179 | -0.155 | 1 | ||||||||
| MW | 0.381 | -0.968 | -0.237 | -0.556 | -0.350 | -0.056 | -0.369 | 0.183 | -0.339 | 1 | |||||||
| MR | 0.171 | -0.721 | 0.153 | -0.202 | -0.478 | 0.017 | -0.308 | 0.124 | -0.281 | 0.852 | 1 | ||||||
| MV | -0.101 | -0.493 | 0.245 | -0.011 | -0.374 | 0.098 | -0.153 | 0.021 | -0.225 | 0.666 | 0.911 | 1 | |||||
| Pc | 0.177 | -0.792 | 0.046 | -0.288 | -0.429 | 0.024 | -0.298 | 0.120 | -0.319 | 0.906 | 0.982 | 0.911 | 1 | ||||
| n | 0.659 | -0.655 | -0.195 | -0.478 | -0.313 | -0.180 | -0.405 | 0.248 | -0.211 | 0.586 | 0.392 | -0.020 | 0.352 | 1 | |||
| γ | 0.655 | -0.775 | -0.445 | -0.669 | -0.186 | -0.180 | -0.329 | 0.207 | -0.261 | 0.654 | 0.270 | -0.095 | 0.318 | 0.882 | 1 | ||
| D | 0.629 | -0.766 | -0.554 | -0.727 | -0.100 | -0.165 | -0.329 | 0.213 | -0.220 | 0.631 | 0.185 | -0.153 | 0.255 | 0.801 | 0.970 | 1 | |
| α | 0.171 | -0.721 | 0.152 | -0.202 | -0.478 | 0.017 | -0.308 | 0.124 | -0.281 | 0.853 | 1.000 | 0.911 | 0.982 | 0.392 | 0.270 | 0.185 | 1 |
Table 3: Correlation matrix (Pearson (n)) between different obtained descriptors.
| Samples | R | R2 | RMSE |
|---|---|---|---|
| Training | 500.997 | 0.994 | 1.295 × 10⁻⁵ |
| Validation | 7 0.9890.978 | 2.364 × 10⁻⁵ | |
| Test30.988 | 0.986 | 4.465 × 10⁻⁵ |
Table 4: Correlation coefficient (R) and root mean square error (RMSE).
*The Polarizability α is perfectly correlated with the Molar Refractivity MR (r=1), strongly correlated with the Parachor Pc (r=0.982) and highly correlated with the Molar Volume (r=0.911).
*The Parachor Pc is strongly correlated with the Molar Refractivity MR (r=0.982), highly correlated with the Molar Volume MV (r=0.911) and the Molar Weight MW (r=0.906).
*The Molar Weight MW is strongly negatively correlated with the total Energy Et (r=-0.968).
*The absorption maximum λmax is highly negatively correlated with the activation Energy Ea (r=-0.943).
Analysis of projections according to the planes F1-F2 and F1-F3 (65.27% and 52.65% of the total variance respectively) of the studied molecules (Figure 1) shows that the molecules are dispersed in three regions: Region 1 contains compounds having a values of density D between 1.10 (g/cm3) and 1.28 (g/cm3), Region 2 contains compounds having a values of density D between 1.33 (g/cm3) and 1.47 (g/cm3) and Region 3 contains compounds having a values of density D between 1.49 (g/cm3) and 2.01 (g/cm3).
To establish quantitative relationships between the melting point Mp and selected descriptors, our array data were subjected to a multiple linear regression. Only variables whose coefficients are significant were retained.
Multiple linear regression of the melting point Mp (MLR)
Modeling the melting point Mp value of all training compounds (50 carbocyclic nitroaromatic derivatives) led to the best value corresponding to the linear combination of the following descriptors: the absorption maximum λmax, factor of oscillation f.o, themolar volume MV, the molar refractivity MR and the density D.
The most significant QSAR model was obtained, as shown in the following equation:
 (4)
(4)
For our 50 compounds, the correlation between experimental and calculated Mpone based on this model are quite significant (Figure 2) as indicated by statistical values:

In the above regression equation, R is correlation coefficient, RCV is cross-validationcoefficient, RMSE is root mean square error, F is Fisher’s test and N is data points (compounds). Generally, the higher the correlation coefficient and the lower the standard error, the more reliable is the model. High values of F indicate the significance of Eq. (4), which reflects the ratio of variance explained by the model and the variance due to the error in the model. Based on Eq. (4), the positive correlation coefficient for λmax, MR and D indicates that a compound with a larger value for these descriptors would have a larger Mpvalue (increase Mp), the negative correlation for f.o and MW D indicates that a compound with a larger value for these descriptors would have a smaller Mp value (decrease Mp).
The Figure 2 shows a very regular distribution of Mp values depending on the experimental values. As part of this conclusion, we can say that the melting point Mp values obtained from MLR are highly correlated to that of the observed melting point. ‘Leave-many-out (8% out)’ is an approach particularly well adapted for estimating the melting point ability of these models. In this paper, the ‘leave-manyout’ procedure was used to evaluate the predictive ability of the MLR. The correlations between the observed properties (Melting point) and the cross-validation (CV) calculated values are illustrated in Figure 3 and Table 5.
| N° | Mp | ||||||
|---|---|---|---|---|---|---|---|
| Obs. | RML | CV | ANN | ||||
| Pred. | Resid. | Pred. | Resid. | Pred. | Resid. | ||
| 1 | 395.00 | 424.97 | -29.97 | 437.47 | -42.47 | 394.99 | 0.01 |
| 2 | 420.00 | 412.36 | 7.64 | 383.79 | 36.21 | 420.00 | 0.00 |
| 3 | 386.00 | 405.26 | -19.26 | 417.83 | -31.83 | 386.01 | -0.01 |
| 4 | 344.00 | 373.93 | -29.93 | 383.37 | -39.37 | 344.00 | 0.00 |
| 5 | 325.00 | 289.68 | 35.32 | 285.12 | 39.88 | 324.99 | 0.01 |
| 6 | 271.00 | 305.05 | -34.05 | 314.13 | -43.13 | 271.01 | -0.01 |
| 7 | 288.59 | 307.95 | -19.36 | 317.83 | -29.24 | 288.59 | 0.00 |
| 8 | 385.00 | 343.63 | 41.37 | 350.11 | 34.89 | 385.01 | -0.01 |
| 9 | 318.00 | 363.93 | -45.93 | 371.37 | -53.37 | 318.00 | 0.00 |
| 10 | 368.00 | 361.41 | 6.59 | 372.29 | -4.29 | 368.01 | -0.01 |
| 11 | 363.00 | 373.20 | -10.20 | 380.21 | -17.21 | 363.01 | -0.01 |
| 12 | 341.00 | 351.34 | -10.34 | 357.62 | -16.62 | 341.00 | 0.00 |
| 13 | 339.00 | 351.45 | -12.45 | 357.66 | -18.66 | 339.00 | 0.00 |
| 14 | 329.00 | 351.63 | -22.63 | 357.59 | -28.59 | 328.99 | 0.01 |
| 15 | 330.00 | 351.75 | -21.75 | 357.62 | -27.62 | 329.99 | 0.01 |
| 16 | 355.10 | 365.37 | -10.27 | 368.18 | -13.08 | 355.10 | 0.00 |
| 17 | 444.20 | 408.00 | 36.20 | 373.13 | 71.07 | 444.20 | 0.00 |
| 18 | 387.70 | 410.32 | -22.62 | 373.59 | 14.11 | 387.70 | 0.00 |
| 19 | 388.00 | 409.13 | -21.13 | 412.39 | -24.39 | 388.00 | 0.00 |
| 20 | 407.00 | 409.44 | -2.44 | 412.52 | -5.52 | 407.00 | 0.00 |
| 21 | 417.00 | 409.45 | 7.55 | 416.05 | 0.95 | 417.00 | 0.00 |
| 22 | 377.15 | 366.22 | 10.93 | 374.47 | 2.68 | 377.16 | -0.01 |
| 23 | 331.65 | 364.81 | -33.16 | 371.02 | -39.37 | 331.64 | 0.01 |
| 24 | 288.00 | 303.71 | -15.71 | 311.74 | -23.74 | 287.99 | 0.01 |
| 25 | 312.65 | 363.10 | -50.45 | 367.51 | -54.86 | 312.63 | 0.02 |
| 26 | 282.68 | 292.05 | -9.37 | 309.07 | -26.39 | 282.68 | 0.00 |
| 27 | 260.90 | 300.44 | -39.54 | 307.26 | -46.36 | 260.92 | -0.02 |
| 28 | 287.40 | 312.24 | -24.84 | 322.23 | -34.83 | 287.40 | 0.00 |
| 29 | 301.70 | 296.07 | 5.63 | 309.02 | -7.32 | 301.69 | 0.01 |
| 30 | 453.05 | 414.45 | 38.60 | 403.89 | 49.16 | 453.04 | 0.01 |
| 31 | 402.60 | 415.06 | -12.46 | 427.45 | -24.85 | 402.61 | -0.01 |
| 32 | 317.00 | 310.01 | 6.99 | 312.62 | 4.38 | 317.01 | -0.01 |
| 33 | 353.65 | 320.22 | 33.43 | 310.00 | 43.65 | 353.66 | -0.01 |
| 34 | 414.15 | 369.30 | 44.85 | 359.91 | 54.24 | 414.16 | -0.01 |
| 35 | 360.25 | 379.14 | -18.89 | 374.56 | -14.31 | 360.25 | 0.00 |
| 36 | 436.90 | 345.29 | 91.61 | 337.28 | 99.62 | 436.94 | -0.04 |
| 37 | 333.65 | 349.08 | -15.43 | 342.07 | -8.42 | 333.64 | 0.01 |
| 38 | 419.00 | 369.48 | 49.52 | 361.00 | 58.00 | 419.01 | -0.01 |
| 39 | 454.90 | 457.86 | -2.96 | 461.78 | -6.88 | 454.83 | 0.07 |
| 40 | 343.00 | 387.82 | -44.82 | 402.88 | -59.88 | 342.99 | 0.01 |
| 41 | 361.65 | 386.99 | -25.34 | 407.70 | -46.05 | 361.64 | 0.01 |
| 42 | 421.65 | 392.52 | 29.13 | 406.44 | 15.21 | 421.65 | 0.00 |
| 43 | 369.00 | 387.53 | -18.53 | 408.08 | -39.08 | 369.00 | 0.00 |
| 44 | 311.15 | 304.59 | 6.56 | 299.42 | 11.73 | 311.14 | 0.01 |
| 45 | 282.35 | 298.36 | -16.01 | 299.36 | -17.01 | 282.35 | 0.00 |
| 46 | 309.00 | 307.93 | 1.07 | 366.38 | -57.38 | 309.00 | 0.00 |
| 47 | 316.42 | 321.98 | -5.56 | 306.68 | 9.74 | 316.42 | 0.00 |
| 48 | 359.90 | 338.05 | 21.85 | 329.82 | 30.08 | 359.91 | -0.01 |
| 49 | 489.10 | 356.83 | 132.27 | 345.74 | 143.36 | 489.06 | 0.04 |
| 50 | 436.60 | 398.32 | 38.28 | 409.87 | 26.73 | 436.62 | -0.02 |
Table 5: Observed. predicted Mp and residue according to different methods.
True predictive power of a QSPR model is to test their ability to predict accurately the melting point of compounds from an external test set (compounds which were not used for the model development), the melting point of the remained set of 10 compounds (51-60) are deducedfrom the quantitative model proposed with the 50 molecules (training set) by MLR, their observed and calculated Mp values are given in Table 6.
| N° | Mp | ||
|---|---|---|---|
| Obs. | RML | ||
| Pred. | Resid. | ||
| 51.00 | 388.00 | 397.88 | -9.88 |
| 52.00 | 278.90 | 308.96 | -30.06 |
| 53.00 | 327.70 | 376.29 | -48.59 |
| 54.00 | 394.20 | 394.03 | 0.17 |
| 55.00 | 348.10 | 385.35 | -37.25 |
| 56.00 | 327.10 | 312.19 | 14.91 |
| 57.00 | 336.00 | 398.24 | -62.24 |
| 58.00 | 381.00 | 409.17 | -28.17 |
| 59.00 | 378.70 | 335.34 | 43.36 |
| 60.00 | 331.00 | 347.36 | -16.36 |
Table 6: The observed. the predicted Mp. and residue according to MLR for the 10 tested compounds (test set).
N=10Rtest (MLR)=0.642R2 test (MLR)=0.412
The ANN has become an important and widely used nonlinear modeling technique for QSPR studies, it can be used to generate predictive models of quantitative structure-property relationships (QSPR) between a set of molecular descriptors obtained from the MLR and observed melting point.
The correlations coefficients and Standard Error of Estimate, obtained with the ANN, show that the selected descriptors by MLR are pertinent and that the model proposed to predict melting point is relevant.
The statistic of the three steps of the calculation by the ANN: training, validation and test are illustrated in Table 4.
It can be found that the ANN model performs better than the MLR model, which further confirms the nonlinear relationship between the structural information and the Mp of the carbocyclic nitroaromatic compounds.
The values of predicted Mp calculated using ANN and the observed values are illustrated in Figure 4.
Model validation
In order to check the reliability and the stability of the QSPR model elaborated by the MLR and ANN methods, we have used the internal and external validations. The leave-many-out (8% out) cross-validation (RCV=0.651) of MLR, showing the good robustness of the model. Moreover, predictions realized on the test set (Rtest (MLR)=0.642) were in good agreement with the experimental values.
comparison of the quality of ACP, MLR and ANN models shows that the ANN (R=0.954, R(test)=0.989, R(validation)=0.988) is the best models that indicate the effects of these descriptors on the melting point of the studied compounds.
All the results discussed above showed that the presented MLR and ANN models could be effectively used to predict the Mp of carbocyclic nitroaromatic compounds, they were able to establish a satisfactory relationship between the molecular descriptors and the melting point of the studied compounds.
From the values of correlation coefficient of the ten compounds (test set) (Rtest), the Cross-Validated coefficient (RCV) and other statistical parameters of these methods (MLR and ANN), it is clear that the predictive power of our model is high and stable, it can be efficiently used for estimating the melting point of other carbocyclic nitrobenzene compounds for which no experimental data are available.
The predicted activity values of carbocyclic nitrobenzene compounds of training set, obtained by different methods are listed in Table 5 along with their observed activity.
In present work, we have carried out a comparative analysis of the melting point of carbocyclic nitrobenzene compounds by two QSAR approaches, MLR and ANN. Both approaches have showed good predictive power (R=0.773 and 0.997, respectively). Comparison of the qualities of MLR and ANN models shown that the ANN has a good predictive ability and strong robustness than the MLR, yields a regression model with improved predictive power, we have established a relationship between several descriptors and the melting point Mp. The predictive ability and robustness of the obtained models were assessed by cross-validation, and external validation through test set. Thus, the model could be efficiently employed for estimating the Mp and for select the descriptors which have an impact on this property and which are sufficiently rich in chemical, electronic and topological information to encode the structural feature.
The present study shows that molecular descriptors, namely the absorption maximum λmax, factor of oscillation f.o, molar volume MV, molar refractivity MR and the density D, are useful for the prediction of the melting point of carbocyclic nitroaromatic compounds, which the experimental data are unavailable.
The QSAR model is statistically significant, robust and can be used for prediction the property more accurately, it may be helpful for a better understanding of the Mp of this class of compounds and useful as guidance to estimate the melting point as physical property of new energetic compounds.
We are grateful to the “Association Marocaine des Chimistes Théoriciens” (AMCT) for its pertinent help concerning the programs.