Journal of Stock & Forex Trading
Open Access
ISSN: 2168-9458
ISSN: 2168-9458
Research Article - (2024)Volume 11, Issue 1
Objective: We back-tested and evaluated the Razor Forex System on G10 FX trading and the combination with the tendency forex system.
Methods: Back-testing was done in eSignal charting system with intraday historical data from 2010. VBA programming was used to merge or split the exported back-testing data, which was divided into 4 groups: Tendency forex system, razor forex system, filtered tendency forex system (filtered by razor forex system), filtered razor forex system (filtered by tendency forex system). SPSS 24.0 was used for statistical analysis. Python 3.11.4 was used to calculate the smoothness and the deviation degree of the equity curve of different groups.
Results: Filtered tendency forex system has a higher return and lower drawdown (P<0.05) when compared with tendency forex system, but the difference was not statistically significant when compared with the filtered razor forex system (p>0.05). Python analysis showed that the deviation degree of the filtered tendency forex system was a little lower than that of the filtered razor forex system.
Conclusion: Tendency forex system filtered by razor forex system: The trading signal can be directly used in real- time trading. Razor forex system filtered by tendency forex system: The trading signal can be used as a reliable back- testable indicator.
Forex trading; Statistical analysis; Python; VBA programming
The razor forex system was created with JavaScript in eSignal charting system. It is an automated, back-testable, trend-following system, working on EUR/USD, USD/CHF, AUD/USD, USD/ JPY 120 and 240 timeframes. The entry and exit signals can be directly flagged on the chart with audio and pop-up alerts [1].
Back-testing conditions of the razor forex system
• Historical data feed: eSignal
• Period: From Jan. 2010 to Dec. 2022
• Initial virtual balance: $ 10k
• Contract size: Fixed 0.1 standard lot per trade
• VBA programming in microsoft excel 2019 to merge or split the exported back-testing data (Figures 1 and 2) [2,3].
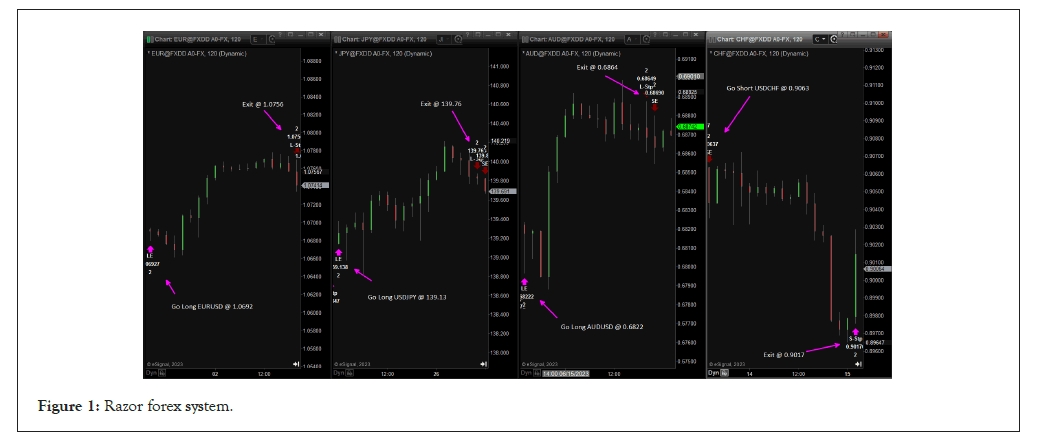
Figure 1: Razor forex system.
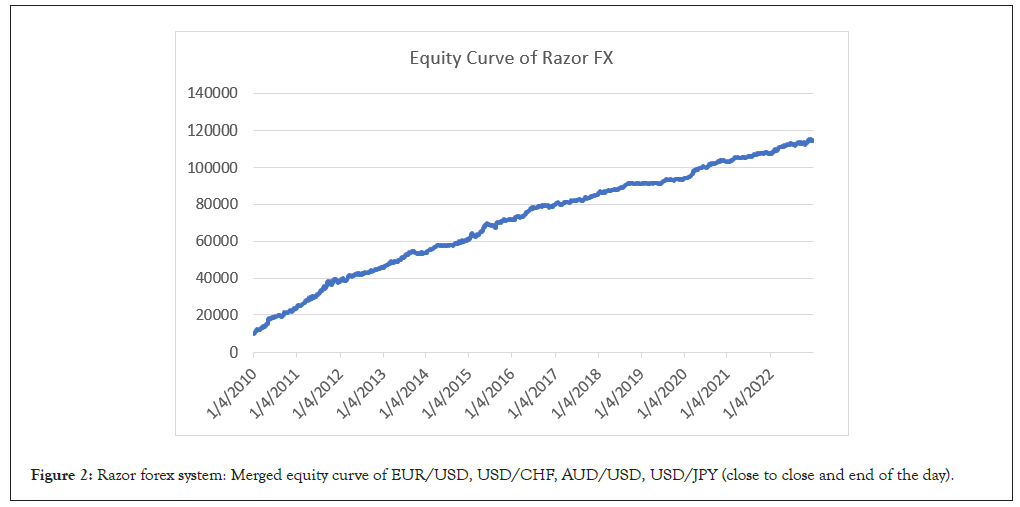
Figure 2: Razor forex system: Merged equity curve of EUR/USD, USD/CHF, AUD/USD, USD/JPY (close to close and end of the day).
The razor forex system could be used independently for real- time trading. However, its original design was mainly to combine with the tendency forex system to complement each other in mechanism, so as to reduce drawdown and enhance the stability [4-6].
For the tendency forex system, once a buy/sell arrow was flagged, if the razor forex system also generated a buy/sell arrow on the next bar, then the trading signal of the tendency forex system could be confirmed.
For the razor forex system, if we have no trading signal of tendency forex system on the previous bar, then the trading signal of the razor forex system could be confirmed (Figure 3).
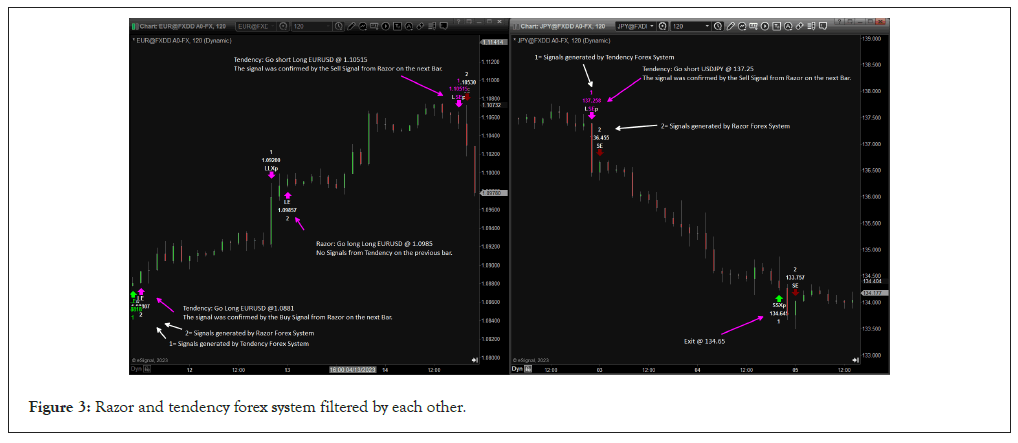
Figure 3: Razor and tendency forex system filtered by each other.
Statistical analysis part 1
SPSS 24.0 was used for statistical analysis. The studies’ parameters were displayed as Mean ± SD (Standard Deviation) for continuous variables. The comparison between the two groups was performed by t-test. The comparison between multiple groups was performed by paired samples t-test [7,8]. A P value <0.05 was considered statistically significant for all analysis (Tables 1-3).
| 2010 | 2011 | 2012 | 2013 | 2014 | 2015 | 2016 | 2017 | 2018 | 2019 | 2020 | 2021 | 2022 | Avg. | |
|---|---|---|---|---|---|---|---|---|---|---|---|---|---|---|
| Group1 | 6298 | 9211 | 6190 | 5978 | 4900 | 7033 | 8097 | 1432 | 4836 | 3073 | 7332 | 3113 | 5769 | 5635 |
| Group2 | 13129 | 14592 | 8097 | 7848 | 7261 | 10736 | 8247 | 5765 | 5575 | 2657 | 9377 | 4398 | 6949 | 8048 |
| Group3 | 9730 | 10221 | 6846 | 7366 | 6050 | 8215 | 9550 | 2282 | 5830 | 3846 | 7974 | 4329 | 8333 | 6967 |
| Group4 | 11300 | 10750 | 5302 | 6681 | 5648 | 9563 | 6154 | 7515 | 3619 | 2082 | 3961 | 3956 | 6448 | 6383 |
Table 1: Annualized return of different trading groups (USD).
| 2010 | 2011 | 2012 | 2013 | 2014 | 2015 | 2016 | 2017 | 2018 | 2019 | 2020 | 2021 | 2022 | Avg. | |
|---|---|---|---|---|---|---|---|---|---|---|---|---|---|---|
| Group1 | 1118 | 1116 | 1151 | 1189 | 893 | 1551 | 909 | 1233 | 771 | 774 | 742 | 1236 | 1270 | 1073 |
| Group2 | 1006 | 2447 | 1549 | 1858 | 1110 | 2385 | 1636 | 1533 | 1041 | 1069 | 1260 | 1158 | 1876 | 1533 |
| Group3 | 637 | 1050 | 865 | 968 | 789 | 1245 | 689 | 744 | 719 | 576 | 622 | 1028 | 855 | 830 |
| Group4 | 573 | 1367 | 623 | 547 | 342 | 1143 | 644 | 493 | 544 | 421 | 1029 | 518 | 536 | 675 |
Table 2: Annualized drawdown of different groups (close to close) (USD).
| Group | n | Before filtered | After filtered | t | P |
|---|---|---|---|---|---|
| Group 1 | 52 | 1408.87 ± 1102.38 | 1741.80 ± 1061.14 | 5.989 | 0 |
| Group 2 | 52 | 2012.11 ± 1540.15 | 1595.76 ± 1045.49 | 3.44 | 0.005 |
| t | - | 2.189 | 0.569 | - | - |
| P | - | 0.039 | 0.575 | - | - |
Table 3: Comparation of quarterly return among multiple groups.
Group 1: Tendency forex system (Tables 1-3)
Group 2: Razor forex system (Tables 1-3)
Group 3: Filtered tendency forex system (filtered by razor forex system) (Tables 1-3)
Group 4: Filtered razor forex system (filtered by tendency forex system) (Tables 1-3)
In the paired samples t-test, to increase the sample size, we used quarterly return as the data source (n=4 × 13=52) for the statistical analysis. Due to the large amount of raw data, they were not included in this paper. If needed, please contact the author for further verification.
The results of group comparison showed that before filtering, the difference between the two groups was statistically significant (p=0.039<0.05). After filtering, the difference between the two groups was not statistically significant (p=0.575>0.05). The difference in the first group before and after filtering was statistically significant (p=0.000<0.05), while the difference in the second group before and after filtering was also statistically significant (p=0.005<0.05) (Table 4).
| Group | n | Before filtered | After filtered | t | P |
|---|---|---|---|---|---|
| Group 1 | 13 | 1073.30 ± 240.40 | 829.83 ± 197.28 | 5.966 | 0 |
| Group 2 | 13 | 1532.79 ± 493.60 | 675.38 ± 305.93 | 8.766 | 0 |
| t | - | 3.017 | 1.53 | - | - |
| P | - | 0.006 | 0.139 | - | - |
Table 4: Comparation of annualized drawdown among multiple groups.
For the observation of drawdown, it is recommended to analyze it over a relatively long period. Using quarterly data may potentially divide some large drawdowns into 2-3 small values, so we still use the annual drawdown data for statistical analysis.
The results of group comparison showed that before filtering, the difference between the two groups was statistically significant (p=0.006<0.05). After filtering, the difference between the two groups was not statistically significant (p=0.139>0.05). The difference in the first group before and after filtering was statistically significant (p=0.000<0.05), while the difference in the second group before and after filtering was also statistically significant (p=0.005<0.05).
Python analysis
Python 3.11.4 was used to calculate the smoothness and the deviation degree of the equity curve of different groups (Figure 4) (Table 5) [9].
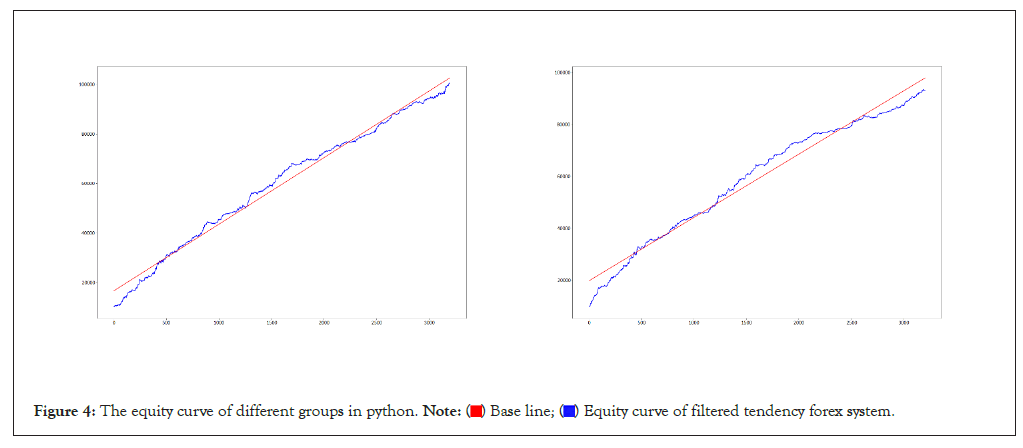
Figure 4: The equity curve of different groups in python. 
| Group | Smoothness | Deviation degree |
|---|---|---|
| Group 1 | 0.517521902377973 | 0.0546482910397301 |
| Group 2 | 0.519650655021834 | 0.0602633158438454 |
Note: The results showed that the smoothness of both groups is very close, but the deviation degree of group 2 is a little higher than that of group 1.
Table 5: The smoothness and the deviation degree of the equity curve of different.
Group 1: Filtered tendency forex system (filtered by razor forex system) (Table 5)
Group 2: Filtered razor forex system (filtered by tendency forex system) (Table 5)
Statistical analysis part 2
The method is the same as part 1.
Group 1: Tendency forex system (Tables 6-14)
| 2010 | 2011 | 2012 | 2013 | 2014 | 2015 | 2016 | 2017 | 2018 | 2019 | 2020 | 2021 | 2022 | Avg. | |
|---|---|---|---|---|---|---|---|---|---|---|---|---|---|---|
| Group1 | 3498 | 1178 | 1617 | -510 | 1695 | 3500 | 2355 | 486 | 2961 | 882 | 2154 | 1451 | 830 | 1700 |
| Group2 | 4966 | 750 | 2316 | 595 | 2325 | 3817 | 2981 | 1015 | 2853 | 1060 | 2219 | 1585 | 1404 | 2145 |
Table 6: EUR/USD-annualized return of different groups (USD).
| 2010 | 2011 | 2012 | 2013 | 2014 | 2015 | 2016 | 2017 | 2018 | 2019 | 2020 | 2021 | 2022 | Avg. | |
|---|---|---|---|---|---|---|---|---|---|---|---|---|---|---|
| Group1 | 650 | 1297 | 712 | 1180 | 309 | 292 | 505 | 630 | 332 | 220 | 503 | 294 | 562 | 576 |
| Group2 | 448 | 1195 | 668 | 835 | 309 | 300 | 418 | 459 | 210 | 216 | 387 | 292 | 495 | 479 |
Table 7: EUR/USD-annualized drawdown of different groups (USD).
| 2010 | 2011 | 2012 | 2013 | 2014 | 2015 | 2016 | 2017 | 2018 | 2019 | 2020 | 2021 | 2022 | Avg. | |
|---|---|---|---|---|---|---|---|---|---|---|---|---|---|---|
| Group1 | 501 | 4424 | 889 | 1104 | 823 | 1112 | 1176 | 424 | 1051 | 982 | 2163 | 617 | 1078 | 1257 |
| Group2 | 1583 | 4635 | 1133 | 1433 | 1122 | 1554 | 1725 | 992 | 1227 | 1330 | 2170 | 870 | 2403 | 1706 |
Table 8: USD/CHF-annualized return of different groups (USD).
| 2010 | 2011 | 2012 | 2013 | 2014 | 2015 | 2016 | 2017 | 2018 | 2019 | 2020 | 2021 | 2022 | Avg. | |
|---|---|---|---|---|---|---|---|---|---|---|---|---|---|---|
| Group1 | 1059 | 628 | 834 | 698 | 318 | 934 | 756 | 785 | 979 | 533 | 302 | 517 | 868 | 708 |
| Group2 | 613 | 628 | 499 | 492 | 270 | 856 | 598 | 563 | 753 | 434 | 255 | 269 | 411 | 511 |
Table 9: USD/CHF-annualized drawdown of different groups (USD).
| 2010 | 2011 | 2012 | 2013 | 2014 | 2015 | 2016 | 2017 | 2018 | 2019 | 2020 | 2021 | 2022 | Avg. | |
|---|---|---|---|---|---|---|---|---|---|---|---|---|---|---|
| Group1 | 879 | 3734 | 2707 | 1795 | 1331 | 1563 | 1336 | -306 | 304 | 502 | 2008 | 361 | 903 | 1317 |
| Group2 | 1757 | 4603 | 2666 | 1528 | 1435 | 1505 | 1506 | -182 | 894 | 518 | 2310 | 781 | 1360 | 1591 |
Table 10: AUD/USD-annualized return of different groups (USD).
| 2010 | 2011 | 2012 | 2013 | 2014 | 2015 | 2016 | 2017 | 2018 | 2019 | 2020 | 2021 | 2022 | Avg. | |
|---|---|---|---|---|---|---|---|---|---|---|---|---|---|---|
| Group1 | 494 | 614 | 477 | 514 | 641 | 967 | 334 | 872 | 662 | 391 | 332 | 1570 | 718 | 660 |
| Group2 | 370 | 359 | 347 | 462 | 465 | 916 | 318 | 718 | 494 | 352 | 310 | 1076 | 527 | 516 |
Table 11: AUD/USD-annualized drawdown of different groups (USD).
| 2010 | 2011 | 2012 | 2013 | 2014 | 2015 | 2016 | 2017 | 2018 | 2019 | 2020 | 2021 | 2022 | Avg. | |
|---|---|---|---|---|---|---|---|---|---|---|---|---|---|---|
| Group1 | 1420 | -125 | 977 | 3588 | 1052 | 857 | 3230 | 828 | 521 | 706 | 1008 | 684 | 2958 | 1362 |
| Group2 | 1424 | 234 | 731 | 3810 | 1168 | 1339 | 3337 | 458 | 856 | 938 | 1276 | 1094 | 3166 | 1525 |
Table 12: USD/JPY-annualized return of different groups (USD).
| 2010 | 2011 | 2012 | 2013 | 2014 | 2015 | 2016 | 2017 | 2018 | 2019 | 2020 | 2021 | 2022 | Avg. | |
|---|---|---|---|---|---|---|---|---|---|---|---|---|---|---|
| Group1 | 373 | 1218 | 293 | 282 | 311 | 555 | 312 | 536 | 410 | 522 | 520 | 361 | 479 | 475 |
| Group2 | 335 | 931 | 234 | 212 | 274 | 496 | 309 | 430 | 363 | 391 | 463 | 312 | 460 | 401 |
Table 13: USD/JPY-annualized drawdown of different groups (USD).
| Group 1 | Group 2 | t | p | ||
|---|---|---|---|---|---|
| EURUSD | Return | 1699.65 ± 1183.81 | 2144.95 ± 1280.93 | -3.193 | 0.008 |
| Drawdown | 575.78 ± 334.13 | 479.39 ± 277.87 | 3.463 | 0.005 | |
| USDCHF | Return | 1257.32 ± 1042.94 | 1705.85 ± 985.07 | -4.364 | 0.001 |
| Drawdown | 708.36 ± 239.50 | 510.79 ± 184.95 | 4.827 | <0.001 | |
| AUDUSD | Return | 1316.65 ± 1085.65 | 1590.88 ± 1165.59 | -2.793 | 0.016 |
| Drawdown | 660.38 ± 334.33 | 516.36 ± 242.05 | 4.035 | 0.002 | |
| USDJPY | Return | 1361.85 ± 1144.29 | 1525.50 ± 1149.15 | -2.387 | 0.034 |
| Drawdown | 474.93 ± 244.69 | 400.66 ± 182.81 | 3.711 | 0.003 |
Note: The results showed that before and after filtering, the differences in each group were statistically significant (P<0.05).
Table 14: Paired samples t-test of all the pairs in different groups (USD).
Group 2: Filtered tendency forex system (filtered by razor forex system) (Tables 6-14)
We compared the annualized return and drawdown of all the pairs in group 1 and group 2 (Tables 6-14).
The results of statistical analysis part 1
The results of statistical analysis part 1 showed that:
• Razor forex system vs. Tendency forex system
Return was higher, but drawdown was also higher, and the difference was statistically significant.
• Filtered tendency forex system vs. Tendency forex system
Return was higher, drawdown was lower, and the difference was statistically significant.
• Filtered razor forex system vs. Razor forex system
Return was slightly lower, drawdown was lower, and the difference was statistically significant.
• Filtered tendency forex system vs. Filtered razor forex system
Return and drawdown were basically equivalent, and the difference was not statistically significant.
The results of python analysis
The results of python analysis showed that the deviation degree of the filtered tendency forex system was a little-lower than that of the filtered razor forex system, indicating potential higher stability.
The results of statistical analysis part 2
The results of statistical analysis part 2 showed that in the filtered tendency forex system, the return of each currency pair was higher than that before filtering, and the drawdown was lower than that before filtering, and the difference was statistically significant.
Considering the trading logic
Considering the trading logic, the tendency forex system could identify potential trading opportunities earlier than the razor forex system. The system had been applied to real-time trading for a long time without any logical expression bugs. The results of both realtime trading and back-testing were completely consistent regardless of profit or loss.
Therefore, the filtered tendency forex system was selected as the preferred trading system, with the filtered razor forex system as a supplement when necessary.
Filtered tendency forex system: Detailed back-testing parameters
Filtered tendency forex system: Detailed back-testing parameters in 13 years.
Fixed 0.1 standard lot per trade on $ 10k initial balance.
Average annualized return: 6967 USD
Peak close to close drawdown: 1244 USD (From Jan 22, 2015 to March 04, 2015)
Gross win: 245272 USD
Gross loss: 154699 USD
Profit factor: 1.58
Winning rates: 45.34%
Total trades: 10119 (2235 trades were filtered out)
Expected payoff: 8.95 USD (Figure 5) (Tables 15 and 16).
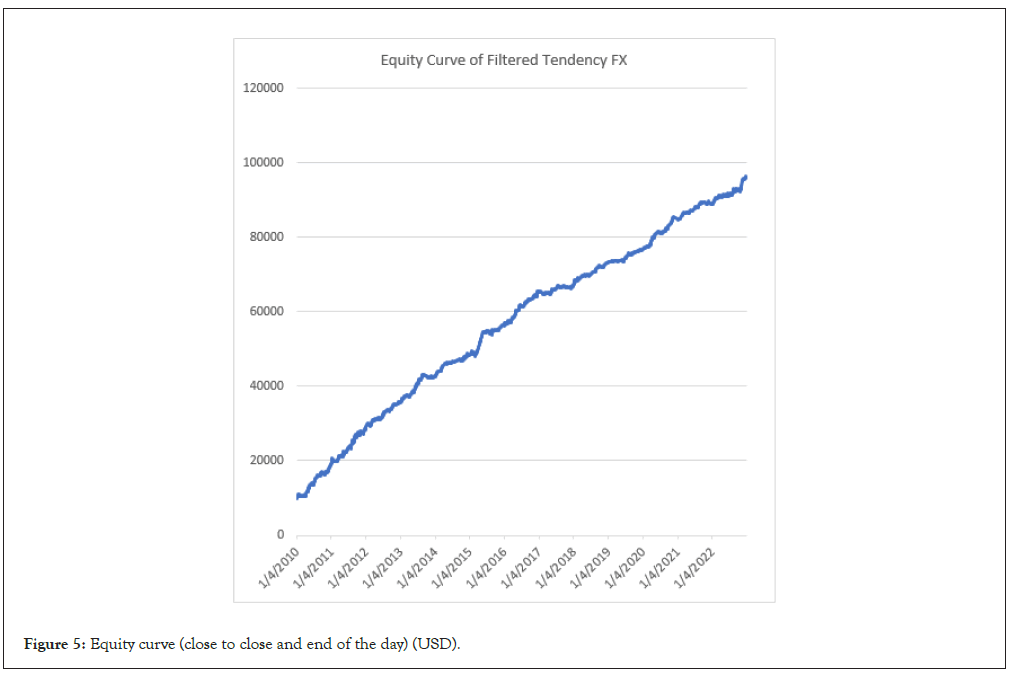
Figure 5: Equity curve (close to close and end of the day) (USD).
| 2010 | 2011 | 2012 | 2013 | 2014 | 2015 | 2016 | 2017 | 2018 | 2019 | 2020 | 2021 | 2022 | |
|---|---|---|---|---|---|---|---|---|---|---|---|---|---|
| Jan | 601 | 880 | 1150 | 1291 | 1263 | 640 | 276 | -154 | 937 | 353 | 492 | 337 | 1412 |
| Feb | 271 | 198 | 62 | 643 | 124 | -653 | 449 | -430 | 617 | 238 | 490 | 1292 | 299 |
| March | 22 | 1044 | 633 | -130 | 1473 | 1877 | 1129 | 479 | 1056 | 57 | 966 | 169 | 371 |
| April | 1388 | 215 | 414 | 694 | 467 | 2667 | 1675 | -91 | 92 | 88 | 1643 | 226 | 368 |
| May | 1629 | 395 | 172 | 1144 | 320 | 1224 | 186 | 1096 | 578 | 446 | 529 | 377 | -186 |
| June | 436 | 1298 | 1235 | 1702 | -15 | 316 | 773 | 406 | -63 | 357 | 388 | 1017 | 411 |
| July | 1719 | -75 | 1066 | 1142 | 369 | -173 | 960 | 641 | 503 | 742 | 98 | 181 | 96 |
| Aug | 270 | 2712 | -22 | 1197 | 320 | 512 | 879 | -341 | 1017 | 188 | 523 | 990 | 1373 |
| Sep | 500 | 1455 | 584 | -376 | -208 | 334 | 486 | 10 | 555 | 524 | 1223 | 364 | 73 |
| Oct | -27 | 1181 | 1069 | -168 | 1502 | -215 | 650 | -97 | -489 | 505 | 616 | -172 | 973 |
| Nov | 898 | -84 | 311 | -179 | 79 | 750 | 1037 | 33 | 634 | 73 | 1129 | 224 | 1953 |
| Dec | 2025 | 1002 | 172 | 406 | 355 | 938 | 1051 | 732 | 393 | 274 | -124 | -676 | 1189 |
| Total | 9730 | 10221 | 6846 | 7366 | 6050 | 8215 | 9550 | 2282 | 5830 | 3846 | 7974 | 4329 | 8333 |
Table 15: Monthly return during the back-testing period (USD).
| Peak | Trough | Drawdown | ||
|---|---|---|---|---|
| Time | Equity | Time | Equity | 1244.59 |
| 2015/01/22 | 41272.59 | 2015/03/04 | 40028 | |
Table 16: Peak close to close drawdown (USD).
Drawdown control
In this article, VBA programming in microsoft excel 2019 was used to calculate the peak drawdown. As eSignal does not support backtesting of multiple symbols and multiple timeframes at the same time, we can only get the peak close to close drawdown. However, according to the data of every symbol, the peak floating drawdown was 1.2-1.4 times of peak close to close drawdown, no higher than 1.5 times. The highest peak close to close drawdown of the filtered tendency forex system was 1244 USD. We assume the peak floating drawdown is 1866 USD (1.5 × peak DD). Compared with the average annualized return (6967 USD), the risk reward is nearly 1:3.7.
Multiple timeframes
How to identify potential inflection points on different timeframes in an early stage is an eternal theme for traders. The tendency forex system and razor forex system have highly quantified many classic indicators. From the logic perspective, if combining the chart patterns on the daily timeframe, the effectiveness will be even better [10-12]. For example, if a sell signal was flagged after a bearish key day reversal or a rising wedge with downside resolved, it should be a highly convincing trading opportunity. We could increase the volume if necessary.
The change of return
Starting from 2016, the annualized return in back-testing has shown a pattern of “slightly higher in one year, slightly lower in the following year”. This may be related to the changing rhythm of the market (clear trend in one year, consolidation in the next year). Therefore, starting from any time point, measuring the performance of the trading system on a 2-year cycle is more appropriate.
Over-optimization
No over optimization in both tendency forex system and razor forex system. All the indicators are working with default settings.
In order to pursue the results of back-testing one-sidedly, some indicators of the trading system are over optimized, resulting in a “high degree of fit to historical data”, which is one of the important reasons why many trading systems are eventually eliminated.
Futures and other symbols
The filtered tendency forex system can also work well on gold, silver, oil, USD/CNH, euro futures, Australian dollar futures, Swiss franc futures, Japanese futures. However, they are not included in my spot forex trading portfolio. This topic is also not discussed in this article.
• Tendency forex system filtered by razor forex system: The trading signal can be directly used in real-time trading.
• Razor forex system filtered by tendency forex system: The trading signal can be used as a reliable back-testable indicator.
• It is advisable to explore strategies for cross pairs, such as AUD/NZD, EUR/GBP, and fully hedge the risk of the US dollar when necessary.
• Both tendency forex system and razor forex system are created from the technical perspective only. If combined effectively with fundamental analysis, we can gain a better and more comprehensive understanding of the market.
The fundamental views require confirmation through technical analysis; otherwise, the results of fundamental analysis are likely to be incorrect. The technical views require support from fundamental analysis; otherwise, they could be false signals or the trend could not develop well.
I am extremely grateful to my wife, Flora ZH. The process of learning trading has been exceptionally challenging, and the path to making a living through trading has been filled with obstacles. However, what has remained constant is her encouragement and trust in me.
I am deeply thankful to my parents. Our family was very poor when I was young. However, they not only taught me through their words and actions in order to shape me into a person with a strong sense of justice and integrity, but also they financially supported my education and life through pinching and scraping. Besides, they encouraged and developed various interests for me, enabling me to acquire not only a wealth of knowledge but also the ability to learn and absorb various types of knowledge. Ultimately, I became a trader from a surgeon.
Finally, I express my gratitude to all those who have supported and helped me all these years.
Citation: Wang Y (2024) Razor Forex System: Backtesting and the Combination with Tendency Forex System. J Stock Forex. 11:250
Received: 30-Jan-2024, Manuscript No. JSFT-23-27921; Editor assigned: 02-Feb-2024, Pre QC No. JSFT-23-27921 (PQ); Reviewed: 16-Feb-2024, QC No. JSFT-23-27921; Revised: 23-Feb-2024, Manuscript No. JSFT-23-27921 (R); Published: 01-Mar-2024 , DOI: 10.35248/2168-9458.24.11.250
Copyright: © 2024 Wang Y. This is an open-access article distributed under the terms of the Creative Commons Attribution License, which permits unrestricted use, distribution and reproduction in any medium, provided the original author and source are credited.