Journal of Clinical and Experimental Ophthalmology
Open Access
ISSN: 2155-9570
ISSN: 2155-9570
Research Article - (2021)
Background: Retinitis Pigmentosa (RP) is characterized by changes in the outer retina as well as the choroid. In this study, we sought to further elucidate the longitudinal relationship between the preserved Ellipsoid Zone (EZ) area and choroidal parameters, in particular the Choroidal Vascularity Index (CVI).
Patients and methods: Spectral Domain OCT (SD-OCT) volume scans of 48 eyes of 24 subjects with autosomal dominant RP (ADRP) were collected retrospectively at baseline and month 12. Spectralis Heidelberg Retinal Angiogram (HRA+OCT) scans (20*20 degrees;512*97;ART=5) were acquired at both visits. A previously described and validated Doheny Image Reading Center (DIRC) OCT grading software (OCTOR) was used to manually delineate the inner and outer boundaries of the EZ layer and the choroid. The sub foveal choroidal thickness (CT) was manually calculated and the CVI was measured. The parameters were compared and correlated at baseline and month 12 using paired t-tests and bivariate correlations.
Results: The mean preserved EZ area (P=0.02) and the mean CT (P=0.007) showed a significant decline from baseline to month 12, but no correlation was noted between them. There was no significant difference in CVI from baseline to month 12. Despite these results, the loss of preserved EZ area was seen to be correlated to the CVI at both the baseline and month 12.
Conclusion: The rate of disease progression, as assessed by loss of EZ, was correlated with CVI. These observations highlight the relevance of choroidal alterations in the progression of RP.
Autosomal Dominant Retinitis Pigmentosa; Choroidal Vascularity Index; Preserved Ellipsoid Zone Area; Spectral Domain OCT
CT: Choroidal Thickness; CVI: Choroidal Vascularity Index; EZ: Ellipsoid Zone
Retinitis Pigmentosa (RP) refers to a group of inherited disorders that cause gradual deterioration of the photoreceptors and the Retinal Pigment Epithelium (RPE) leading to progressive and profound visual loss. Rods are involved earlier and more severely than cones [1]. Autosomal Dominant RP (ADRP) represents between 15% and 35% of all cases, with the highest proportion of cases found in the US [2].
The rate of deterioration of visual function in RP is variable but generally slows, especially in ADRP, whereas the X-linked variety is generally the most severe and rapidly progressive variant of the disease [3]. The clinical assessment of disease progression over time can therefore be challenging. Investigators have attempted to quantify the changes in the outer retinal structures in these patients with the help of tools like spectral domain-optical coherence tomography (SD-OCT) [4,5]. The ellipsoid zone (EZ), previously termed the inner segment/outer segment [IS/OS] line, in particular has been advanced as a useful structure to track the progression of RP as its disappearance marks the boundary between healthy and unhealthy retina in these patients [6]. The changes seen in the EZ have been found to correlate well with changes in the visual fields and visual acuity; thus the EZ has been touted as a reliable surrogate marker for overall disease progression [7,8]. Whereas Birch and colleagues measured the width of the EZ on a single central B-scan, Hariri et al. later expanded on this concept by measuring the preserved EZ area on en-face OCT images [9].
Although the photoreceptors and RPE have been the primary cells of interest in most studies of RP, histological studies have shown that significant changes can occur in the choroidal vessels in patients with RP [10]. It has been postulated that RPE cell loss leads to secondary atrophy of choroidal vessels [11]. The choroidal and retinal blood flow velocity and vessel diameters are known to be reduced in patients with RP, [12] and this has been investigated with fundus fluorescein angiography, indocyanine green angiography, high resolution magnetic resonance imaging and SD-OCT [13-16]. A variety of choroidal parameters, including choroidal thickness (CT) and choroidal vascularity index (CVI), have been proposed for study in RP. Recently, Liu et al. studied the changes in segmented choroidal vessel density in such eyes [17].
The CVI, defined as the proportion of the luminal area to the total choroidal area, is purported to be a useful parameter to characterize the status of choroid in various systemic and ocular diseases [18]. It has been studied recently in diseases such as agerelated macular degeneration [19], diabetic retinopathy [20], Vogt- Koyanagi Harada disease [21], central serous chorioretinopathy [22], and retinitis pigmentosa. Tan et al. reported a significant decrease in the mean CVI in eyes with RP as compared to normal eyes. Although this was the first report analyzing the choroidal vascular changes in these patients, a few other studies reported CT measurements in RP with inconsistent results. Whereas Tan and colleagues reported a greater mean subfoveal CT in eyes with RP, others have noted either no difference [23] or a lower mean CT in their studies. There have been, however, few studies that have linked these choroidal parameters to the progression of RP. Thus, in this report we evaluate the relationship between CVI and the progression of RP as assessed by preserved EZ area.
This was a retrospective analysis of 48 eyes of 24 patients. Data collection and analyses were approved by the Institutional Review Board of the University of California Los Angeles and the research adhered to the tenets set forth in the Declaration of Helsinki [24].
SD-OCT volume scans (Spectralis, Heidelberg Engineering Inc., Germany) of patients with ADRP were collected from the anonymized Doheny Image Reading Center (DIRC) database. These patients were diagnosed with RP based on the clinical presentation of gradual decrease in vision, night blindness and reduced field of vision; and fundus features of disc pallor, vascular narrowing, and bony pigmented spicules. The diagnosis was confirmed with electroretinogram and visual field testing. The genetic testing confirmed the autosomal dominant pattern of inheritance in all these patients.
SD-OCT scans were acquired using a macular volume scan protocol (20*20 degree;512 A-scans;97 B-scans in each A-scan, ART [automatic real-time, averaging]=5), and were obtained at baseline and month 12. The raw data from the OCT scans were collected and imported into previously described and validated 3D-OCTOR software by Doheny Image Reading Center [25]. The inner and outer borders of the choroid were segmented automatically in each B-scan of the macular volume as discussed in the next section. Images with poor quality were not included in the analysis.
Choroidal thickness measurement
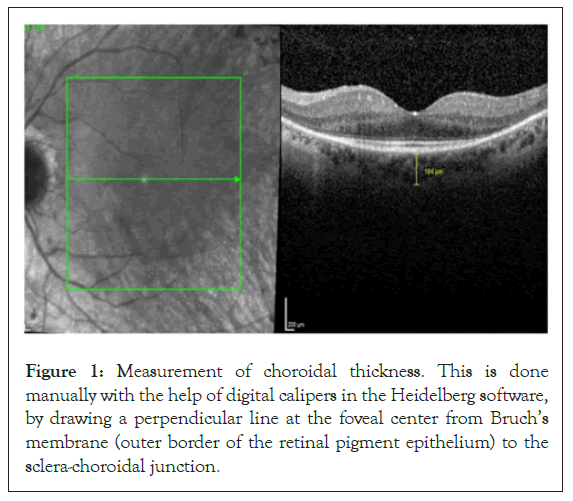
The OCT scans were imported into HEYEX software (Heidelberg Engineering Inc., Germany) and the CT (μm) was measured manually by digital calipers (Figure 1), by drawing a perpendicular line at the foveal center from Bruch’s membrane (outer border of the retinal pigment epithelium, RPE) to the sclera-choroidal junction. We have recently reported the high repeatability of CT measurements using this approach [26]. The vertical to horizontal scale ratio was adjusted to 1:1 μm for CT calculation. CT measurement was not possible in 12 eyes of 6 patients due to a poorly demarcated sclera-choroidal junction. Thus, the CT was measured in 36 eyes of 18 patients.

Figure 1: Measurement of choroidal thickness. This is done manually with the help of digital calipers in the Heidelberg software, by drawing a perpendicular line at the foveal center from Bruch’s membrane (outer border of the retinal pigment epithelium) to the sclera-choroidal junction.
Ellipsoid zone area measurement
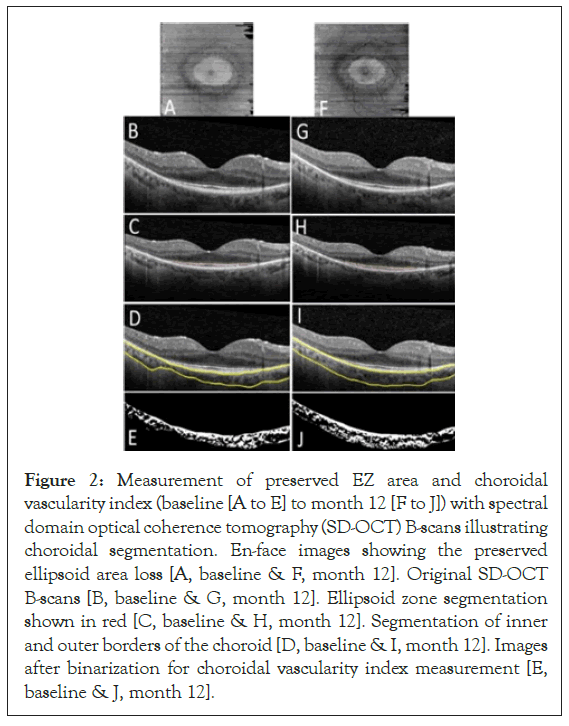
The Heidelberg Spectralis SD-OCT scans were imported into OCTOR software. The inner and outer boundaries of the EZ layer and the inner boundary of the RPE were manually delineated to compute the EZ area using the volume scans (Figure 2).

Figure 2: Measurement of preserved EZ area and choroidal vascularity index (baseline [A to E] to month 12 [F to J]) with spectral domain optical coherence tomography (SD-OCT) B-scans illustrating choroidal segmentation. En-face images showing the preserved ellipsoid area loss [A, baseline & F, month 12]. Original SD-OCT B-scans [B, baseline & G, month 12]. Ellipsoid zone segmentation shown in red [C, baseline & H, month 12]. Segmentation of inner and outer borders of the choroid [D, baseline & I, month 12]. Images after binarization for choroidal vascularity index measurement [E, baseline & J, month 12].
Choroidal vascularity index analysis
To calculate the CVI (Figure 2), we adopted the protocol previously described by Tan. Key features of this protocol included de-noising the OCT images with block-matching and 3D filtering algorithm, automated segmentation of the inner and outer boundaries of the choroid, and automated binarization of the choroid using an exponential and non-linear enhancement function followed by a thresholding operation [27-30]. Binarization essentially divides all pixels on the OCT B-scan of the choroid into stroma or vessels. In accordance with previous reports, the CVI was computed using a single B scan passing through the foveal center. The CVI derived from this single B-scan has been shown to be a good approximation of the CVI from the entire macular volume [31].
To calculate the CVI, the choroidal vascular area (all pixels deemed to be vessels after the binarization) is divided by the total choroidal area (μm 2) on the B-scan. The remaining non-vessel pixels may be summed to compute a stromal area.
Eight eyes of 4 patients were excluded from the CVI analysis as the visualization of the outer border of the choroid was too poor to allow reliable segmentation of the choroid. Thus, 40 eyes of 20 patients were included in the final CVI computation.
All statistical analyses were performed using SPSS (ver.18) to evaluate for longitudinal changes. The CVI and EZ area measurements were compared and correlated at baseline and month 12 using paired t-tests and bivariate correlations (Pearson’s). A P value<0.05 was considered significant.
The study cohort included 48 eyes of 24 patients; however, CVI was calculated in 40 eyes of 20 patients. These patients were followed for a minimum period of 1 year.
Longitudinal analysis
The mean preserved EZ area showed a significant reduction from baseline (2.42+2.54 mm2) to month 12 (2.10+2.42 mm2,P=0.02). Similarly, there was a statistically significant reduction in the mean CT from baseline (170.3+51.1 μm) to month 12 (156.9+43.2 μm,P=0.007). The CVI (56.59+6.6% at baseline, 57.16+6.3% at month 12;P=0.5), however showed no significant changes over the same period (Table 1).
| Parameters mean+SD (range) | Baseline | Month 12 | p value |
|---|---|---|---|
| Preserved EZ area (mm2) | 2.42 ± 2.54 | 2.10 ± 2.42 | 0.02 |
| (0.11-11.1) | (0.24-14.64) | ||
| CVI (%) | 56.59 ± 6.6 | 57.16 ± 6.3 | 0.5 |
| (44.0-76.0) | (41.0-68.0) | ||
| CT (µm) | 170.3 ± 51.1 | 156.9 ± 43.2 | 0.007 |
| (115–326) | (95–273) |
Table 1: Shows the comparison of the preserved EZ area (mm2), the CVI (%), and CT (μm) from baseline to month 12 (Statistical significance p<0.05).
Correlation analysis
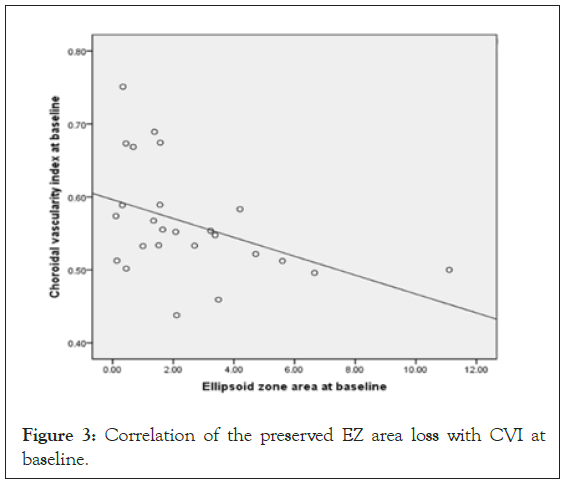
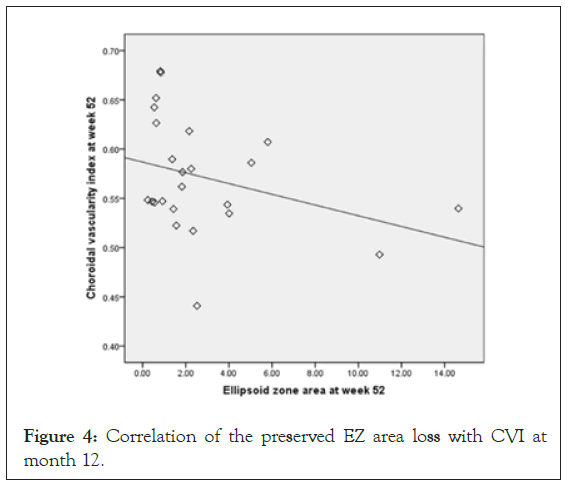
The mean preserved EZ area was noted to correlate with the CVI at both baseline (r=-0.51; P=0.01) (Figure 3) and month 12 (r=- 0.43; P=0.04) (Figure 4), but not with the mean CT (baseline: r=0.18,P=0.45; month 12:r=-0.02,P=0.92). Over the 12-month follow-up period, the mean change in the area of preserved EZ showed no correlation with the CT (r=0.05,P=0.85) or the CVI (r=-0.19;P=0.41).

Figure 3: Correlation of the preserved EZ area loss with CVI at baseline.

Figure 4: Correlation of the preserved EZ area loss with CVI at month 12.
The clinical features of RP are most prominently related to alterations in the outer retina (RPE and the photoreceptor layer) [32]. Studies have also revealed a reduction in the cho-roidal and retinal blood flow velocity and vascular diameter in these eyes. Some investigators have suggested that the photoreceptor damage observed in these patients may be related to this vascular dysfunction [33]. The choroid has been a topic of recent interest in patients with RP, as studies have shown a relationship between photoreceptor and RPE atrophy and choroidal vascular loss. In our study, we explored this relationship further by correlating the preserved EZ areas with choroidal parameters including the CVI.
This study demonstrated a statistically significant loss in the preserved EZ area (signifying outer retinal atrophy) as well as the subfoveal CT (signifying the loss of choroid) in these eyes over a period of 1 year. Of note, we did not observe a significant change in the CVI over this same period. Previous studies of CT in RP eyes have largely been cross-sectional and have yielded inconsistent results. Tan et al. reported a greater mean subfoveal CT13 in RP eyes compared to normal eyes, whereas others noted either no difference or a lower mean CT. Possible explanations for these inconsistencies may be the varying stage of disease and different inheritance patterns and underlying genetic defects when the study was being conducted. In addition, CT may vary due to various ocular and systemic factors [34]. Thus CT on its own may not be a robust parameter to characterize choroidal changes observed in these individuals, and therefore we analyzed the changes occurring in the whole choroidal tissue, as discussed subsequently.
The CVI may be a more stable parameter and has been suggested to be useful for characterizing the status of the choroid in various disease processes, as it encompasses the whole choroid and changes taking place in this vascular tissue. Although our study showed a marginal increase in the CVI (%mean+SD) from baseline (56.59+6.6) to month 12 (57.16+6.3), this increase was not found to be significant. The mean loss of the preserved EZ area over 12 months significantly correlated with the mean CVI at both baseline (r=-0.51;P=0.01) and at month 12 (r=- 0.43;P=0.04). Specifically, a greater loss in the EZ over time was associated with a lower CVI at any point. A lower CVI indicates a reduced vascular component of the choroid, highlighting the relevance of the choroidal vasculature in the progression of the retinal degeneration. Unfortunately, the identification of this association does not allow us to infer any causality. For example, while it is possible that the loss of choroidal vasculature may compromise the RPE and photoreceptors and accentuate the degeneration, it is equally possible that the progressive outer retinal and RPE degeneration results in loss of the basal RPE production of vascular endothelial growth factor thought to be essential for maintenance of the choriocapillaris and choroidal vasculature.
The mean change in the area of preserved EZ did showed no correlation with the CT or the CVI over the 12 months of this study. This may stem from the differential speed and the extent of changes taking place within these structures over a period of time. As the outer retinal atrophy sets in, the initial response of the choroidal tissue under such conditions may be to try to increase the blood flow to these degenerating areas to support the dying outer retina (compensated stage). Over time, because of the lack of regenerative capacity of the choroid or the gradual progression of the disease process, irreversible choroidal atrophy (decompensated stage) may ensue, resulting in reduced overall choroidal area (with reduction in both the choroidal vessel lumina and the stroma). Tan et al. have postulated that all the vessel layers in the choroidal tissue undergo atrophy in eyes with RP, with a resultant remodeling taking place in the choroidal stroma.
Presently, the exact and sequential changes taking place in choroid are yet to be demonstrated in eyes with RP. While a reduced choroidal vessel density in the segmented choroid was observed by Liu et al. in eyes with RP, they demonstrated a significant relationship between choriocapillaris-Sattler’s layer and EZ measurements, as well as clinical parameters like vision and visual fields. We analyzed the CVI in our study to encompass the overall changes that might take place in eyes with the subgroup of ADRP, as the disease progression is slow in such eyes. It appears that the initial changes may commence in the inner choroidal layers subsequently involving the whole choroidal tissue, but such results are yet to be proven with longitudinal studies.
There are several limitations of our study to be considered when assessing our results. First, our analysis is retrospective and posthoc in nature, and is thus subject to selection bias. The patients were not categorized based on onset, severity, duration, or underlying genetic mutation. RP is a group of allied disorders with substantial phenotypic and genotypic heterogeneity, even when restricting to this autosomal dominant subset. A second limitation of our study is that we did not have enhanced depth imaging-OCT scans. As signal strength is known to fall off with depth in SD-OCT images, this may have interfered with our quantitative choroidal assessments, particularly in individuals with thicker choroids. In addition, our CT assessment was only performed at a single location in the foveal center. Measurement of CT under areas with and without overlying photoreceptor loss may have yielded different results. Also, analysis of various choroidal layers might have shown differential changes in outer and inner choroid. Even though a period of 1 year seams less for analyzing structural changes in patients with ADRP, a pattern could be established in this study which may pave way for further studies with larger follow up periods.
The strengths of this study include the inclusion of a subset of patients with RP (ADRP), and longitudinal analysis. In summary, we observed that CVI was correlated with loss of the EZ over a 12-month period in eyes of patients with ADRP. Our findings further highlight the relevance of the choroidal vasculature in RP and may yield biomarkers which may aid in identifying patients who are at greater risk for more rapid progression. This may have implications for patient prognostication and for identifying subjects for future therapeutic trials.
Citation: Verma A, Velaga S, Gupta Nittala M, Baker K, Huang X, Chhablani J, et al. (2021) Relationship between Preserved Ellipsoid Zone Area and Choroidal Vascularity Index in Autosomal Dominant Retinitis Pigmentosa. J Clin Exp Ophthalmol. S13:001.
Received: 11-Mar-2021 Accepted: 26-Mar-2021 Published: 02-Apr-2021 , DOI: 10.35248/2155-9570.21.s13.001
Copyright: © 2021 Verma A, et al. This is an open-access article distributed under the terms of the Creative Commons Attribution License, which permits unrestricted use, distribution, and reproduction in any medium, provided the original author and source are credited.