Journal of Geography & Natural Disasters
Open Access
ISSN: 2167-0587
ISSN: 2167-0587
Research Article - (2024)Volume 14, Issue 1
Many governments and developmental organizations disseminated millions of cash for reducing the impact of food insecurity in developing countries including Ethiopia. Mekiet is one districts in Amhara region which is highly prone to food insecurity. At present, one solutions to reduce food insecurity is building resilience at households’ level. Therefore, this study aims to address the rural household resilience to food insecurity in Mekiet district. Cross sectional research design was conducted in two agro ecological zones of Mekiet district from lowland and midland involving 228 respondents. The study employed quantitative and qualitative approach. Multi-stage sampling techniques were employed to select sample households. Factor analysis was employed to analyze the data. The result from factor analysis using Technical Assistance to Nongovernmental Organization approach showed that the latent variables of absorptive and adaptive capacity have a load of 0.98 and 0.79 respectively. On the other hand, transformative capacity is found to be a negative load (-0.78), all variables are found to be statistically significant. The mean household resilience capacity index are 0.51. The variables of absorptive and adaptive capacities are positively associated with household resilience capacity. In contrast, transformative capacity is found to be a strong negative load. All those loads are significant with absolute value of factor loadings greater than 0.364 which is recommended for sample size of 200 and above. Those variables are also highly correlated with resilience capacity. The study recommends, resilience programs should be implementing at district, community, and households levels to enhance resilience to food insecurity.
Resilience; Food insecurity; Rural household; Mekiet; Ethiopia
Food security developed as an issue of importance in the mid- 1970s at the World Food Conference of 1974, which was initiated in response to the global food crisis [1]. Since, it has to be remained among the center of concern and attention for global, national, and local communities and institutions, achieving food security remains to be a challenge at all levels [2,3]. As implicated, the report of FAO shows that 768 million people were faced hunger around the world in 2020, 118 million more people were facing hunger in 2020 than in 2019 and the report provides global hunger, malnutrition, and food insecurity are serious problems in the world [4]. In addition, more than one-third 282 million, people in Africa were faced hunger. The same report indicates that the total number of undernourished people in Sub-Saharan Africa continues to increase from time to time [3].
Ethiopia is among the countries in Sub-Saharan Africa, which has been repeatedly mentioned in linking with chronic and transitory food insecurity problem [2,3]. In the same way, according to Mohamed, food security situation in Ethiopia is highly linked to recurring food shortages and famine in the country, which is associated with recurrent drought [5]. More than 41% of the Ethiopian population lives below the poverty line and above 31 million people are undernourished [6-8].
A study by Negash noted that Amhara region is one of the most food insecure affected region in Ethiopia [9]. In line with this, Kasie reported that Amhara region was primarily suffers from recurrent droughts and chronically food insecure [10]. Another study by Goshu and highlighted that Amhara regional state, is the 2nd populous regional state after Oromia in Ethiopia and has the highest prevalence of food insecurity, where the study was conducted on determinants of rural food security in North Wollo zone of Amhara Regional State [11]. The North Wollo zone is categorized as food insecure and the average agricultural production of the area is sufficient for only nine months Aragie et al, it is classified into ten rural districts, where eight out of its ten rural districts are the most drought-prone and food insecure communities where the study area, Mekiet district is one of them [12].
Furthermore, more recently a new organizing concept called resilience to food insecurity has emerged and gaining wider attention [13-16]. It aims at measuring the capability of systems such as households to absorb the negative effects of unpredictable shocks, rather than predicting the occurrence of a crisis [17]. Recognizing the attention of this new concept Constas and Barrett, reveals that rapid and widespread embrace of the resilience concept indicates how it is being taken as one of the key solutions to poverty and food insecurity [13]. Hence, resilience builds the capacity of the household to maintain a certain level of well-being (for example, food security) withstanding shocks and stresses [18,19]. Therefore, this study aimed to investigate rural household resilience to food insecurity in Mekiet district.
The Study area
The study was conducted in Mekiet district, North Wollo zone, Amhara national regional state, Northeast part of Ethiopia and 656 km far from the capital city of Addis Ababa and 159 km far from a regional city Bahir Dar. The district is bordered on the South by the Dawunt district and Wadila district, on the West by Lay Gayint district of South Gondar zone, on the North by Lasta and Bugna district, and the East by the Gazo district [20]. The location of the district is located between 11º35â??50â??N-12º20â??30â??N north latitudes, and 38º32â??35â??E-39º16â??40â??E east longitudes. The agro-ecological zones of the study area are lowland (27%), midland (63%), and highland. The estimated average annual rainfall ranges from 600 mm in the lowlands to 1120 mm in the highlands, whereas, the mean maximum and minimum temperature of the area is about 24.6°C and 12.1°C, respectively. The main livelihood source of the local community is small-scale rained agriculture [21] as shown in Figure 1.

Figure 1: Location map of the study area. Note: Own extraction from Ethiopian map shape file 2018.  Other Mekiet district kebeles;
Research design and sampling procedure
This study employed a cross-sectional research design, that is, the data were gathered from households at one time only. The study employed household survey as a research strategy and mainly used a quantitative approach complemented with qualitative approach.
Multistage sampling was applied to identify the study areas and sample households. Mekiet district was selected purposively due to the fact that the district is the top drought-prone areas and top chronically food insecure in the zone where more than half of its population are chronically food insecure with high exposure to recurrent drought. Secondly, the district has been stratified based on agro-ecological zones (highland, midland and lowland). Then, with in each agro-ecological zone, Kebeles were selected using simple random sampling. But, in the study sample kebeles were selected from two agro-ecological zones (midland and lowland). The two agro-climates were selected purposively. As a result of high amount of the population lives in the two agro ecology zones in midland (63%) and lowland (27%). Additionally, the two agroecological zones (midland and lowland) have high frequency of drought occurrence, level of food insecure and high number of safety net program beneficiaries than highland [21]. Moreover, in the two agro-ecological zones have a low access to basic services like water, distance to market, and distance to district town, education, health services and there is no infrastructure (road, electricity). Later, based on fair distributions of kebeles and the number of households across agro ecological zone and kebeles respectively proportionality sampling was applied. Then, three sample kebeles were selected from midland (Berekeza and Aymate) and from lowland (Debrekerbie).
The minimum sample size for the study was determined using mathematical formula suggested by Cochran [22]. The sample size was determined by considering the 95% confidence level, the desired level of precision, the desired confidence level (z=1.96), and p as the estimated proportion of population as 10% (since 10% of the population know household resilience [23]). The formula used to calculate and determine the sample size is:
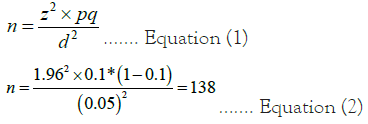
Where: n=Is the desired sample size z=The desired confidence level p=The estimated proportion of the population to be included in the sample q=1-p, and d=The desired level of precision or level of statistical significance/margin of error.
This calculation is with the assumption of 5% precision level (e) commonly employed in social science researches, 95% the desired confidence level (z=1.96), and p as the estimated proportion of population as 10% (since 10% of the population know household resilience [23]). This Cochran`s sample size determination formulae is valid if the calculated sample size is smaller than or equal to 5% of the target population of the study (or n/N ≤ 0.05). Fortunately, the calculated sample size of the study is below 5% of the study population. However, household surveys often have non-sampling (non-response) errors due mainly to defective definitions of important variables, failure to and bias of respondents to response, coverage and compiling error of the researchers. Researchers are advised to oversample by 10% to 20% of the computed number of samples [23]. Therefore, considering design effect as 1.5 from multistage sampling technique and nonresponse rate 10%, the total sample size becomes: (((138+10%) × 1.5)=228).
Thus, 228 sample household respondents were selected by systematic random sampling technique for using probability proportional to size of each kebele with sampling intervals (k).
Methods of data sources and collection
There are mainly two types of sources of data that a study can collect i.e., primary and secondary. The study was mainly utilized primary data that were collected from selected sample rural households of the study area. Since this study is the household level analysis of resilience to food insecurity, the unit of analysis is a household. As a unit of analysis for the study is rural households, the study was utilized structured interview schedule method for data collection, key informants and focus group discussion. Thus, nine key informants were interviewed and three focused group discussions were interviewed from each kebeles and the numbers of focus group participants in one group for each kebeles were 6-10 members.
The secondary data were collected from Mekiet district agricultural office. From this office information related to the total number of households that exists in the district, the information related to the total number of household that reside in the rural area, general information about the infrastructure and access of social services in the district were collected. Furthermore, the information related to an assistance given to the poor rural households like, the social safety net and emergency aid were collected.
Method of data analysis
To conduct the study, the TANGO International approach was used developed as a significantly modified variation on resilience index measurement analysis, first with a program evaluation in Ethiopia Frankenberger, and subsequently in Bangladesh [14,16]. Since 2018, the TANGO approach has served as the basis for recommended resilience analysis under USAID funded projects Henly-Shepard and Sagara, and the associated TANGO resilience survey module is now being systematically collected to evaluate resilience investments by USAID. The TANGO approach focuses on household and community level capacities of the three latent variables absorptive, adaptive, and transformative that are hypothesized to promote resilience. Each of these latent variables estimated using observable household level variables.
The overall household resilience capacity and its TANGO dimensions were estimated by using factor analysis. First, the dimensions of resilience capacity (absorptive, adaptive, and transformative) were estimated through FA from observed variables. The procedure allows for the reduction of the set of variables used as proxy indicators for the latent variable, as a single variable, the dimension of interest. Second, the overall resilience capacity index is constructed by combining the three indexes of resilience dimensions using factor analysis. Factor analysis is used to estimate a construct that is not directly observed, i.e., dimensions of resilience capacity [24].
As Bollen, the basic idea of a latent variable approach is that “there are one or more latent variables that create the association between unobserved variables” [24]. A formal expression of this idea is as follows:

Where; Yi =Observed indicator for the ith case; λ0 =Intercept term;  =Factor loading for the 1st through k case; μi =Unique variable or error term.
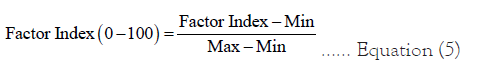
To calculate an index for the latent variable, factor analysis finds one or more common factors that linearly reconstruct the observed variables by predicting their correlation matrix. It then calculates factor loadings for possibly multiple common factors. These loadings are used to identify which common factor appears to be the one representing the concept being measured. Such identification takes place by examining the signs and magnitudes of the loadings. After identifying a common factor, the loadings are used to calculate the desired index, as a weighted average. The overall resilience capacity index is calculated as follows;

Where: RCIi =Resilience capacity index; ABCi =Absorptive capacity; ADCi =Adaptive capacity; TCi =Transformative capacity and βn =are factor analysis coefficients estimated using inter-correlations among the three resilience capacity indexes. They are interpreted as weights given to the capacities in the estimation of an overall resilience capacity index, with greater weights given to capacities that correlate more highly with the overall index. The final factor indexes are re-scaled from 0 to 100, using a mini-max procedure according to the following expression, where Min is the minimum value of the estimated index and Max its maximum value,
The statistical requirement suggested for the appropriateness of a good factor analysis model and its family model was checked based on Kaiser Meyer Olkin (KMO) measures of sampling adequacy, Bartlett Test of Sphericity, the existence of multicollinearity or singularity and factor loadings [25-29].
To make these data organized for analysis, all quantitative data sets was coded and entered into SPSS-version 25 (due to its quality for data management) and exported into stata version 14.1 (due to its quality for executing and using statistical models). Additionally, data gain from focus group discussions and key informant interviews were analyzed concurrently and thematically with quantitative results.
Measuring household resilience to food insecurity using TANGO approach
The TANGO approach were constructed from three resilience capacity dimensions of absorptive, adaptive, and transformative capacities. For this purpose, TANGO approach adopts a Factor Analysis (FA) model based on observable variables to estimate the three latent variables and the overall household resilience capacity. Therefore, each dimensions of resilience capacity namely absorptive capacity, adaptive capacity, and transformative capacities were estimated specifically as follows.
Absorptive capacity
Absorptive capacity is a latent variable, the ability to minimize exposure to shocks and stresses where possible and to recover quickly when exposed. Strengthening absorptive capacity at the community and household levels, helping them to reduce disaster risk and absorb the impacts of shocks without suffering permanent, negative impacts on their longer-term food security. Thus, absorptive capacity was composed from five observed variables; bonding social capital, asset ownership, cash savings, access to informal safety nets, and disaster preparedness and mitigation. Accordingly, before going to approximate the absorptive capacity, some of the variables were indexes and estimated through factor analysis. Lastly, Absorptive capacity was estimated through the observed variables.
On the estimations of absorptive capacity, two factors were retained since their eigenvalue is greater than one. The first and the second factor obtain 34% and 21% of the variation. Those variables explain 55% of the total variation as shown in Appendix Table 1. As presented in Table 1 all the statistical requirements for a good factor analysis model were tested and satisfied as recommended by Kaiser rule. Moreover, all the five variables were found to be statistically significant, with absolute value of factor loadings greater than 0.364. As expected, the factor loadings of all variables except asset ownership index and disaster preparedness and mitigation were positive and high load. The same study by Kaiser shows that access to informal safety nets is the most important factor contributing to absorptive capacity in the rural households of Uganda [29].
| Variables | Factor 1 | Factor 2 | Uniqueness |
|---|---|---|---|
| Bonding social capital index | 0.7997 | -0.0519 | 0.3578 |
| Asset ownership index | -0.5959 | -0.0797 | 0.6386 |
| Cash saving | 0.0196 | 0.8162 | 0.3334 |
| Access to informal safety nets | 0.7393 | 0.2703 | 0.3803 |
| Disaster preparedness and mitigation index | 0.3972 | -0.5583 | 0.5305 |
Note: Determinant of the correlation matrix=0.697; Bartlett test of sphericity; Chi-square=81.05; Df =10; p-value=0.000; Kaiser-Meyer-Olkin measure of sampling adequacy (KMO=0.593.
Table 1: Factor loadings of absorptive capacity.
The relative size of factor loading for each variable has therefore important policy implication (i.e. the higher the loading, the more important it is, and the more policy attention should be placed on it). In general, as suggested by the statistical criteria mentioned above, the factor scores can be used to estimate the ABC variable. As a result, two of the factors were used to estimate ABC as their contribution is adequate. It is estimated as follows:
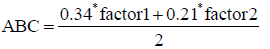
The value gained from this equation was further used to estimate the RCI in TANGO approach.
Adaptive capacity
Adaptive capacity is one of the latent variables of resilience capacity in TANGO approach involves in making positive and informed choices about alternative livelihood strategies. Adaptive capacity in TANGO approach composed by, bridging social capital, linking social capital, livelihood diversity, human capital, and access to information. Consequently, before going to approximate in Adaptive capacity some of the variables were indexes and estimated through factor analysis. Lastly, adaptive capacity was estimated through the aggregate indexes of all five variables based on the appropriate models.
The result specifies using factor analysis, two components were extracted as both appeared significant, on the basis Kaiser’s rule, in terms of explaining variations within the data as shown in Appendix Table 2. As can be shown in Table 2 relevant statistical requirements for good factor model were also checked and it’s satisfied. All five variables were found to be statistically significant, with absolute value of loadings greater than 0.364, in terms of contribution to the adaptive capacity.
| Variables | Factor 1 | Factor 2 | Uniqueness |
|---|---|---|---|
| Bridging social capital index | 0.1037 | 0.6804 | 0.5263 |
| Linking social capital | 0.707 | 0.0346 | 0.4989 |
| Livelihood diversity index | 0.6417 | -0.0184 | 0.5879 |
| Human capital index | 0.358 | -0.7141 | 0.3619 |
| Access to information index | 0.6462 | 0.2669 | 0.5112 |
Note: Bartlett test of sphericity; (Chi-square=38.627; df=10; p-value=0.000); KMO measure of sampling adequacy=0.550; Determinant of the correlation matrix=0.842; These values are obtained from computed based on field survey in 2022.
Table 2: Factor loadings of adaptive capacity.
Given the nature of the variables, the sign of the loadings were also as one may expect. For instance, adaptive capacity was proxies with five variables have a strong and positive loadings except human capital index. The human capital index have a negative loadings. Hence, negative loading of the variable indicates that adaptive capacity declines as one’s household head literacy status gets poorer. Linking social capital and access to information have the higher factor loads in the adaptive capacity. Similar study done by Kaiser regarding on adaptive capacity, linking social capital and access to information are the most important factors for increasing household resilience to food insecurity in Uganda [29].
Later, the components produced were quite meaningful in terms of the share of total variances each explained and both considered as the underlying latent variable for AC. Hence, the component’s scores obtained through Bartlett scoring method were combined to estimate the latent variable of (AC). This is accomplished by using the relative variance explained by each component as a weight. Hence, the AC index for each household is the weighted sum of its score on each of the two components as:
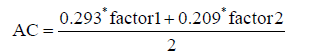
The result obtained through this equation was further used to construct RCI in TANGO approach.
Transformative capacity
Transformative capacity is the third latent variables of resilience capacity in TANGO approach that enabling conditions that foster more lasting resilience. Transformative capacities were constructed from access to formal safety nets, access to markets, access to extension services, responsibility of governance, access to public services, and access to communal natural resources. Therefore, before going to approximate in transformative capacity some of the variables were indexes and it estimated through factor analysis. Lastly, transformative capacity was estimated based on the observed variables.
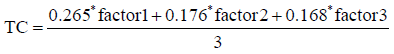
On the estimations of transformative capacity, three factors were retained since their eigenvalue is greater than one. Those variables explain 60.97% of the total variation as shown in Appendix Table 3. As presented in Table 3 all the statistical requirements for a good factor analysis model were tested and satisfied as recommended by Kaiser rule. Moreover, all six variables were found to be statistically significant, with absolute value of factor loadings greater than 0.364. As expected, the factor loadings of all variables except access to market and extension services were positive and high load. Thus, all variables have contributed to a significant role for estimating the transformative capacity. The same report done by Welderufael showed the transformative capacity variables play a significant role for household resilience capacities of a given households [7]. As a result, the combined factor score of three factors is used to estimate the latent variables of transformative capacity. This is done by using the relative variance explained by each factor as a weight. Later, transformative capacity for each household is the weighted sum of its score on each of the three factors. Hence, as usual, the transformative capacity is estimated as:
| Variables | Factor 1 | Factor 2 | Factor 3 | Uniqueness |
|---|---|---|---|---|
| Quality and responsibility of governance | 0.4787 | 0.7331 | 0.1626 | 0.207 |
| Access to formal safety nets | 0.7197 | 0.316 | -0.1983 | 0.3428 |
| Access to market | -0.4985 | 0.3149 | -0.3346 | 0.5404 |
| Access to extension services | -0.4549 | 0.4509 | -0.09 | 0.5816 |
| Access to public services index | -0.3318 | 0.1944 | 0.8642 | -0.3318 |
| Access to communal natural resource index | 0.5273 | -0.2878 | 0.2728 | 0.5647 |
Note: Bartlett test of sphericity; (Chi-square=54.462; df=15; p-value=0.000); Kaiser-Meyer-Olkin Measure of Sampling Adequacy (KMO=0.576); Determinant of the correlation matrix=0.784; These values are obtained from computed based on field survey in 2022.
Table 3: Factor loadings of transformative capacity.
The result obtained from this equation is further used to estimate resilience capacity index in TANGO approach.
Furthermore, this finding is in line with the idea focus group discussants. They stated that the issue of food insecurity was highly interconnected with social or public services like road transport, extension services, health services, and electricity. Specially, during summer season the road were not easy to move from home to market center due to the market takes a long distance from the kebeles, availability of health services and providing the livelihood activities (crop, livestock) and perform any day to day activities. In addition, the households have get a problem to sells and buys agricultural product for household consumption purposes at the right time. Thus, as they said, the governments and any local actors should take the responsibility for our problems by providing a better social services. If there is a better social services in our kebeles, each households were doing and practicing any trade activities with the main source of income of agriculture and the households have the capacity to resilient from different shocks like poverty and food insecurity.
Aggregating household resilience capacity in TANGO approach
TANGO approach employed factor analysis in the second stage to estimate the overall resilience capacity index based on the results of the three latent variables. All statistical requirements for the goodness-of-fit of the factor analysis model were checked and all were passed the tests. Bartlett’s test of Sphericity was significant at (Chi-Square=16.137, df=3, p<.001) implying the existence of sufficient correlation among variables for running FA. KMO test of sampling adequacy and determinant of R-matrix at 0.500 and 0.900, respectively. Based on Kaiser rule, two factors were retained since their Eigenvalues are greater than or equal to one and those factors explain around 75.5% of total variances as shown in Appendix Table 4. Both statistical measurements were well above the minimum required indicating that sample size insufficiency and multicolinearty are not issues of concern.
| Variable | Factor1 | Factor2 | Uniqueness | Corr. RCI |
|---|---|---|---|---|
| Absorptive capacity index | 0.1218 | 0.9796 | 0.0256 | 0.127*** |
| Adaptive capacity index | 0.797 | 0.0553 | 0.3617 | 0.778*** |
| Transformative capacity index | -0.7802 | 0.2095 | 0.3474 | -0.798*** |
Note: Bartlett test of sphericity; (Chi-square=16.137, df=3, p-value=0.000); Kaiser-Meyer-Olkin Measure of Sampling Adequacy=(KMO=0.500); Determinant of the correlation matrix=0.900; ***: Correlation is significant at the level of 0.01; These values are obtained from computed based on field survey in 2022.
Table 4: Factor loadings of Resilience capacity in TANGO methods.
As presented in Table 4 absorptive capacity has a positive and higher factor loading from the three latent variables and have a strong correlations with resilience capacity index.
The factor loading is 0.979 which is greater than 0.364 and the correlation coefficient is 0.127, it is significant at 0.01. This result is similar with report of Martin, one of the latent variables of RCI, the absorptive capacity index had the highest factor loadings and have largest contributions for household resilience. Along with, adaptive capacities has a positive and higher factor loading which is 0.797 and has a higher correlation coefficients with resilience capacity index that is 0.778. This shows that those two latent variables have highly contribute to the estimation of resilience capacity of the household. Similarly, the study done by Villoslada reveals that adaptive capacity has a higher factor loadings and contribute to household resilience. Moreover Field, results from factor analysis show that adaptive capacity contributes the highest to building resilience capacity among households in Uganda [27]. On the other hand, transformative capacities has a strong but a negative factor loadings which is significant at (-780) since its absolute value is greater than the minimum required. The extreme negative value on the result shows the most vulnerable households whereas that of positives shows the resilient ones.
It is also possible to show relationships of the overall household resilience capacity index with the three latent variables (absorptive, adaptive, and transformative capacities) of TANGO approach using two way scatter plots. Scatter plots are the graphs that shows the relationship between the overall RCI with their latent variables. The line drawn in a scatter plot, which is near to almost all the points in the plot is line of best fit. If the variables are correlated, the points is fall along a line or curve. The better the correlation, the closer the points touch the line. Hence, as can be shown in Figure 2 the scatter plots of resilience capacity with latent variables in TANGO approach, adaptive capacity and absorptive capacities have a positive correlations while transformative capacity has a negative relationships.

Figure 2: Scatter plots of resilience capacity with TANGO dimensions. Note: These values are obtained from computed based on field survey in 2022.
In general, the overall results of resilience capacity index in stage two factor analyses imply that the resilience of households is highly dependent on absorptive capacity and adaptive capacity. That means bonding social capital index, asset ownership index, cash saving, access to informal safety nets, and disaster preparedness and mitigation index from absorptive and bridging social capital index, linking social capital, livelihood diversity index, and access to information index from adaptive capacities of resilience play a significant role in the enhancement of household resilience capacities. This study is similar with the report of Kaiser conducted the study’s on Uganda, that shows the variables of absorptive and adaptive capacities have higher contributions to household resilience capacity [29]. Therefore, resilience-oriented intervention should give priority to those variables to enhance the resilience capacity of a given household.
This study was conducted in Mekiet district, North Wollo zone, Amhara National Regional State, Ethiopia. Mekiet was selected for this study because more than half of its population are under chronically food insecure with high exposure to recurrent drought. Hence, this study was mainly aims to address the rural household resilience to food insecurity in Mekiet district.
Resilience has a multidimensional and unobservable nature. As a multidimensional concept, resilience considers a number of dimensions that can be context and time specific. Its unobservable nature reflects resilience cannot be measured directly rather be indirectly with its underlying structure. The results indicated that, after independently estimating the latent variables in TANGO approach by applying factor analysis revealed that, the latent variables of absorptive and adaptive capacities are positively associated with household resilience capacity. A load of each factor is 0.98 and 0.79 respectively. On the other hand, transformative capacity is found to be a strong negative load (-0.78). All those loads are significant with absolute value of factor loadings greater than 0.364 which is recommended for a sample size of 200 and above. Those latent variables are also highly correlated with resilience capacity. The average household resilience capacity index are 0.51 respectively.
With respect to TANGO’s measures of households’ resilience, their capacity maintains to withstand future food insecurity shocks and stressors. Based on this fact the following recommendations have been made:
• In TANGO’s measures, one of the latent variable (transformative capacity) has a negative factor loadings and the extreme negative value on the result shows the most vulnerable households. Thus, resilience policies should target and prioritize programs that enhance, access to formal safety nets, access to markets, access to extension services, responsibility of governance, access to public services(access to road transport, extension, market, credit, health services, electricity), and access to communal natural resources.
• Mostly, building sustainable resilience programs were implemented at national or regional levels, thus, they cannot achieve the aims of enhancing household resilience to food insecurity. Therefore, the resilience policies and programs should implement at district, community, and household levels to build the resilience capacity of a given households.
• Currently, the resilience programs and policies have mainly concentrated on relief rather than on the achievement of longterm development goals that might decrease communities’ vulnerability to shocks. Thus, building resilience should focus on longer term achievements for boosting of food security in the countries, communities, or households.
• To end, this study did not capture the dynamic concepts of resilience to build the capacity of households to food insecurity problems. To fully explore the dynamics of the resilience capacity of the households it needs a panel dataset. This study hence followed the cross-sectional approach to measure the current resilience capacity of households to food insecurity at a specific moment in time. It hence recommends and calls for intensive empirical studies using the longitudinal dataset to explore the dynamics of resilience capacity of households over time to household food insecurity.
The authors are very grateful to the enumerators who collected and assisted in the data entry sample households’ and staff of Berekeza, Aymate and Debrekerbie kebelles for kindly providing the necessary information used in the study and their willingness and patience in responding to my questionnaire at the expenses of their invaluable time.
Authors’ contribution
Dr. Birhan Sisay Demsie was major adviser in this thesis and he contributes in idea generation and guidance all the time from the very beginning of proposal writing to the final thesis write up.
Tadsual Asfaw Dessie was involved in literature search, development of overall research plan, study design, data collection, data analysis, data interpretation provided the validated questionnaires, and developed the manuscript.
Funding
None.
Declaration of competing interest
The authors declare that they have no known competing financial interests.
Citation: Asfaw T, Demsie BS (2024) Rural Household Resilience to Food Insecurity: The Case of Mekiet District, North Wollo Zone, Amhara National Regional State, Ethiopia. J Geogr Nat Disasters. 14:296.
Received: 13-Jan-2024, Manuscript No. JGND-24-29173 ; Editor assigned: 16-Jan-2024, Pre QC No. JGND-24-29173 (PQ); Reviewed: 31-Jan-2024, QC No. JGND-24-29173 ; Revised: 07-Feb-2024, Manuscript No. JGND-24-29173 (R); Published: 14-Feb-2024 , DOI: 10.35841/2167-0587.24.14.296
Copyright: © 2024 Asfaw T, et al. This is an open-access article distributed under the terms of the Creative Commons Attribution License, which permits unrestricted use, distribution, and reproduction in any medium, provided the original author and source are credited.