Journal of Geology & Geophysics
Open Access
ISSN: 2381-8719
ISSN: 2381-8719
Research Article - (2016) Volume 5, Issue 4
This study examines the sensitivity of simulated precipitation to planetary boundary layer (PBL) schemes over the Tibetan Plateau (TP) and the Yangtze River Valley (YRV). The summer precipitation from 15 June to 30 July 2010 is simulated with the Weather Research and Forecasting (WRF) model over these areas. Three PBL parameterization schemes, Mellor-Yamada-Janjić (MYJ), Yonsei University (YSU), and Medium-Range Forecast (MRF) are compared in the simulation. The simulated hourly precipitation overestimates the observed precipitation, and the simulation of MRF scheme is more close to the observation. In general, the WRF model shows good (poor) ability in simulating the diurnal cycle of precipitation over the TP (the upper YRV). Although the WRF model simulates a two-peak pattern different from the observed one-peak pattern in the middle YRV, both of them are generally close in trend. The choice of PBL parameterization schemes affects not only the amplitude of the precipitation but also the phase of diurnal cycle, and MRF scheme simulates better in precipitation amount than YSU and MYJ schemes. Among the three PBL schemes, the hourly PBL height of MYJ scheme is higher than those of MRF and YSU schemes. All the three PBL schemes present a similar diurnal cycle of PBL height, and the differences of PBL heights are responsible for the discrepancies in the simulated precipitation amounts. The three largest lakes in the central TP result in three large centers of the minimum PBL heights and of the average hourly PBL heights at the same locations, which are responsible for the maximum centers in the simulated precipitation in the central TP.
Keywords: Summer precipitation, Weather research and forecasting model, Planetary boundary layer parameterization, Tibetan plateau
The Tibetan Plateau (TP) is the largest and highest plateau in the world serving as “the world’s water tower”. As the roof of the world, it is a source of dynamic and thermodynamic turbulence and has profound influence on atmospheric circulation patterns in various temporal and spatial scales [1-4]. Many severe weather systems that impacted China in the past had links to the dynamic and thermodynamic influences of TP [5-8]. The land-ocean-atmosphere interaction around TP has a significant impact on the global climate and environment [9]. Because a planetary boundary layer (PBL) is where the earth’s surface interacts with large-scale atmospheric flow, the high altitude terrain influence of TP on the atmosphere is closely related to its PBL [6,10-13]. According to the study by Shi et al. [14], the mesoscale topographic features play an important role in generating and enhancing the mesoscale disturbances over TP; these disturbances can increase the surface sensible heat flux over TP and propagate eastward to enhance the convection and precipitation in the Yangtze River Valley (YRV). Xu et al. [15] indicates the topography of western China’s highlands especially over TP is an important factor for seasonal progression of the Meiyu rainband. Simulations indicate that TP PBL height contributes to the development of strong vertical motion at the southeast part of TP and YRV, and the deep TP PBL height is also beneficial to the remarkable increase in clouds and precipitation over YRV [16].
Observational analyses show that TP PBL structure is quite different from that of the plain area because of its unique topographic features; TP PBL height varies between 1,006 and 4,430 m, depending on weather, season and location [17,18]. However, available observations are limited in TP area because of the complex terrain and weather conditions; thus, the knowledge of TP PBL structure, as well as the influence of TP on the atmosphere, is far from sufficient. Conversely, TP is a critical location for numerical weather prediction (NWP) and for climate models to predict the winter climate and summer monsoon, even if these models perform poorly in these regions. Holtslag et al. [19] indicates that the largest 2-meter temperature bias in the Community Atmosphere Model (CAM) occurs in TP region. Because the PBL mediates the interactions between the ocean/land surface and the free atmosphere, its parameterization plays an important role in atmospheric modelling for various applications, but the gap between modern understanding of PBL physics and its representations in current operational atmospheric models remains large [20,21]. Thus, validation of the simulated precipitation amounts with various model PBL parameterizations over TP and its downstream areas can be helpful for future improvement of the prediction models and parameterizations in these regions. In this paper, three PBL parameterizations in the Weather Research and Forecasting (WRF) numerical model-MRF [22], MYJ [23], and YSU [24] are adopted to simulate hourly precipitation over TP and its downstream areas from 15 June to 30 July 2010. The purpose of this study is to use WRF model to validate the simulated summer hourly precipitation and its diurnal cycle and to investigate the sensitivity of the WRF precipitation to the PBL heights with these PBL parameterizations.
In this study, WRF model version 3.4 is used, which is a next-generation mesoscale numerical weather prediction system designed to serve both atmospheric research and operational forecasting needs (http://www.wrf-model.org/index.php). The effort to develop WRF began in the late 1990s and was a collaborative partnership principally among National Center for Atmospheric Research (NCAR), National Oceanic and Atmospheric Administration (NOAA), US Air Force Weather Agency (AFWA), Naval Research Laboratory, University of Oklahoma, and Federal Aviation Administration (FAA). WRF is a fully compressible nonhydrostatic model, and uses the Arakawa C grid for horizontal and terrain-following hydrostatic-pressure vertical coordinates. This model has been widely used in mesoscale applications.
The simulation is configured with 35 vertical levels with the top level of 50 hPa, and a horizontal grid spacing of 10 km×10 km as the simulated precipitation was compared with the observation-derived precipitation in 0.1°×0.1° spacing (see the following paragraph). For physics and dynamics options, WRF Single-Moment 6-class (WSM6) microphysics scheme [25], Rapid Radiative Transfer Model (RRTM) longwave radiation scheme [26], Dudhia shortwave radiation scheme [27], Unified Noah Land Surface Model [28], and Betts-Miller- Janjic (BMJ) cumulus parameterization [29] were used. Three PBL parameterizations of MRF, YSU, and MYJ were adopted to simulate hourly precipitation amounts and PBL heights. MRF scheme [22] employs a so-called counter-gradient flux for heat and moisture in unstable conditions. It uses enhanced vertical flux coefficients in the PBL, and the PBL height is determined from a critical bulk Richardson number of 0.5. It handles vertical diffusion with an implicit local scheme based on local Richardson number in the free atmosphere. YSU PBL [24] is the next generation of the MRF PBL, also using the countergradient terms to represent fluxes due to non-local gradients. This adds to MRF PBL an explicit treatment of the entrainment layer at the PBL top. The entrainment is made proportional to the surface buoyancy flux in line with results from studies with large-eddy models. The PBL top is defined using a critical bulk Richardson number of zero (compared to 0.5 in MRF PBL), so is effectively dependent on the buoyancy profile, in which the PBL top is defined at the maximum entrainment layer (compared to the layer at which the diffusivity becomes zero). A smaller magnitude of the counter-gradient mixing in YSU PBL produces a wellmixed boundary-layer profile, where MRF PBL shows a pronounced over-stable structure in the upper part of the mixed layer. MYJ scheme [23] represents a non-singular implementation of the Mellor- Yamada Level 2.5 turbulence closure model through the full range of atmospheric turbulent regimes. In this implementation, an upper limit is imposed on the master length scale. This upper limit depends on the turbulent kinetic energy (TKE) as well as the buoyancy and shear of the driving flow. In the unstable range, the functional form of the upper limit is derived from the requirement that the TKE production be nonsingular for growing turbulence. In the stable range, the upper limit is derived from the requirement that the ratio of the variance of vertical velocity deviation and TKE cannot be smaller than that corresponding to the regime of vanishing turbulence.
The initial and boundary conditions of the WRF simulation were derived from NCEP 1°×1° reanalysis data. The simulation started from the NCEP reanalysis at 12:00 UTC (20:00 Local Time, LT) for each day from 15 June to 30 July 2010 with a simulation time length of 36 hours. Only precipitation and PBL heights from 01:00 LT to 24:00 LT were used each day at one hour intervals because this study focuses on their diurnal cycles. The observed hourly precipitation data used in the study were provided by the China Meteorological Administration National Meteorological Information Center. This dataset combined the hourly precipitation of more than 30,000 surface weather observation stations in China and the Climate Precipitation Center Morphing (CMORPH) precipitation product in 0.1°×0.1° resolution, which reduces the underestimation greatly and has smaller bias and root-mean-square error, and high spatial correlation [30].
This study concentrates on TP region and its downstream areas. The simulation domain is represented by the dashed rectangle in Figure 1, and the analysis domain is represented by the solid rectangle divided into three areas: A (83.05°103.65°E, 28.35°34.05°N) is the TP, B (103.75°111.35°E, 28.35°34.05°N) is the upper YRV, and C (111.45°117.05°E, 28.35°34.05°N) is the middle YRV. The hourly precipitation as well as its diurnal cycle were simulated and compared to the observed precipitation in each of the above three areas. The correlation coefficient, bias and root-mean-square (RMS) between the simulated and observed precipitation are calculated. The differences of PBL heights obtained from MRF, MYJ, and YSU schemes were also compared to explore the relationship between the simulated precipitation and PBL height.
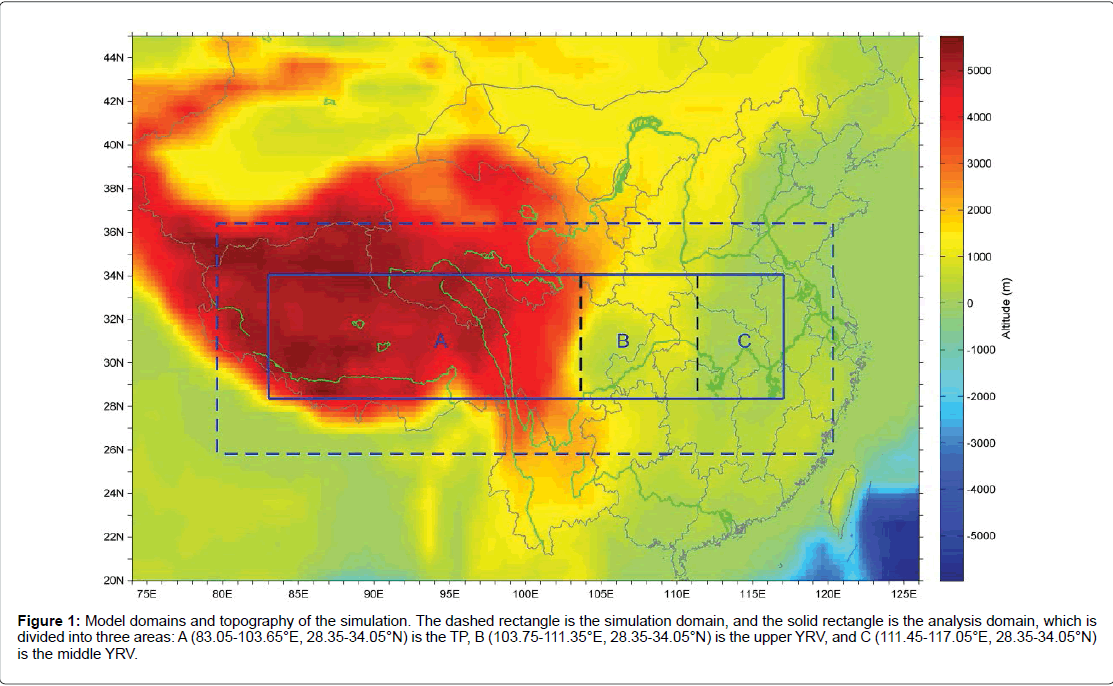
Figure 1: Model domains and topography of the simulation. The dashed rectangle is the simulation domain, and the solid rectangle is the analysis domain, which is divided into three areas: A (83.05-103.65°E, 28.35-34.05°N) is the TP, B (103.75-111.35°E, 28.35-34.05°N) is the upper YRV, and C (111.45-117.05°E, 28.35-34.05°N) is the middle YRV.
Hourly precipitation
The hourly precipitation amounts simulated by the WRF model with the MRF, MYJ, and YSU schemes from 15 June to 30 July 2010 were averaged and compared to the observed precipitation. As shown in Figure 2, the simulated precipitation is generally greater than the observed precipitation amounts in TP downstream areas, and MRF scheme overpredicts the precipitation but less than both MYJ and YSU schemes do. Over TP, the simulated hourly precipitation amounts are generally close to the observed precipitation amounts, except for the larger values in the southeast TP. It should be noted that some large centers of simulated hourly precipitation occur at the central TP, which do not match the observations. This phenomenon is like the excessive rainfall or numerical point storms (NPSs) mainly caused by the subgrid and grid-scale interactions of cloud and precipitation processes. Over TP the excessive rainfall or NPSs are usually related with steep terrain [31-35]. As shown in section 3.3, the large centers of simulated precipitation in the central TP are related with small scale terrain. Table 1 shows the spatial correlation coefficients and biases between the simulated and observed hourly precipitation in TP and its downstream areas. Over TP and the upper YRV, the spatial correlation coefficient is the largest in MYJ scheme and the smallest in MRF scheme. The spatial bias is the smallest in MRF scheme and the largest in MYJ scheme. In the middle YRV, the spatial correlation coefficient is the largest in YSU scheme and the smallest in MRF scheme, while the spatial bias is also the smallest in MRF scheme and the largest in MYJ scheme. Clark et al. [36] indicates that the WRF model overpredicts rainfall in the central United States, and our results reveal that the WRF model also overpredicts precipitation over TP and its downstream areas especially the middle YRV.
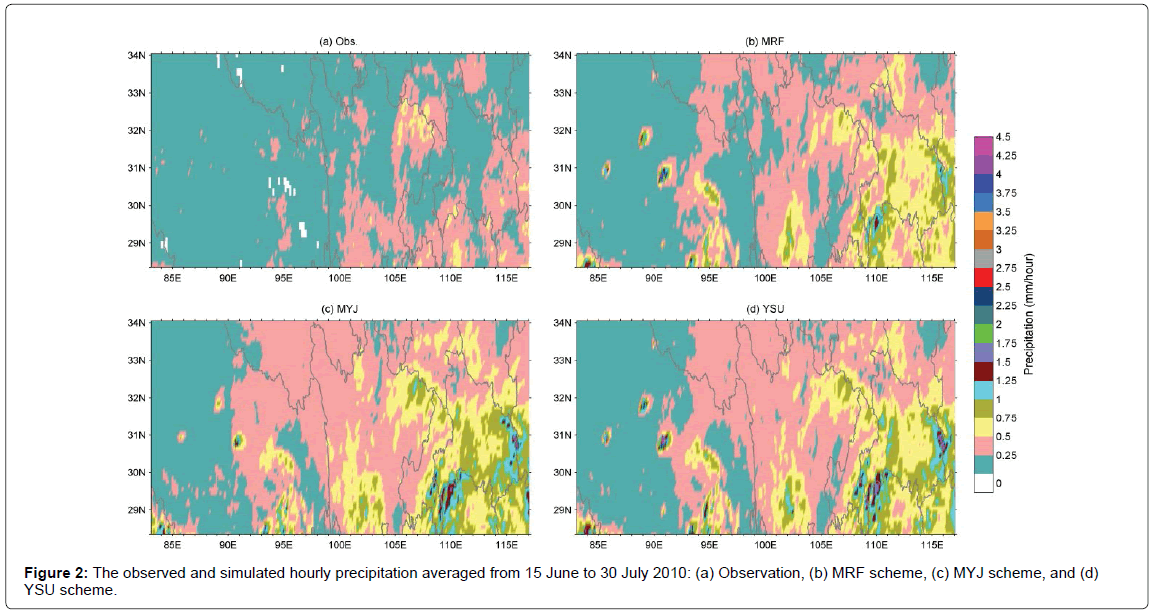
Figure 2: The observed and simulated hourly precipitation averaged from 15 June to 30 July 2010: (a) Observation, (b) MRF scheme, (c) MYJ scheme, and (d) YSU scheme.
| Region | PBL Scheme | Spatial Correlation Coefficient | Spatial Bias (mm/hour) |
|---|---|---|---|
| The TP | MRF | 0.492 | 0.11 |
| MYJ | 0.67 | 0.18 | |
| YSU | 0.525 | 0.16 | |
| The upper YRV | MRF | 0.421 | 0.16 |
| MYJ | 0.487 | 0.28 | |
| YSU | 0.421 | 0.26 | |
| The middle YRV | MRF | 0.568 | 0.27 |
| MYJ | 0.578 | 0.4 | |
| YSU | 0.597 | 0.36 |
Table 1: The spatial correlation coefficients and biases between the simulated and observed hourly precipitation amounts in TP and its downstream areas from 15 June to 30 July 2010.
To further compare the simulated hourly precipitation with the observation at each grid, the correlation coefficient (R), bias, and RMS are calculated using the two data series of the simulated and observed hourly precipitation from 15 June to 30 July 2010. As shown in Figure 3, the Rs between the simulated and observed hourly precipitation are mostly above 0.2 in the upper and middle YRV with some greater than 0.5; however, the Rs over TP are between -0.1 and 0.1. The differences of Rs among MRF, MYJ, and YSU schemes are small. The biases of the simulated hourly precipitation against the observed precipitation are positive in most areas, especially in the middle YRV, but in certain areas of TP and the upper YRV, the biases are negative but great than -0.5 mm/hour. Most positive biases are less than 0.5 mm/hour, and those in the middle YRV are less than 1.0 mm/hour. However, the large centers in the central TP are greater than 2.0 mm/hour. Moreover, the area of positive bias greater than 0.5 mm/hour is the largest in MYJ scheme and the smallest in MRF scheme, while the area of negative bias is the largest in MRF scheme and the smallest in MYJ scheme. Compared to the observed precipitation, the simulated hourly precipitation has smaller RMSs over TP and larger RMSs in the upper and middle YRV. The precipitation RMSs are generally smaller than 2.0 mm/hour over TP, but those in the upper and middle YRV are greater than 2.0 mm/ hour. Although the differences in precipitation RMSs among MRF, MYJ, and YSU schemes are insignificant, the areas of precipitation with RMSs greater than 3.5 mm/hour are the smallest in MRF scheme.
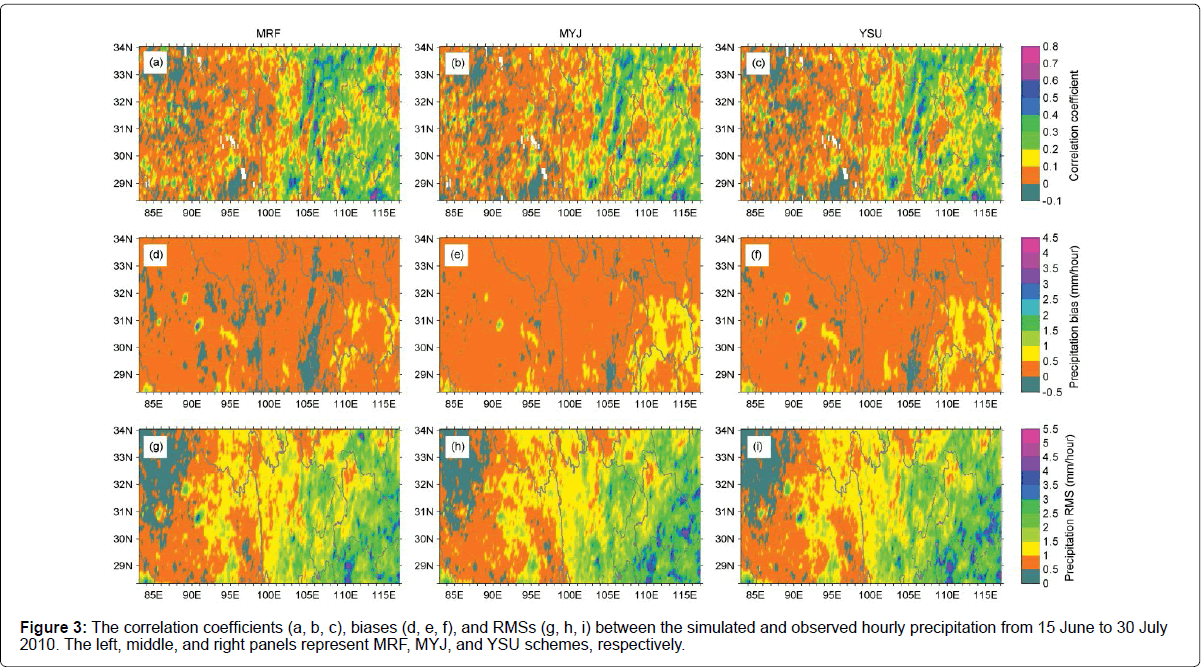
Figure 3: The correlation coefficients (a, b, c), biases (d, e, f), and RMSs (g, h, i) between the simulated and observed hourly precipitation from 15 June to 30 July 2010. The left, middle, and right panels represent MRF, MYJ, and YSU schemes, respectively.
Diurnal cycle of precipitation
As summer precipitation over land regions has significant diurnal variation [37-39], the averaged diurnal cycle of simulated precipitation at each grid is calculated with the hourly precipitation simulated from 15 June to 30 July 2010, and the averaged diurnal cycle of observed precipitation at each grid is also processed in the same method. Based on the averaged diurnal cycle of precipitation, we calculate the maximum and minimum precipitation amounts, as well as the precipitation amplitude (the maximum minus the minimum) at each grid. As shown in Figure 4, the maximum precipitation amounts of WRF model are greater than the observed precipitation amounts in most areas of the upper and middle YRV, and the differences are the largest in MYJ scheme and the smallest in MRF scheme. Although the differences in minimum precipitation amounts between the simulated and observed precipitation amounts are not as significant as those for the maximum precipitation in the upper and middle YRV, the simulated minimum precipitation amounts are greater than the observed precipitation amounts in most areas of TP; however, the discrepancies among MRF, MYJ, and YSU schemes are almost identical. The simulated precipitation amplitudes present the same situation of the maximum precipitation.
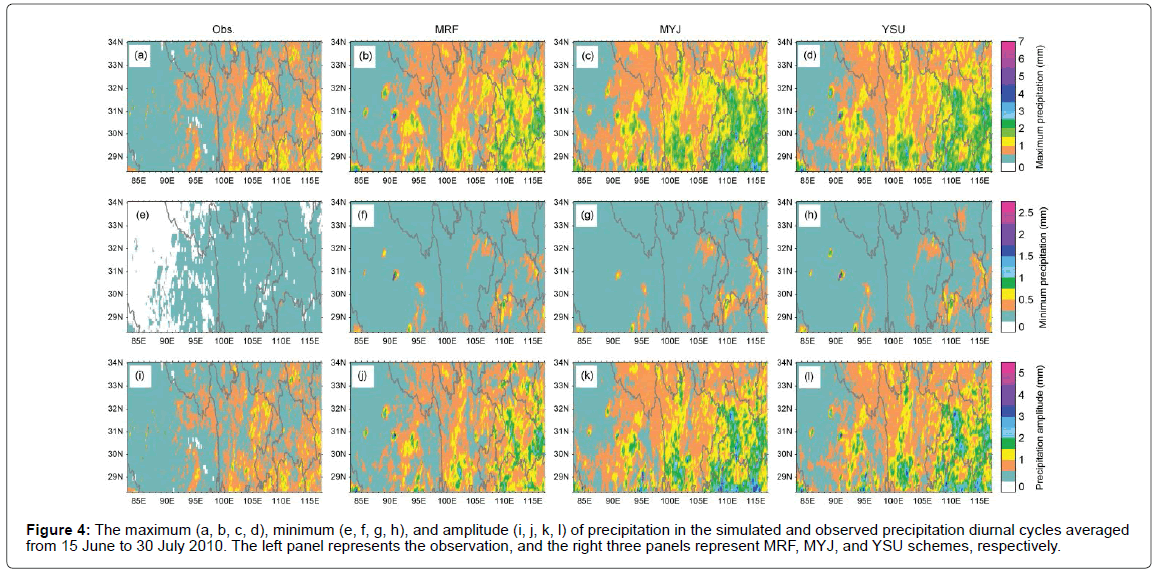
Figure 4: The maximum (a, b, c, d), minimum (e, f, g, h), and amplitude (i, j, k, l) of precipitation in the simulated and observed precipitation diurnal cycles averaged from 15 June to 30 July 2010. The left panel represents the observation, and the right three panels represent MRF, MYJ, and YSU schemes, respectively.
For a further comparison of the precipitation diurnal cycles between the simulated and observed precipitation, the time series of the maximum and minimum precipitation amounts in the average precipitation diurnal cycles are presented in Figure 5. The maximum observed amounts of precipitation mostly occur in daytime in the west TP and at night-time in the east TP, and in the upper YRV, the maximum observed precipitation amounts generally appear after midnight and before noon, while in the middle YRV they usually occur around noon. The time series of the simulated maximum precipitation are close to the observed precipitation in the east TP and the middle YRV; however, in the west TP, the simulated maximum precipitation usually occurs around midnight, and in the upper YRV, it mostly occurs at afternoon and night. The differences among MRF, MYJ, and YSU schemes are insignificant. This indicates they all have significant bias toward the observation and their differences cannot address the bias issue over TP and its downstream areas. Some further research is inevitable. Based on observation, the minimum precipitation amount usually occurs after midnight in the west TP and before noon in the east TP, and in the upper YRV, the minimum precipitation amount generally occurs at night, while in the middle YRV it mostly occurs around midnight. Similar to the time series of maximum precipitation, the simulated minimum precipitation mostly occurs closer to the observed precipitation in the east TP and the middle YRV, but in the west TP it occurs around noon (except at edge of TP, where it occurs around midnight), and in the upper YRV the simulated minimum precipitation generally occurs around midnight. Moreover, the differences among MRF, MYJ, and YSU schemes are also insignificant. According to the study of Xu et al. [40], the maximum precipitation in the central TP obtained with the TRMM observed precipitation mostly occurs at approximately 20 LT, and the simulated maximum of WRF model occurs four hours later (24 LT) than the TRMM data in certain regions in the western plateau. Using the observed hourly precipitation amounts and the simulated precipitation amounts obtained with various PBL parameterizations, the results is consistent with the above in the central TP. Additionally, our results show that the observed maximum precipitation mostly occur in daytime in the west TP, but the simulated maximum precipitation usually occur around midnight, with a time shift of ~12 h. Moreover, the same situation is also found for the minimum precipitation, in which the observed minimum precipitation mostly occurs after midnight in the west TP and the simulated minimum precipitation occurs around noon.
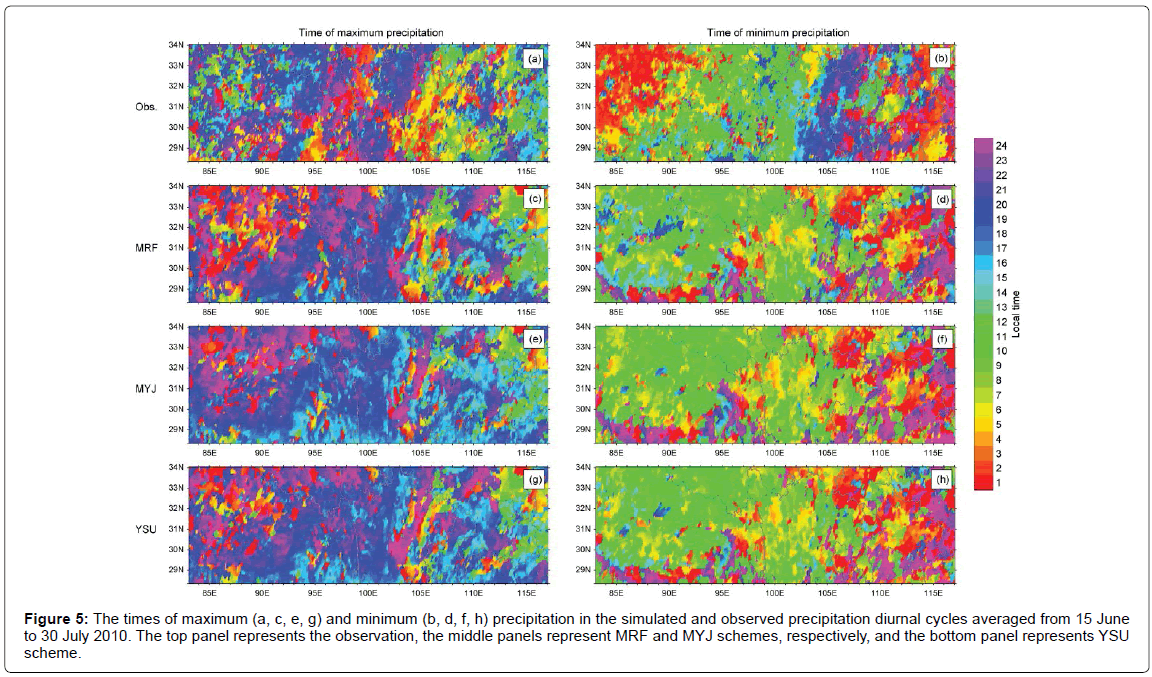
Figure 5: The times of maximum (a, c, e, g) and minimum (b, d, f, h) precipitation in the simulated and observed precipitation diurnal cycles averaged from 15 June to 30 July 2010. The top panel represents the observation, the middle panels represent MRF and MYJ schemes, respectively, and the bottom panel represents YSU scheme.
To explore the precipitation diurnal cycles over TP and the upper and middle YRV in general, the precipitation diurnal cycles of the grids in these three regions are averaged. As shown in Figure 6, the observed precipitation in TP has the maximum value around 20 LT and the minimum value around 12 LT, and it is reasonable as most rainfall occurs at night in TP, which is partly due to the relatively larger humidity and stronger convective clouds during nights over TP [41,42]. All the three simulated precipitation diurnal cycles have similar trends with the observed precipitation in TP, but the minimum precipitation occurs at 10-11 LT and the maximum precipitation occurs at 16-18 LT. The correlation coefficients between the simulated and observed precipitation diurnal cycles in TP are 0.88, 0.74, and 0.59 for MRF, YSU, and MYJ schemes, respectively. In the middle YRV, the observed precipitation has the maximum value at 11 LT and the minimum at 02 LT. This may be related with the diurnal cycle of atmospheric water vapor in this region, in which the atmospheric water vapour is greater at afternoon and smaller in morning [42]. All the simulated precipitation present two large centers in their diurnal cycles, the weaker one occurs at 07 LT and the other around 16 LT (12 LT for MRF scheme), and this is different from the single large center in the observed precipitation. Even so, the general trends of the simulated precipitation are close to the observation, and their correlation coefficients are 0.95, 0.89, and 0.86 for MRF, YSU, and MYJ schemes, respectively. The reason for the twopeak phenomenon is not clear and needs more detailed investigation. For the upper YRV, as it is the transition between TP and the middle YRV, the observed precipitation presents a different pattern from those two regions. The observed maximum value occurs at 07 LT and the minimum precipitation occurs at 20 LT. It is worth of mentioning that the simulated precipitation diurnal cycles exhibit trends opposite to the observation at this region, with the minima at 09 LT and the maxima at 15-17 LT. The correlation coefficients between the simulated and observed precipitation diurnal cycles in the upper YRV are -0.65, -0.68, and -0.61 for MRF, YSU, and MYJ schemes, respectively. Furthermore, all the simulated precipitation amounts are larger than the observation in diurnal cycle, and the discrepancy between the simulated and observed precipitation amounts is the smallest in MRF scheme and the largest in MYJ scheme.
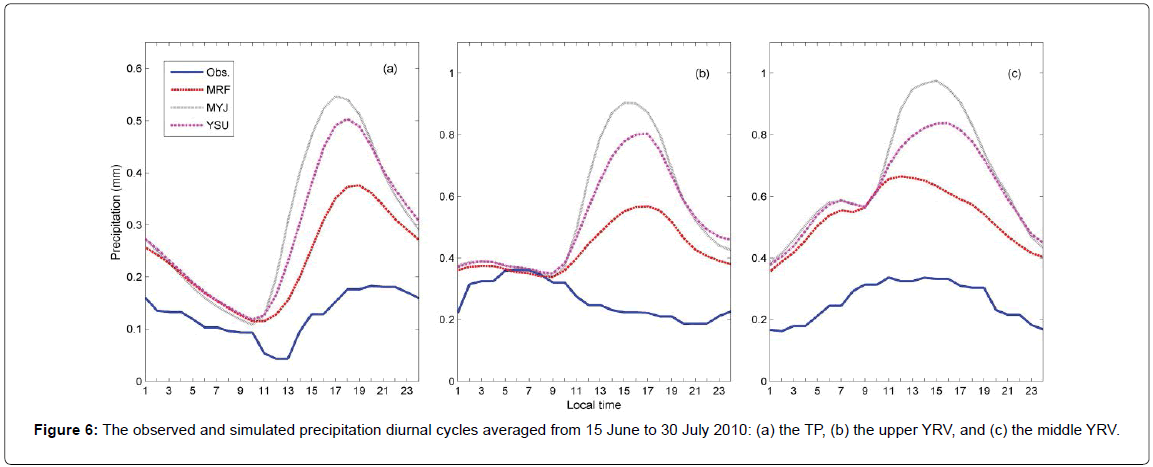
Figure 6: The observed and simulated precipitation diurnal cycles averaged from 15 June to 30 July 2010: (a) the TP, (b) the upper YRV, and (c) the middle YRV.
Overall, WRF model simulates a trend in the diurnal cycle of precipitation well in TP but not in the upper YRV, although WRF model simulates a two-peak pattern different from the observed one-peak pattern in the middle YRV, both of them are generally close in trend. The choice of PBL parameterization affects not only the amplitude of the precipitation but also the phase of diurnal cycle. In general, MRF scheme simulates better in precipitation amount than YSU and MYJ schemes.
PBL height
Because precipitation is related to PBL height [16], the differences in PBL height obtained from the three PBL parameterizations are examined. Figure 7 shows the average hourly PBL heights of MRF, MYJ, and YSU schemes simulated from 15 June to 30 July 2010. It is found that the average hourly PBL heights of MYJ scheme are the highest, and those for MRF and YSU schemes are close. Three large centers of PBL heights appear over TP especially in MRF scheme, which are correlated to those large centers in the simulated hourly precipitation at the same locations (Figure 2). According to the study of Zhuo et al. [16], the TP PBL height contributes to the development of strong vertical motion and benefits the increase in precipitation. The three large centers of PBL heights in the central TP are more likely responsible for the maximum centers in precipitation at the same places.
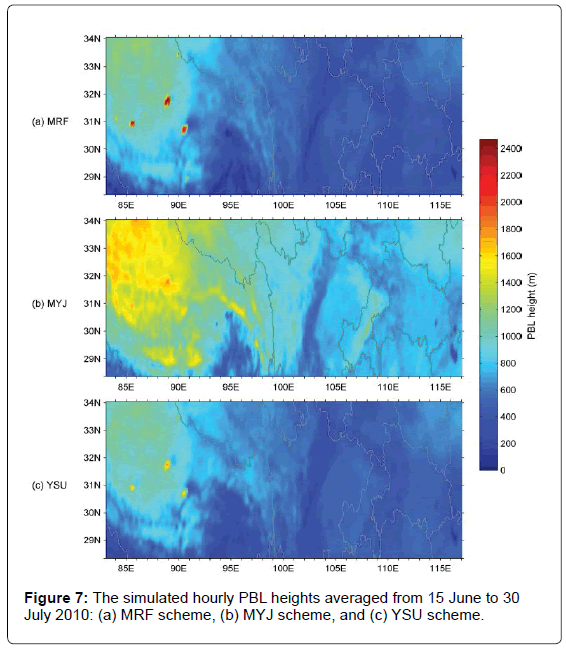
Figure 7: The simulated hourly PBL heightsaveraged from 15 June to 30 July 2010: (a) MRF scheme, (b) MYJ scheme, and (c) YSU scheme.
To further explore the differences of PBL height simulated with the three PBL schemes, the averaged diurnal cycle of PBL height at each grid is also calculated using the hourly PBL heights simulated from 15 June to 30 July 2010. Based on the averaged diurnal cycle of PBL height, the following values are calculated: the maximum and minimum PBL heights, the amplitude of PBL height (the maximum minus the minimum) at each grid. The results are presented in Figure 8. For the maximum PBL height, MYJ scheme shows the highest value and YSU scheme the smallest. The largest centers of the maximum PBL height are 3,170, 3,727, and 2,714 meters for MRF, MYJ, and YSU schemes, respectively. MYJ scheme results the highest minimum PBL height and MRF scheme the lowest. Moreover, three large centers of the minimum PBL height appear over TP especially in MRF scheme, which are responsible for the three large centers in the average hourly PBL heights. In general, the amplitude of PBL height is the smallest in YSU scheme and the largest in MRF scheme. To understand why the suspicious large centers of the minimum PBL height occur at the central TP, the topography in the WRF model is checked, and the three largest lakes in TP are at these particular locations. The first is the Lake Selinco (89.0°E, 31.8°N) with a latitudinal width of ~72 km and a longitudinal width of ~23 km, the second is the Lake Namco (90.6°E, 30.7°N) with a latitudinal width of ~70 km and a longitudinal width of ~30 km, and the third is Lake Zhari Namco (85.7°E, 30.9°N) with a latitudinal width of ~53 km and a longitudinal width of ~26 km. Note there is another large Lake Tangra Yumco (86.5°E, 31.0°N), in the neighbour of the Lake Zhari Namco. These lakes can be identified by the grid spacing of 10 km×10 km used in this study. According to the study of Lü et al. [43], strong cold (warm) lake effect has strong impact on the summer PBL characteristics over the Lake Namco region. Both sensible heat flux and latent heat flux are small over the lake during the day but latent heat flux over the lake is strong during the night. Thus the Lake Namco makes PBL height over the lake lower than the land during the day and higher in night. Observation analysis shows that the mean PBL height is higher in daytime and lower at nighttime in TP and its downstream areas [44]. Based on these studies, the three largest lakes in TP are responsible for the large centers in the minimum PBL heights at the same locations and also for the large centers in the average hourly PBL heights.
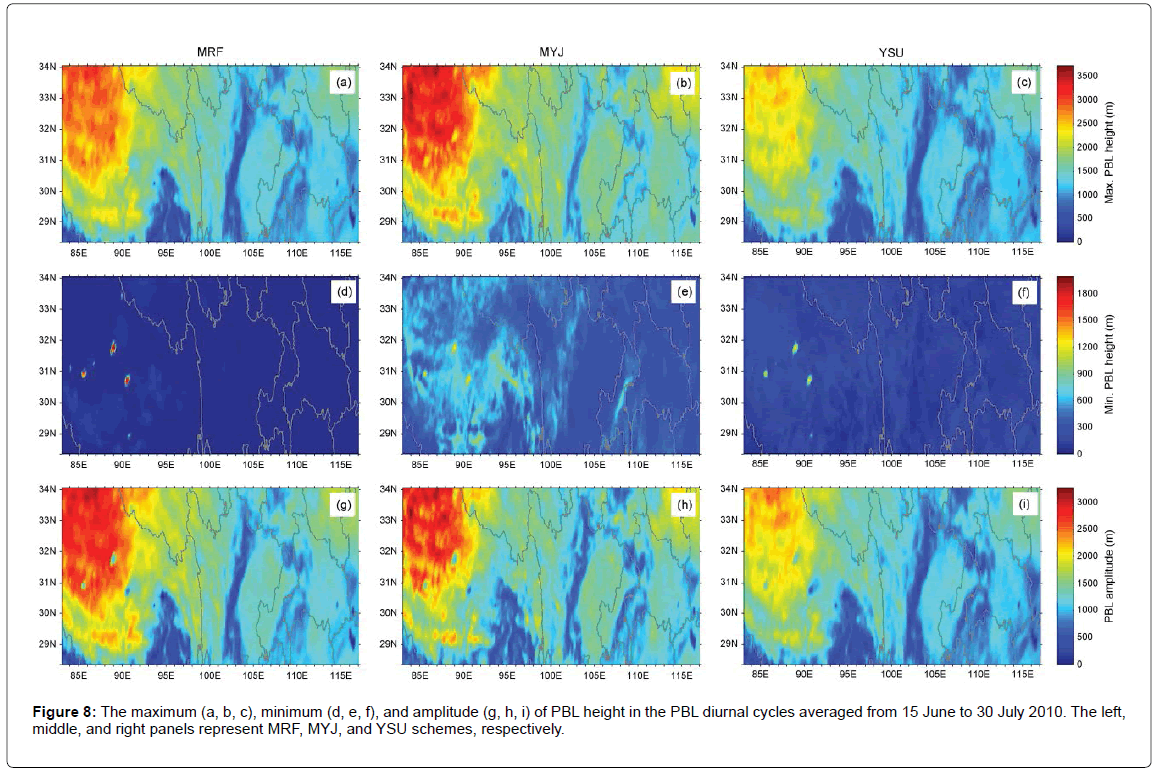
Figure 8: The maximum (a, b, c), minimum (d, e, f), and amplitude (g, h, i) of PBL height in the PBL diurnal cycles averaged from 15 June to 30 July 2010. The left, middle, and right panels represent MRF, MYJ, and YSU schemes, respectively.
Figure 9 illustrates the time series of PBL heights. The maximum PBL heights in MRF, MYJ, and YSU schemes occur closely in time. However, the time series of the minimum PBL heights by the three PBL parameterizations show some differences. For MRF scheme, the minimum PBL heights mainly occur after midnight and before 08 LT over TP and its downstream areas, but they occur at night before 24 LT in some regions of the eastern TP. For MYJ scheme, the minimum PBL heights mostly occur at night before 24 LT in the north TP and before noon in the south TP, and in the upper and middle YRV they occur around 20 LT and just after midnight. For YSU scheme, the minimum PBL heights occur before noon in most areas, and in some regions of the east TP and its downstream areas they occur around midnight. It seems that different PBL parameterization schemes can impact on the occurrence time of the minimum PBL heights, but the impact is weak for the occurrence time of the maximum PBL heights.
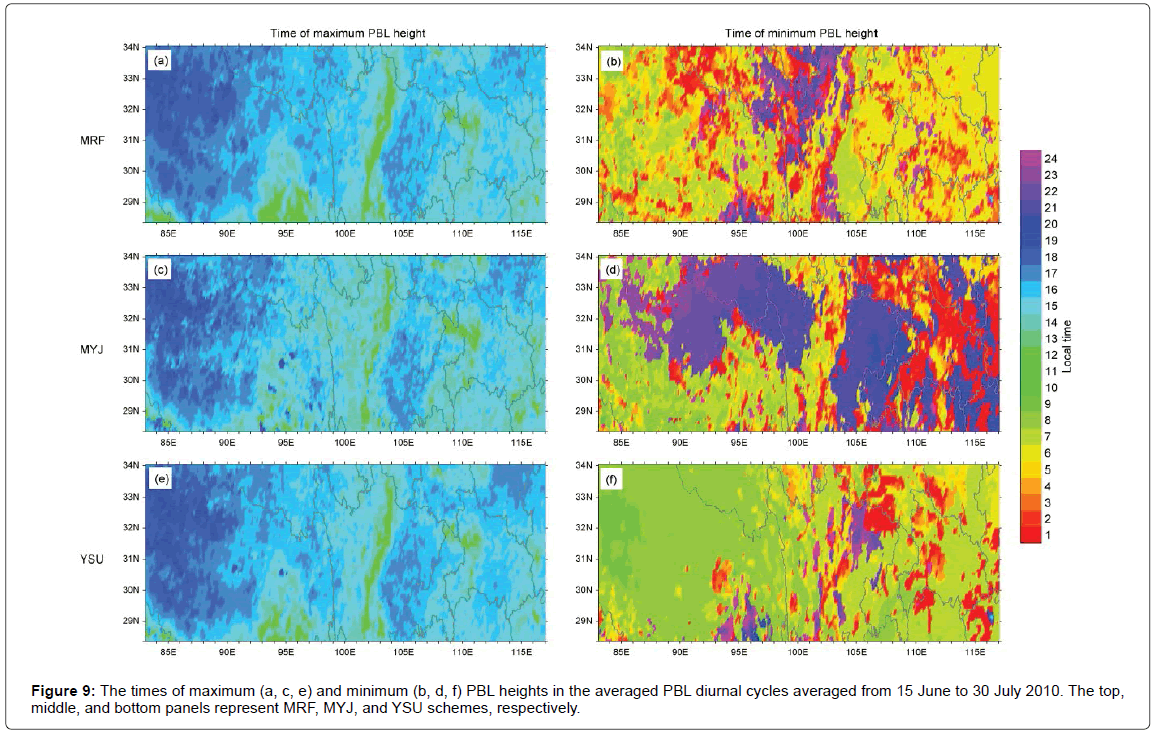
Figure 9: The times of maximum (a, c, e) and minimum (b, d, f) PBL heights in the averaged PBL diurnal cycles averaged from 15 June to 30 July 2010. The top, middle, and bottom panels represent MRF, MYJ, and YSU schemes, respectively.
To explore the diurnal cycles of PBL height over TP and the upper and middle YRV in general, the gridded PBL heights are averaged over these three regions. As shown in Figure 10, the simulated PBL heights generally show a similar diurnal cycle in the above three regions, where the PBL heights are lower at nighttime and higher at daytime. This result is consistent with the observational analysis result of Xu et al. [44]. As shown in Figure 9, the choice of PBL schemes has weak impact on the occurrence time of the maximum PBL height; all three PBL schemes have the maximum PBL heights at 14-15 LT. Although the choice of PBL schemes shows impact on the occurrence time of the minimum PBL heights, the impact is weakened in the averaged PBL height diurnal cycles as the PBL structure tends to be stable at night-time and the PBL heights vary small [44]. However, the PBL height of MYJ scheme still presents the two weak minima at 07 LT and 22 LT in TP, and in the upper and middle YRV, the two weak minima occur at 01 LT and 20 LT. For YSU scheme, the weak minimum PBL height occurs at 08 LT in TP and 07 LT in the upper and middle YRV. However, the PBL height of MRF scheme is almost constant during 19-08LT. Some differences are found in the PBL heights from various parameterizations, the PBL height during the day is usually the highest in MYJ scheme and the lowest in YSU scheme, and at night-time it is also the highest in MYJ scheme but the lowest in MRF scheme. It seems that the fundamental differences of the PBL schemes result in the different PBL heights, and as the next generation of MRF PBL, YSU scheme makes a lower (higher) PBL height than MRF scheme does in daytime (night-time).
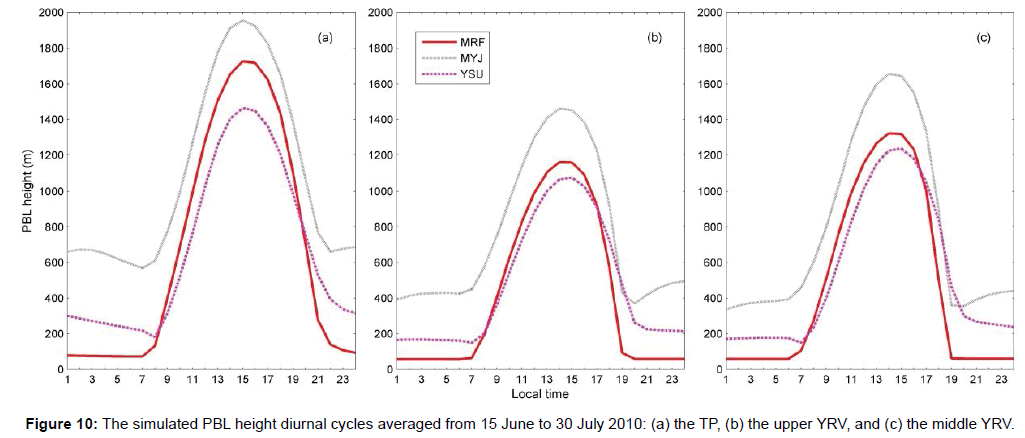
Figure 10: The simulated PBL height diurnal cycles averaged from 15 June to 30 July 2010: (a) the TP, (b) the upper YRV, and (c) the middle YRV.
As mentioned above, all three PBL schemes present a similar diurnal cycle in their PBL heights, and the precipitation diurnal cycles simulated with the three PBL schemes also behave in a similar pattern (Figure 6). Moreover, they did show discrepancies in both the PBL height and the precipitation amount. As PBL height contributes to the development of strong vertical motion and benefits the increase in precipitation [16], the differences of PBL heights are responsible for the discrepancies in simulated precipitation amounts. Among the three PBL schemes, MYJ scheme has the highest PBL height and the largest discrepancy between the simulated and observed precipitation amounts. Although MRF scheme has a higher PBL height than YSU scheme does in daytime and lower at night-time, the simulated precipitation diurnal cycle of MRF scheme is the closest to the observed precipitation, and that of YSU scheme is intermediate. There is no direct way to compare the simulated PBL height of MRF scheme to the observed PBL. It would require further research on whether the overestimated or underestimated PBL heights can result in a larger discrepancy between the simulated and observed precipitation amounts, which is beyond the scope of this paper.
The hourly precipitation and its diurnal cycle over TP and its downstream areas have been simulated from 15 June to 30 July 2010 with WRF model using three PBL schemes (MRF, MYJ, and YSU), and the simulations were compared to the observed precipitation in order to show the impact by the three PBL schemes. Moreover, the PBL heights were simulated using the three PBL schemes to investigate the discrepancies and the relationship with the simulated precipitation. On the basis of analyses of a 1,080 hour data set and the comparisons between the simulated and observed precipitation, the following conclusions are reached:
• WRF model overestimates hourly precipitation in TP and its downstream areas, especially for the middle YRV. This model has a systematic model bias. This bias could help for future research on these parameterization schemes. Compared to the observed precipitation, the simulated hourly precipitation has a good correlation in the upper and middle YRV but not over TP. The positive bias area of the simulated hourly precipitation is the largest in MYJ scheme and the smallest in MRF scheme. In general, the spatial correlation coefficients in TP and the upper YRV are the largest in MYJ scheme and the smallest in MRF scheme, but the spatial bias is the smallest in MRF scheme and the largest in MYJ scheme. For the middle YRV region, the spatial bias is also the smallest in MRF scheme and the largest in MYJ scheme; the spatial correlation coefficient is the largest in YSU scheme and the smallest in MRF scheme.
• For simulating the precipitation diurnal cycle, the simulated maximum precipitation is close to the observation over TP, and it is greater than the observation in TP’s downstream areas with the largest discrepancy in MYJ scheme and the smallest discrepancy in MRF scheme. However, the simulated minimum precipitation is greater than the observation in TP and close to the observation in TP’s downstream areas, and the discrepancies among MRF, MYJ, and YSU schemes are insignificant. In simulating the time series of the maximum and minimum precipitation, the discrepancies among the three PBL schemes are insignificant, and the simulated maximum and minimum precipitation occur close in time to the observation in the east TP and the middle YRV, but in the west TP and the upper YRV, they occur approximately 12 h off from the observation. In general, WRF model well simulates a trend in the diurnal cycle of precipitation in TP but not in the upper YRV. Although WRF model simulates a two-peak pattern different from the observed one-peak pattern in the middle YRV, both of them generally show similar patterns. Additionally, the choice of PBL parameterization affects not only the amplitude of precipitation but also the phase of diurnal cycle, and MRF scheme simulates better in precipitation amount than YSU and MYJ schemes.
• The hourly PBL height of MYJ scheme is higher than those for MRF and YSU schemes, and three large centers of PBL heights appear over the central TP especially in MRF scheme. These large centers are caused by the three largest lakes in the central TP that is responsible for the maximum centers in the simulated precipitation at the same locations. In simulating the PBL diurnal cycle, all three PBL schemes occur close in time for the maximum PBL heights, but the times for the minimum PBL height are different. In general, the simulated PBL height has a similar diurnal cycle in the three PBL schemes. The PBL height in daytime is the highest in MYJ scheme and the lowest in YSU scheme, and the PBL height at nighttime is also the highest in MYJ scheme but the lowest in MRF scheme. The differences of PBL heights are responsible for the discrepancies in simulated precipitation amounts.
This study shows that all three PBL schemes present a similar diurnal cycle in their PBL heights and simulated precipitation. As PBL height can help with the increase in precipitation, the differences of PBL heights are responsible for the discrepancies in simulated precipitation amounts. Additional research on comparing the simulated and observed PBL heights is very important to obtain more understanding on this issue. Moreover, the present study mainly examines the sensitivity of simulated precipitation to the choice of three PBL schemes over TP and its downstream areas. Because the interaction of other physical schemes (microphysics and cumulus parameterization) with the PBL schemes is another important factor in simulating precipitation, the authors will investigate the sensitivity of moist physics options (microphysics and cumulus parameterization) in future work.
This work was supported by the National Natural Science Foundation of China through Grants 41175016, 41375041 and 41375057, and the open project of Institute of Plateau Meteorology, CMA, Chengdu through Grant LPM2014009. The authors are grateful to the China Meteorological Administration National Meteorological Information Center for providing the observed hourly precipitation.