Journal of Pollution Effects & Control
Open Access
ISSN: 2375-4397
ISSN: 2375-4397
Research Article - (2021)Volume 9, Issue 1
Ozone concentration inside industrial irradiators is considered one of the important safety aspects due to its harm effects upon human and its corrosive effects upon metal parts inside irradiation room. Using ozone monogram, phases of ozone concentrations were determined between ozone concentration, air change rate inside irradiation room, volume of radiation room and source activity. The time for motor malfunction was estimated and also using MATLAB software to calculate these parameters.
Ozone; Ozone generation; Parameters effect of ozone concentration
The industrial irradiators are using in many items, for example, food, clinical disposables, electrical links, gemstones and different items. This process aims to improve the properties or clean and purify these products. In industrial irradiators, electromagnetic radiation (gamma and X-rays) or electrons, before interacting with the products under processing, find a layer of air. When the radiation interacts with this layer, it produces radiolysis effects in the atoms present in the ambient atmosphere; the main interaction is with the oxygen atoms. This interaction is similar to what occurs in the stratosphere, according to the Chapman Cycle [1], when the diatomic molecule of oxygen (O2) absorbs the sun ultraviolet radiation with wavelengths less than 240 nanometers, breaking the connection and separating it into two highly reactive atoms that, when combined with another oxygen molecule, produce ozone (O3). In the troposphere, ozone acts as a protective layer, shielding the earth surface from ultraviolet rays of high energy from the sun [2].
Because it is highly reactive, ozone on the earth's surface is harmful to plants, animals and humans [3,4]. In facilities with gamma irradiation, X-rays or electron accelerators, the ozone produced interacts with the surface of treated products and structural elements of the radiators. Hence, the high concentration of this harmful gas is a job security issue inside its irradiation chamber, especially when the access is required from operators to perform maintenance work or product positioning. Consequently, it is necessary to install a ventilation system to reduce the concentration and subsequent release, within permitted levels of this gas in the environment.
In Co60 industrial irradiator, the air layer between the source and the products under processing interacts with gamma radiation and produces ozone gas [5].
Ozone, as a highly reactive gas, is harmful to human beings. Figure 1 shows the relation between ozone concentrations and decreasing in lung function for different ages [6].
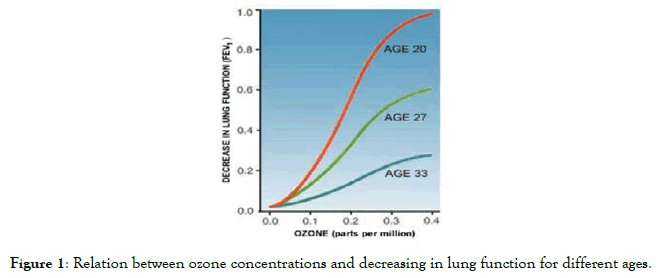
Figure 1. Relation between ozone concentrations and decreasing in lung function for different ages.
Also, Ozone is known as a very corrosive gas and should not be used with metallic materials unless corrosion-proof [7].
To avoid any potential harm for both workers and metallic parts inside irradiation room, a ventilation system is installed to reduce and control concentration and release of ozone in the environment within its permitted levels.
The most known permitted level for the concentration of ozone is 75 ppb (0.075 ppm). But even at low concentrations, 10 ppb (0.01 ppm), this gas can be known by a characteristic odor [8,9].
To determine ozone concentration inside irradiation room, it can either be measured by using measurement equipment or calculated. Calculation by MATLAB can be made either by equations which gives the concentration depending on the time of irradiation or using ozone monogram which gives the maximum concentration of ozone in any given room depending on source activity, air change rate and room volume.
Figure 2 shows a nomogram relating O3 concentration (in ppm) to source activity (in Ci), irradiation room volume (in ft3), and air change rate (per hour).
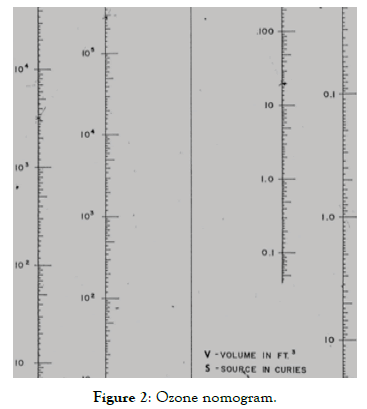
Figure 2. Ozone nomogram.
The source activity is a variable due to the decay of the source. The irradiation room volume differs from one irradiator to another. Also, the air change rate can be changed according to the operators and motor efficiency into the same irradiator.
By making two of the three variables fixed, we can obtain a relation between the ozone concentration and the last variable.
Also there are some equations that represent the ozone concentration inside the irradiation room at various times. These equations can be used to calculate the time needed to eliminate the ozone concentration inside irradiation room if the motor of air change is broken or something like that. These equations are from Technical Reports Series No. 188", published by the IAEA [10]. This paper has the purpose of applying an equation to obtain the equilibrium concentration for O3, as it is a similar phenomenon to the equation mentioned in the reference, where it could be inferred that the O3 concentration, C(t) may be obtained by the equation:
 (1)
(1)
 (2)
(2)
 (3)
(3)
p = A.k (4)
Where:
t=irradiation time (min);
p=O3 production rate (ppb/min);
V=irradiation chamber volume (64 m3);
T1/2=the average time for the decay of O3 in the installation
Flow=an extraction rate of air through the exhaust
A=exposed activity source (PBq)
K=proportionality constant (ppb/PBq.min)
These parameters are the main parameters that determine ozone concentrations inside irradiation room. Changing volume, source activity or air change rate will change the ozone concentration inside irradiation room. The relations between each parameter and the other can be described as follows in Table 1.
| V | 6 | 9 | 15 | 30 | S | ||||||||||||
| A | 10 | 20 | 40 | 50 | 10 | 20 | 40 | 50 | 10 | 20 | 40 | 50 | 10 | 20 | 40 | 50 | |
| 0.45 | 0.25 | 0.11 | 0.09 | 0.34 | 0.17 | 0.09 | 0.07 | 0.3 | 0.14 | 0.07 | 0.06 | 0.15 | 0.08 | 0.04 | 0.03 | 0.1 | |
| C | 1.3 | 0.6 | 0.31 | 0.27 | 1 | 0.5 | 0.26 | 0.2 | 0.8 | 0.4 | 0.2 | 0.18 | 0.5 | 0.26 | 0.12 | 0.09 | 0.3 |
| 2 | 1.09 | 0.6 | 0.4 | 1.6 | 0.9 | 0.4 | 0.35 | 1.4 | 0.65 | 0.34 | 0.3 | 0.8 | 0.36 | 0.2 | 0.16 | 0.5 | |
| 3.5 | 2 | 1.2 | 0.85 | 3 | 1.6 | 0.8 | 0.7 | 2.6 | 1.3 | 0.7 | 0.6 | 1.6 | 0.8 | 0.4 | 0.33 | 1 | |
Table 1: The relations between each parameter and the other (C& A & S & V).
According to the last schedule, the phases of ozone inside irradiation room can be described as follows:
a) Same source (decay of source activity): (V,A) constant
The first phase is about a variation in source activity in the same irradiator. It is the most common case that source are decayed along time. As shown in Figure 3. This is a natural relation where the air change rate is constant and the motor efficiency is the high value 50 m3/min in the same irradiator.
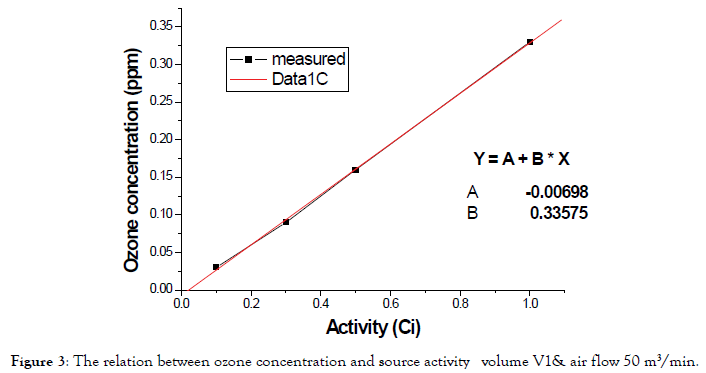
Figure 3. The relation between ozone concentration and source activity volume V1& air flow 50 m3/min.
As in the previous figure, the relation between measured line and linear fit of data is very small that it can be linear. It indicates that ozone concentration decreased when source activity is decreased.
b) Different irradiators: (S,A) constant
The second phase is about a variation in room volume (different irradiators). As shown in Figure 4. This is a natural relation with different room volume (V3<V2<V1) and air change rate is constant and is the high value 50 m3/min in the same irradiator.
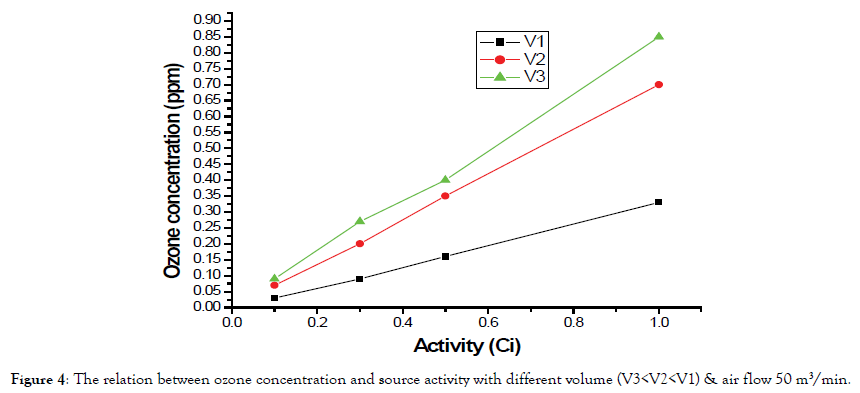
Figure 4. The relation between ozone concentration and source activity with different volume (V3<V2<V1) & air flow 50 m3/min.
As in the previous Figure 5, the relation between measured line and linear fit of data is small that it can be linear. It indicates that ozone concentration decreased when volume is increased.

Figure 5. The relation between ozone concentration and room volume with different flow rate.
c) Change in air change rate: (V, S) constant
The third phase is about a variation in air change rate.
As in the previous Figure 6, there is a variation between the line represents the ozone concentration and flow rate and line fit of data. The line fit of the ozone concentration is decreasing with increasing flow rate.
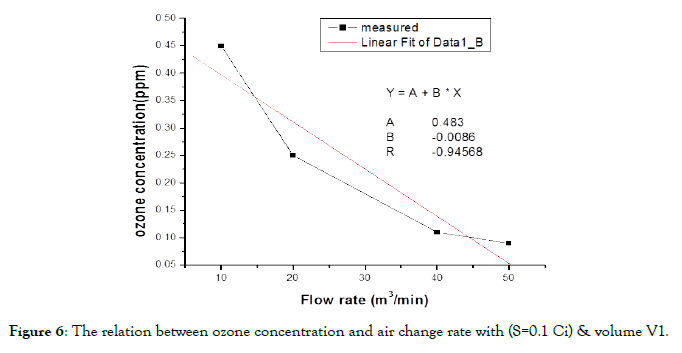
Figure 6. The relation between ozone concentration and air change rate with (S=0.1 Ci) & volume V1.
Figure 7 shows the temporal evolution of the O3 concentration, as time function, for different activities. It was observed that the systems tend to show a region of O3 equilibrium concentration. Measurements were taken from the exhaust pipe, in normal operation
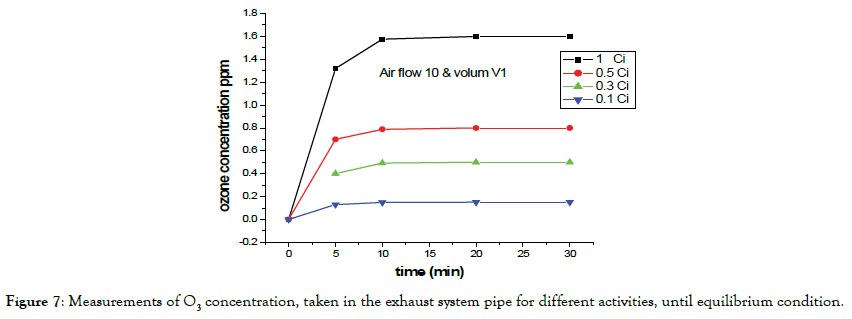
Figure 7. Measurements of O3 concentration, taken in the exhaust system pipe for different activities, until equilibrium condition.
d) Motor malfunction:
The motor which exhausted air outside irradiation room can be damaged due to any malfunction to any part of the motor. Flow rate=0.
According the equation (1), the calculated ozone concentration is shown in Figure 8 which describes the relation between time and ozone concentration for source activity 1 Ci&0.1 Ci.
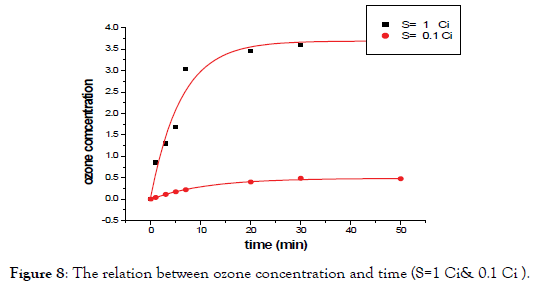
Figure 8. The relation between ozone concentration and time (S=1 Ci& 0.1 Ci ).
According Figure 9 the value of measured O3 concentration in exhaust pipe for activity source S=0.1 Ci and 1 Ci when ventilation is off with volume V3 as follows in Table 2.
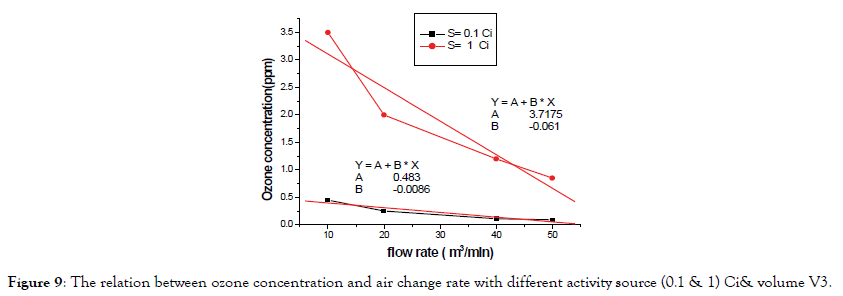
Figure 9. The relation between ozone concentration and air change rate with different activity source (0.1 & 1) Ci& volume V3.
| Activity (Ci) | Maximum concentration (ppm) | T1/2 |
| 1 | 3.71 | 7.2 min |
| 0.1 | 0.483 | 5.8 min |
Table 2: The Activity and max ozone concentration and half life time.
According Figure 10 the value of measured O3 concentration in exhaust pipe for activity source S=0.1 Ci and 1 Ci when ventilation is off with volume V1 as follows in Table 3.
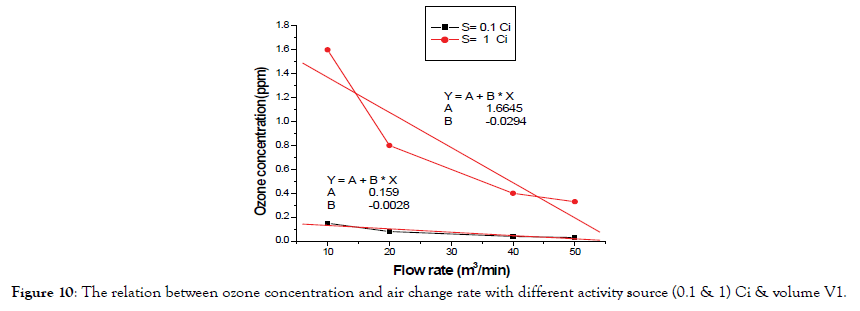
Figure 10. The relation between ozone concentration and air change rate with different activity source (0.1 & 1) Ci & volume V1.
| Activity (Ci) | Maximum concentration (ppm) | T1/2 |
| 1 | 1.66 | 2.8 min |
| 0.1 | 0.159 | 0.844 min |
Table 3: The Activity and max ozone concentration and half life time.
Figure 11 shows the O3 decay curve in the exhaust pipe, with the exhaust system on, and after gathering sources of cobalt-60. It could be seen that after 50 min, the O3 concentration is already lower than the limit for workers (0.08 ppm).

Figure 11. O3 decay curve in the exhaust pipe, with the exhaust system is not working, in the In Co60 industrial irradiator with activity source 1 Ci.
These procedures require that precautions should be taken for the protection of every employee who may be exposed to hazardous substances. Such exposures to higher levels of ozone can cause serious health effects and present a higher risk to people.
The smell of ozone can be detected at 0.1 ppm or below, so that any room free of the characteristic odor may be regarded as safe from this radio lytic gas. On the other hand, if the odor is strong or frequently detected, an assessment should be made with monitoring equipment.
Citation: Noaman A (2021) Simulation of Ozone Concentrations Inside Co60 Industrial Irradiator. J Pollut Eff Cont 9:266. doi: 10.35248/2375-4397.20.9.266.
Received: 15-Nov-2020 Accepted: 11-Jan-2021 Published: 18-Jan-2021 , DOI: 10.35248/2375-4397.20.9.266
Copyright: © 2021 Noaman A. This is an open-access article distributed under the terms of the Creative Commons Attribution License, which permits unrestricted use, distribution, and reproduction in any medium, provided the original author and source are credited.