Journal of Tumor Research
Open Access
ISSN: 2684-1258
ISSN: 2684-1258
Research Article - (2022)Volume 8, Issue 4
Background: To our knowledge, no current guideline exists in outlining follow-up or interventional strategies in musculoskeletal soft tissue tumor management. To develop and validate Soft-tissue Tumor Reporting and Data System (ST-RADS) with the hypothesis that the proposed guideline reliably and accurately assists in separating benign from malignant musculoskeletal soft tissue tumors.
Methods: This is a multi-institutional cross-sectional study of soft-tissue masses. An expert consensus agreement was reached for ST-RADS categories using the terminology from WHO classification. Adipocytic tumors, T2-hyperintense and T2-hypointense masses of extremities with a wide spectrum of histologies were assessed. MRI categories were: STRADS 0-incomplete imaging, I-no lesion identified, II-definitely benign, III-probably benign, IV-indeterminate or suspicious for malignancy, V-highly suggestive of malignancy, and VI-known biopsy-proven malignancy or recurrence. Eight readers’ evaluated cases and ICC (Intra-Class Correlation) and AUC (Area Under the Curve) were calculated.
Results: 200 soft tissue masses were tested. There was good inter-reader agreement with ICC (Intra-Class Correlation)=0.72 [95% CI=0.64-0.79] and 0.69 [95% CI=0.59-0.70] for adipocytic and T2-hyperintense, and fair, 0.48 [95% CI=0.35-0.62] for T2-hypointense masses. The sensitivity and specificity for detection of malignancy were 96% and 63%, 93% and 71%, 64% and 84% for adipocytic, T2-hyperintense, and T2-hypointense masses, respectively. The AUC (Area Under the Curve) was 0.79-0.89.
Conclusion: ST-RADS guideline using standardized terminology stratifies musculoskeletal tumors into benign and malignant categories and provides management strategy. This MRI-based guideline is meant to be a "dynamic" document that can be further refined and updated in response to future user feedback and as new scientific data becomes available.
Sarcoma; MRI; Extremities; Biopsy; Guideline
AUC: Area Under the Curve; ADC: Apparent Diffusion Coefficient; DWI: Diffusion Weighted Imaging; ICC: Intra-Class Correlation; ST-RADS: Soft-tissue Tumor Reporting and Data System; TSGCT: Tenosynovial Giant Cell Tumor
Soft tissue tumors of extremities are commonly encountered [1,2]. These musculoskeletal tumors vary from ganglion cysts and lipomas to malignant sarcomas with confounding clinical presentations. These occur across all demographics, with benign soft tissue tumors being one hundred times more common than malignant tumors [3]. Malignant soft tissue tumors, though uncommon, lead to a substantial impact on the health system. While the total economic costs of soft tissue sarcomas are unknown, the financial burden can easily reach $100,000 per patient [4].
While ultrasound is a good screening tool, Magnetic Resonance Imaging (MRI) is the non-invasive modality of choice to evaluate soft tissue tumors due to its inherent superior soft-tissue contrast [5- 7]. MRI is useful for tumor localization, tissue characterization, and local staging to guide biopsy and surgical planning [8-10]. Despite advances in imaging, rendering a specific diagnosis for these soft tissue tumors and tumor-like lesions (tumor mimics) remains challenging. The tumors can be predominantly hyperintense or hypointense on T2-Weighted (T2W) imaging with nonspecific imaging findings and require a biopsy for confirmation [10,11]. For malignant soft tissue tumors, the final diagnosis is usually established after histopathological analysis, and staging on imaging along with multidisciplinary discussion with teams of experts ultimately dictates the management [9]. Traditional treatment for benign masses can vary from conservative management or surgical excision while a combination of radiation, chemotherapy, and surgical excision is used for higher-grade malignant tumors. Biopsy and surgery can provide definitive diagnosis but are invasive measures and may unnecessarily pose unwanted risks to the patients [12,13]. In patients at low risk of malignancy on imaging, such as typical ganglion cyst, vascular malformations, etc., the aim is to maximize outcomes and minimize morbidity and psychological stress by eliminating unnecessary biopsy and surgical procedures. However, these goals may not be achieved without a clinically meaningful classification system or standardized guidelines.
To the author’s knowledge, there are no validated or standardized guidelines for a MRI reading radiologist that aid in the differentiation of benign from malignant soft tissue tumors, outline strategy for follow-up, or dictate the necessity for invasive measures, such as biopsy and surgery. To that end, experienced musculoskeletal radiologists from three tertiary care university centers created a MRI reporting guideline for extremity soft-tissue tumors (Soft-tissue Tumor Reporting And Data System, ST-RADS) like the BI-RADS (Breast Imaging- Reporting and Data System) classification used for breast tumors [14,15], and the tumors were placed in different classes based on the recent World Health Organization (WHO) classification published in 2020. Since soft tissue tumors encompass a variety of histologies, validation of this classification system was performed using a multi-reader blinded evaluation of a large spectrum of soft tissue tumors and tumor-like lesions.
This study aims to develop and validate a standardized guideline that radiologists can use to differentiate benign from malignant soft tissue tumors and suggest appropriate management. We hypothesized that ST-RADS shows multi-reader reliability and can differentiate benign from malignant tumors with good accuracy (AUC).
This was a retrospective, HIPAA compliant, cross-sectional multi-institutional and multi-reader study involving three institutions. Anonymized MRI studies were presented to the readers with proven cases randomly extracted from different institutions as part of retrospective Institutional review boards, and the informed consent was waived. Inclusion criteria: Musculoskeletal soft tissue tumors of upper and lower extremities with complete MR imaging sets (as defined below) of adipocytic (fat containing on MRI or histology), T2-hyperintense tumors and tumor-like lesions (hyperintense than muscle signal) and T2-hypointense masses and tumor-like lesions with histology proof via biopsy and/or final post-surgical histology, and the exclusion criteria were incomplete imaging set and lack of final clinical diagnosis, e.g. lack of arthroscopy for parameniscal cyst or final clinical diagnosis of Gout.
Development of soft-tissue tumor reporting and data system (ST-RADS) consensus document
ST-RADS consensus document was created by reviewing WHO document, the consensus opinion of tumor imaging experts from all three institutes, input from clinicians and expert methodologist from the primary institution (Table 1). WHO classification of soft tissue tumors was used as a guide to place a spectrum of commonly encountered histologies in various categories of ST-RADS (Supplementary Table 1). As indicated in Table 1, all soft tissue tumors were classified into one of the ST-RADS categories 0-VI as outlined in Table 2 and was evaluated for study purposes.
| Classification | Category | Management | Likelihood of malignancy |
|---|---|---|---|
| ST-RADS 0 | Incomplete imaging | Recall for additional imaging and/or await prior examinations. | N/A |
| ST-RADS I | No lesion identified | No further imaging follow-up | Essentially 0% |
| ST-RADS II | Definitely benign | Follow-up as per clinical team recommendations | Essentially 0% |
| ST-RADS III | Probably benign | Follow-up in 3 months, six months, one year, and two years or <2years/shorter-term follow-up if the lesion resolves or significantly regresses | Less than or equal to 2% |
| ST-RADS IV | Suspicious for malignancy or indeterminate | Tissue diagnosis or follow-up in 4-6 weeks interval, and regular interval follow-up for upto 2years | More than 2% and less than 50% |
| ST-RADS V | Highly suggestive of malignancy | Tissue diagnosis | More than or equal to 50% |
| ST-RADS VI | Known biopsy-proven malignancy or recurrent malignancy in the tumor bed | Surgical excision or further treatment as clinically appropriate | N/A |
Table 1: ST-RADS classification and guideline.
| Classification | Category | Adipocytic tumors (100) | T2-hyperintense Lesions (50) | T2-hypointense Lesions (50) |
|---|---|---|---|---|
| ST-RADS 0 | Incomplete imaging | - | - | - |
| ST-RADS I | No lesion identified | - | - | - |
| ST-RADS II | Definitely benign | Lipomatosis (1), Lipoma (17), Fibrolipoma of nerve (2), Dermatolipoma (1), Fat necrosis (1), Hematoma (3), Hemangioma (3), Lymphedema (1), lipoma arborescence (1), Elastofibroma (1) | Geyser (2), Parameniscal cyst (1), Hemangioma (3), Paralabral cyst (2), Venous malformation (1), Degloving lesion (1), Ganglion cyst (1) | Plantar fibroma (1), Gout (3) |
| ST-RADS III | Probably benign | Lipoblastoma (1), Angiolipoma (7), Myolipoma of soft tissue (1), Chondroid lipoma (1), Spindle cell / pleomorphic lipoma (6) | Myxoma (7), Bursitis (Rheumatoid, subtendinous, adventitial) (4), Hematoma (3), Intraneural ganglion (2), Seroma (1), Benign PNST (3), Cysticercosis (1), Mycobacterial TS (1), Abscess (1), Desmoid (1) | Desmoid (4), TSGCT (4), Desmoplastic fibroblastoma (7), Ossifying fibromyxoid tumor (2), Pilomatricoma (2), Fibroma of tendon sheath (1), Granular cell tumor (1) |
| ST-RADS IV | Suspicious for malignancy or indeterminate | Atypical lipomatous tumor andWell-differentiated liposarcoma (13) | Cellular fibromatosis (1) | - |
| ST-RADS V | Highly suggestive of malignancy | Dedifferentiated liposarcoma (11), | Sarcoma (5), Synovial sarcoma (3), Myxoid liposarcoma (6) | Undifferentiated pleomorphic sarcoma (5), Extraskeletal osteosarcoma (6), Synovial sarcoma (3), Fibrosarcoma- epithelioid (5) myxofibrosarcoma (3), Fibromyxoid sarcoma (1), Sarcoma NOS (1), |
| ST-RADS VI | Known biopsy-proven malignancy or recurrent malignancy in the tumor bed | None | None | - |
Table 2: Soft tissue tumors tested in the study for validation (200 total assessed-100 adipocytic, 50 T2-hyperintense, and 50 T2-hypointense- numbers of lesions tested are highlighted in parentheses).
ST-RADS 0 were used in the event of a non-diagnostic study/incomplete imaging, and further imaging is required.
A complete MR imaging study is defined as the one with full tumor coverage in each of these imaging sequences in at least one plane: T1W Imaging (T1WI), fluid sensitive sequence (fat suppressed T2WI or T2WI, or inversion recovery), and post-contrast fsT1WI. An incomplete MR imaging study is defined as the absence of one of the above-described sequences [6,16,17].
A recent examination with an additional complement of MRI sequences may suffice as complete MR imaging if obtained within two weeks of an incomplete imaging set. Diffusion-Weighted Imaging (DWI) is an emerging modality and is not universally used [18-20]. Apparent Diffusion Coefficient (ADC), if available during interpretation, can be used as a supplemental finding for the diagnosis [18-23].
ST-RADS I was used if no lesion is identified, and no further follow-up is needed.
ST-RADS II was used when the lesion is definitely benign, and no follow-up needed. Representative masses include simple lipoma with a uniform fat signal on all sequences with complete suppression on fat saturation or inversion recovery images and no appreciable enhancement, can be upto 10 cm [24-26], completely calcified hypointense lesions as also confirmed with radiographs or CT imaging, or fluid intensity (markedly hypointense on T1WI and markedly hyperintense on T2W) mass connected to a joint or bursa with no intravenous contrast enhancement [27,28]. Other masses include those with classic imaging features and spatial location of a benign tumor, such as plantar fibroma, fat necrosis [29], elastofibroma dorsi of chest wall [23,30], fibrolipoma of nerve [31-33], hemangioma or venous malformation with phlebolith(s), especially with additional radiographic demonstration [5,34], peri-articular gouty tophus with cortical erosions (especially if radiographs are available) in the setting of elevated serum uric acid levels, Morel-Lavallée lesion [35], parameniscal or paralabral cyst or geyser phenomenon, venous or lymphatic malformation [12], sarcoid or rheumatoid nodule in classic locations with a known history of the respective systemic disease, Morton’s neuroma, and thrombosed vein or artery. ST-RADS II lesions usually show no enhancement or thin (<2 mm) peripheral and/or septal enhancement on the post-contrast study with no significant diffusion restriction. Variable enhancement may be seen with otherwise classic lesions, such as plantar fibroma, Morton’s neuroma, elastofibroma dorsi, hemangioma and arthritis related nodules. DWI, if obtained, exhibits moderate-marked hyperintensity of the lesion on both DWI and ADC images, with a mean ADC value>1.5-3.0 × 10⁻³ mm2/s [18].
ST-RADS III was used for probably benign masses with less than or equal to a 2% chance of malignancy. These masses are recommended to be followed until two years or until the lesion spontaneously resolves or significantly regresses. Representative masses include fluid intensity lesion adjacent to a joint or bursa, possibly a septated ganglion cyst, or fibrous tissue signal lesions in relation to fascia and muscles, eg: classic palmar or plantar fibromatosis [36] (moderately-markedly hypointense on T1W and T2W imaging), or intramuscular lesion such as a myxoma [37,38]. Intra-muscular myxoma can be a pathognomonic diagnosis [39] but may show heterogeneous enhancement, that is why it is placed in ST-RADS III and not II or IV. Plantar fibroma is placed in ST-RADS II as it is a classic benign diagnosis with a pea-shaped enhancing nodule in relation to central cord of plantar fascia. Fibromatosis is however placed in ST-RADS III as these can be larger, sheet-like, multifocal, locally aggressive (rarely metastasizing), and can mimic low grade sarcoma [40]. In addition, ST-RADS guide is not intended to match a particular histology with a particular ST-RAD grade as the histology wouldn’t be known prospectively but is envisioned as a system that can be of practical use and which can be tested prospectively refined as more experience is garnered over the years. Other tumors or tumor-like lesions include those with typical imaging features, e.g. lipoma with metaplastic calcification or ossification, myositis ossificans (history of trauma, internal hemorrhage, marbled muscle-like appearance of the mass, and developing peripheral calcification on the corresponding radiograph or CT), benign peripheral nerve sheath tumors [31, 33] (target or fascicular sign, absent peritumoral edema or necrosis, length <5 cm, underlying schwannomatosis, absent rapid growth or new or sudden neurological deficit or excessive pain), synovial chondromatosis, Tenosynovial Giant Cell Tumor (TSGCT), Desmoid, and angiolipoma [19]. Post-contrast imaging of such lesions may exhibit no enhancement or thin (<2 mm) peripheral and/or septal enhancement, such as a ganglion cyst or bursitis, or variable enhancement with other lesions. DWI, if obtained, exhibits moderate-marked hyperintensity of the lesion on DWI and mild-moderate hyperintensity on ADC images, with generally a mean ADC value=1.2-2.0 × 10⁻³ mm2/s. Caution needs to be exercised with certain lesions, such as TSGCT and myxoid lesions [40]. TSGCT typically shows hypointense to moderately hyperintense DWI signal, and mean ADC can be low, varying from 0.8-1.3 × 10⁻³ mm2/s [21]. Both benign and malignant myxoid tumors commonly exhibit high ADC values [41].
ST-RADS IV was used for potentially malignant, but indeterminate tumors, and the suspicion for malignancy is more than 2% and less than 50%. The recommendation is tissue biopsy or short-term follow up in 4-6 weeks, and regular interval follow-up for upto 2 years. Tumors in this category may exhibit mixed intensity on MR imaging, a solid appearance, however less than 5 cm maximum length, or a lipomatous lesion with multiple septations without a solid focal nodule or myxoid change. Representative tumors include atypical lipomatous lesion [26,42], solitary fibrous tumor, and Gardner fibroma [36]. On post-contrast imaging, there is variable enhancement. DWI, if obtained, exhibits moderate-marked hyperintensity of the lesion on DWI and mild-moderate hyperintensity on ADC images, with generally a mean ADC value>1.1 × 10⁻³ mm2/s [18,21,43].
ST-RADS V was used for probably malignant tumors where tissue diagnosis is recommended. The probability of malignancy in this group of tumors is 50% or more. On MRI, these tumors exhibit mixed intensity and a solid mass, or a lipomatous lesion containing multiple thick septations or solid nodule (s), and/or myxoid changes or a lipid poor T2 hyperintense enhancing mass. Representative tumors in this category include malignant peripheral nerve sheath tumor [31,44], synovial sarcoma [44,45], undifferentiated pleomorphic sarcoma, myxofibrosarcoma [46], melanoma, and lymphoma [47]. These lesions show variable and solid enhancement with diffusion restriction and mean ADC values=<1.1 × 10⁻³ mm2/s [18]. As with other myxoid tumors, myxoid sarcomas typically have areas of higher mean ADC [22].
ST-RADS VI was used for a known biopsy-proven malignancy or recurrent malignancy in the tumor bed prior to definitive therapy. Recommendations include surgical excision or further treatment as clinically appropriate. Solid nodule or residual/growing mass with imaging features like the pre-intervention lesion in the tumor bed suggests tumor recurrence. Post-contrast imaging typically shows solid nodular enhancement or enhancement similar to the tumor prior to intervention in such cases [48-50]. DWI, if obtained, shows diffusion restriction and mean ADC<1.1 × 10⁻³ mm2/s or similar to that of the pre-intervention tumor [49].
The consensus document was edited, shared electronically among experienced radiologists with sarcoma imaging, and discussed during conference calls. Once agreed upon, multi-reader testing was performed at all three sites. Instead of reviewers guessing qualitatively during read-outs and mentioning likelihood of malignancy on a Likert scale as unlikely, possible, probable, highly likely, etc., quantitative numbers were presented to the reviewers to remind them about the categories as has been validated in the BI-RADS system and how they would have practically reported such studies, e.g. is it significantly indeterminate with still less than 50% probability that one could present a choice of tissue sampling or a short-term follow-up versus more than 50% chance of malignancy that one should obtain tissue sampling. The goal of ST-RADS is a dynamic guideline document that may be refined as more evidence is collected over time.
For validation and testing purposes, commonly encountered tumors in all three described categories were used: adipocytic tumors, T2-hyperintense and T2-hypontense tumors encompassing a mixture of a wide spectrum of common and uncommon histologies as identified from the WHO classification. The hyperintense or hypointense categories were based on predominant tumor appearance on T2W imaging, meaning at least 50% or more of tumor appeared hyperintense or hypointense, respectively.
Data collection and rating procedures
A random sample of soft tissue tumors with complete MR imaging sets of adipocytic and T2-hyperintense tumors and tumor-like lesions with proven histopathological diagnoses were collected and shared among the three institutes using Microsoft PowerPoint presentations (Office 365, Microsoft, Seattle, WA). The data sets were anonymized, and the readers of each site were presented with tumors from the other site. The tumors were displaced in the entirety with most-representative images. The readers were blinded to the final histological diagnosis and the interpretation of the other readers. A musculoskeletal fellow controlled all data and compiled all interpretations in an Excel database (Windows 10, Microsoft, Redwood, WA). DWI and ADC images were available as supplemental images in a few cases, specifically four T2-hyperintense and one adipocytic tumors.
The principal investigator conducted a training session on three separate occasions to standardize the understanding of the ST-RADS consensus document before independent scoring. A total of 200 soft tissue tumors (100 adipocytic tumors, 50 T2-hyperintense tumors, and 50 T2-hyponitense tumors) were evaluated (Table 2). Eight Musculoskeletal radiologists evaluated the studies with their attending level experience ranging from 2 years post-fellowship to more than 30 years of interpreting MR imaging of soft tissue tumors (Table 3).
| Readers | Institution | Experience |
|---|---|---|
| Rad 1 | Institute 1 | >30 years |
| Rad 2 | Institute 1 | >30 years |
| Rad 3 | Institute 2 | 12 years |
| Rad 4 | Institute 2 | 11 years |
| Rad 5 | Institute 1 | 8 years |
| Rad 6 | Institute 2 | 6 years |
| Rad 7 | Institute 2 | 6 years |
| Rad 8 | Institute 3 | 2 years |
Table 3: Readers’ experiences.
Statistical analysis
Intra-Class Correlation Coefficient (ICC (2,1)) with a mixed-effects model was used to assess inter-reader agreement and the reliability of the guideline system. Median ST-RADS from readers use to assess diagnostic performance. Areas under the receiver operating curve (AUC) were calculated. Sensitivity and specificity were also calculated with I/II/III as benign and IV/V as malignant with final histology diagnosis bases on biopsy and/or surgery serving as the reference standard. All analyses were done in R 4.0.2 (Vienna, Austria) by an expert statistician from the primary institution.
The following interpretation of ICC was used: Excellent Agreement: 0.75-1.00; Good Agreement: 0.60-0.75; Fair Agreement: 0.40-0.60; and Poor Agreement: <0.40 [51].
Tumor types
There were 200 soft tissue tumors of various histology, including 100 adipocytic (53 benign and 47 malignant), 50 T2-hyperintense tumors (35 benign and 15 malignant), and 50 T2-hypointense masses (25 benign and 25 malignant). The histopathological diagnoses tested are shown in Table 2. Few representative examples are shown in Figures 1-16.
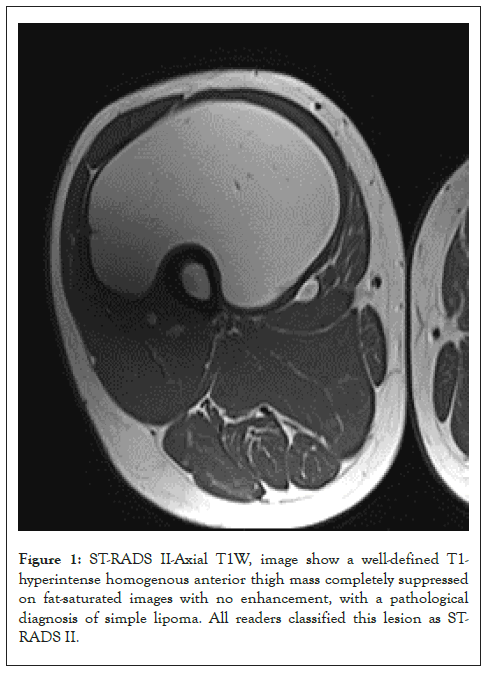
Figure 1: ST-RADS II-Axial T1W, image show a well-defined T1- hyperintense homogenous anterior thigh mass completely suppressed on fat-saturated images with no enhancement, with a pathological diagnosis of simple lipoma. All readers classified this lesion as ST- RADS II.
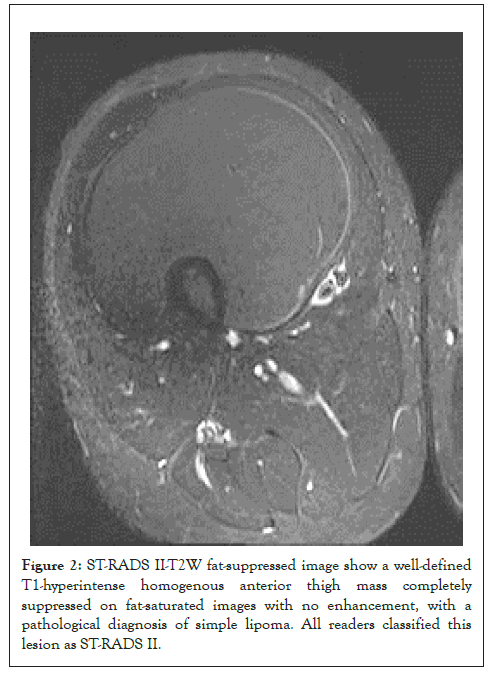
Figure 2: ST-RADS II-T2W fat-suppressed image show a well-defined T1-hyperintense homogenous anterior thigh mass completely suppressed on fat-saturated images with no enhancement, with a pathological diagnosis of simple lipoma. All readers classified this lesion as ST-RADS II.
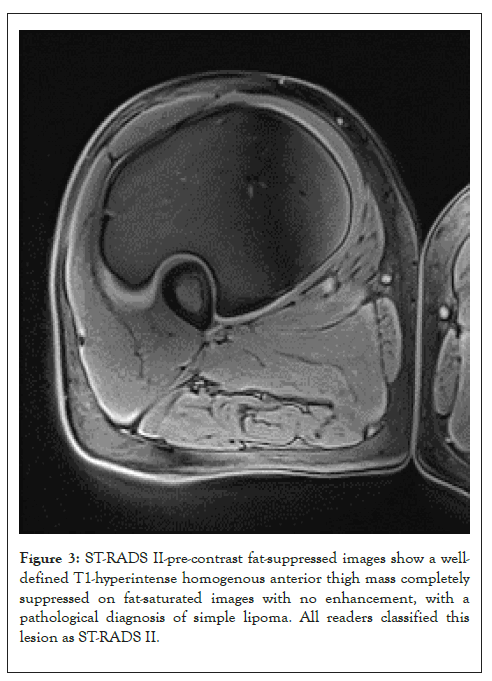
Figure 3: ST-RADS II-pre-contrast fat-suppressed images show a welldefined T1-hyperintense homogenous anterior thigh mass completely suppressed on fat-saturated images with no enhancement, with a pathological diagnosis of simple lipoma. All readers classified this lesion as ST-RADS II.
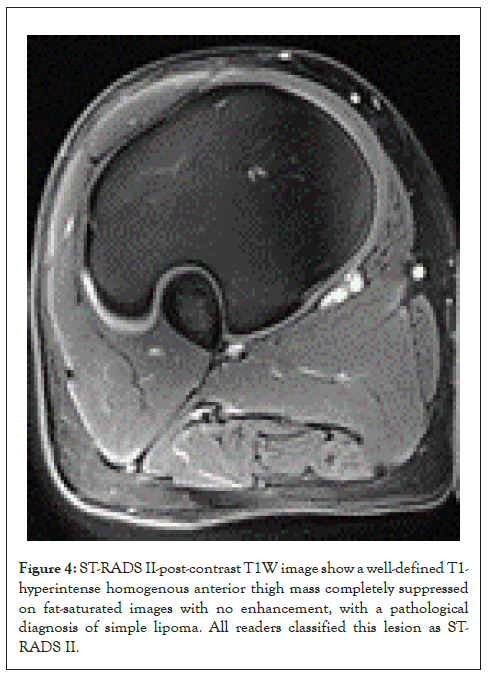
Figure 4: ST-RADS II-post-contrast T1W image show a well-defined T1- hyperintense homogenous anterior thigh mass completely suppressed on fat-saturated images with no enhancement, with a pathological diagnosis of simple lipoma. All readers classified this lesion as STRADS II.
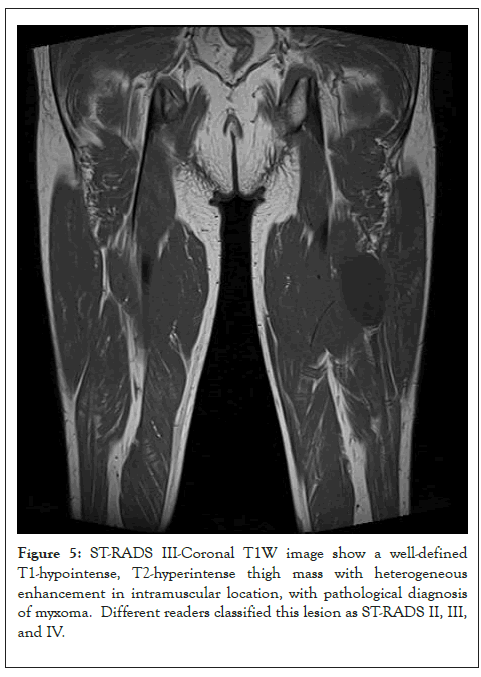
Figure 5: ST-RADS III-Coronal T1W image show a well-defined T1-hypointense, T2-hyperintense thigh mass with heterogeneous enhancement in intramuscular location, with pathological diagnosis of myxoma. Different readers classified this lesion as ST-RADS II, III, and IV.
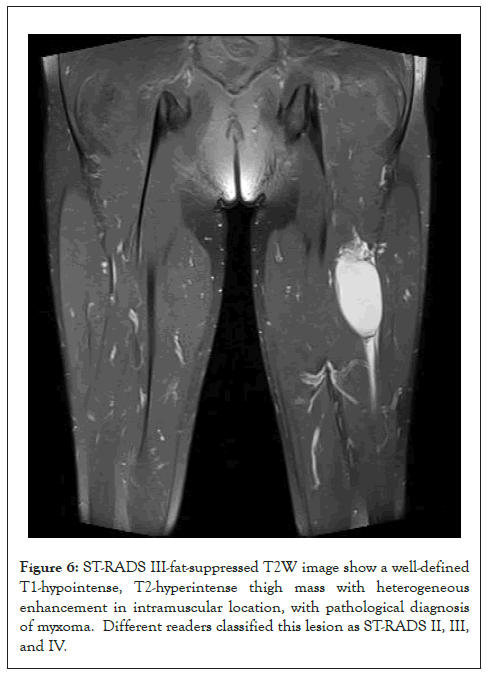
Figure 6: ST-RADS III-fat-suppressed T2W image show a well-defined T1-hypointense, T2-hyperintense thigh mass with heterogeneous enhancement in intramuscular location, with pathological diagnosis of myxoma. Different readers classified this lesion as ST-RADS II, III, and IV.
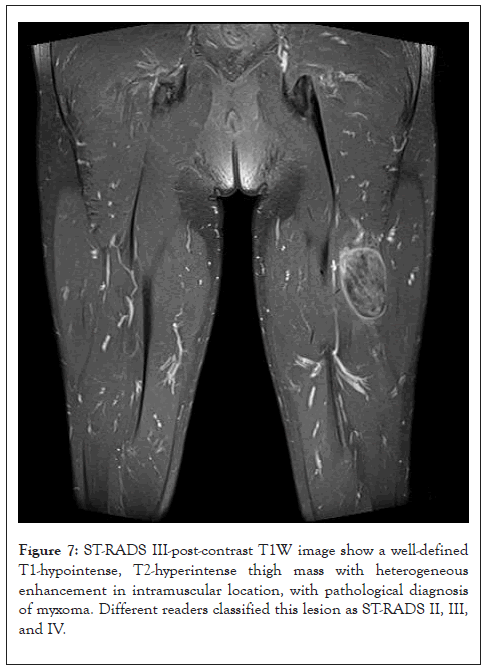
Figure 7: ST-RADS III-post-contrast T1W image show a well-defined T1-hypointense, T2-hyperintense thigh mass with heterogeneous enhancement in intramuscular location, with pathological diagnosis of myxoma. Different readers classified this lesion as ST-RADS II, III, and IV.
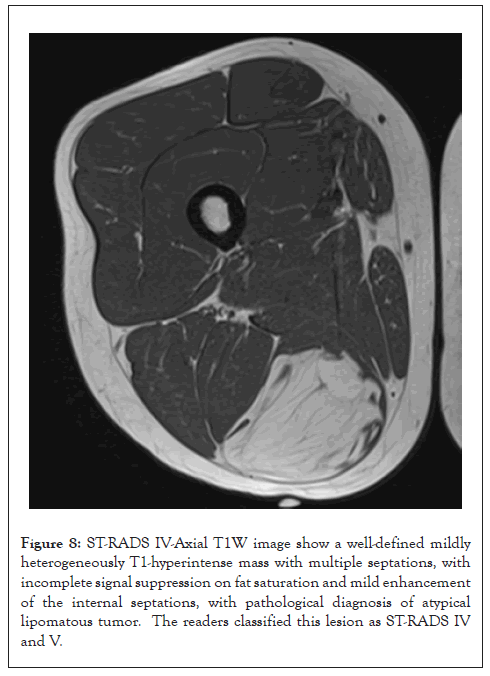
Figure 8: ST-RADS IV-Axial T1W image show a well-defined mildly heterogeneously T1-hyperintense mass with multiple septations, with incomplete signal suppression on fat saturation and mild enhancement of the internal septations, with pathological diagnosis of atypical lipomatous tumor. The readers classified this lesion as ST-RADS IV and V.
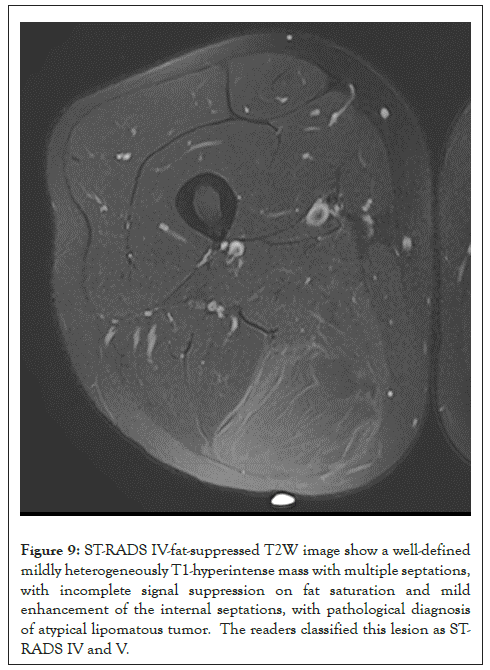
Figure 9: ST-RADS IV-fat-suppressed T2W image show a well-defined mildly heterogeneously T1-hyperintense mass with multiple septations, with incomplete signal suppression on fat saturation and mild enhancement of the internal septations, with pathological diagnosis of atypical lipomatous tumor. The readers classified this lesion as STRADS IV and V.
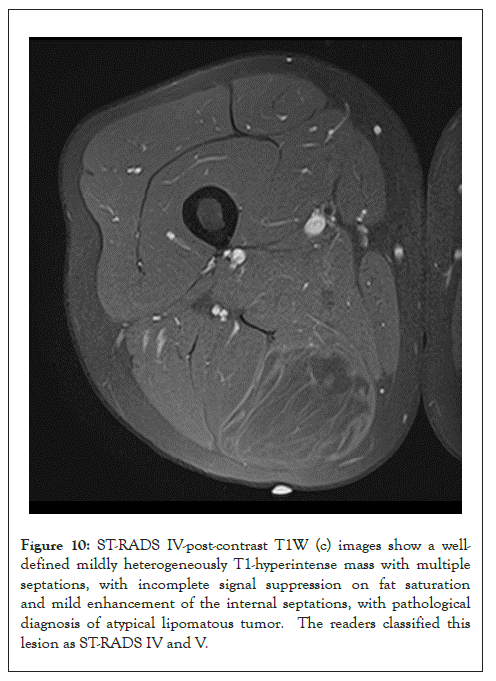
Figure 10: ST-RADS IV-post-contrast T1W (c) images show a welldefined mildly heterogeneously T1-hyperintense mass with multiple septations, with incomplete signal suppression on fat saturation and mild enhancement of the internal septations, with pathological diagnosis of atypical lipomatous tumor. The readers classified this lesion as ST-RADS IV and V.
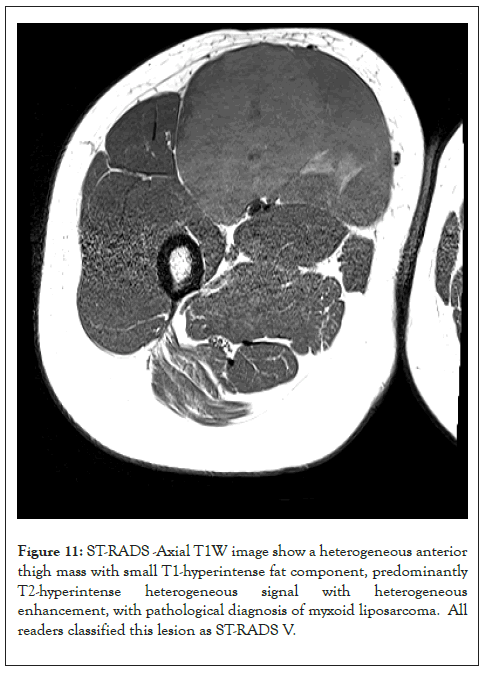
Figure 11: ST-RADS -Axial T1W image show a heterogeneous anterior thigh mass with small T1-hyperintense fat component, predominantly T2-hyperintense heterogeneous signal with heterogeneous enhancement, with pathological diagnosis of myxoid liposarcoma. All readers classified this lesion as ST-RADS V.
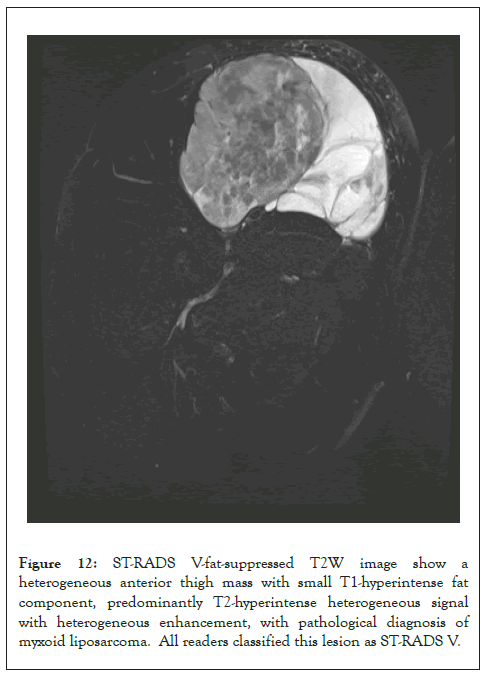
Figure 12: ST-RADS V-fat-suppressed T2W image show a heterogeneous anterior thigh mass with small T1-hyperintense fat component, predominantly T2-hyperintense heterogeneous signal with heterogeneous enhancement, with pathological diagnosis of myxoid liposarcoma. All readers classified this lesion as ST-RADS V.
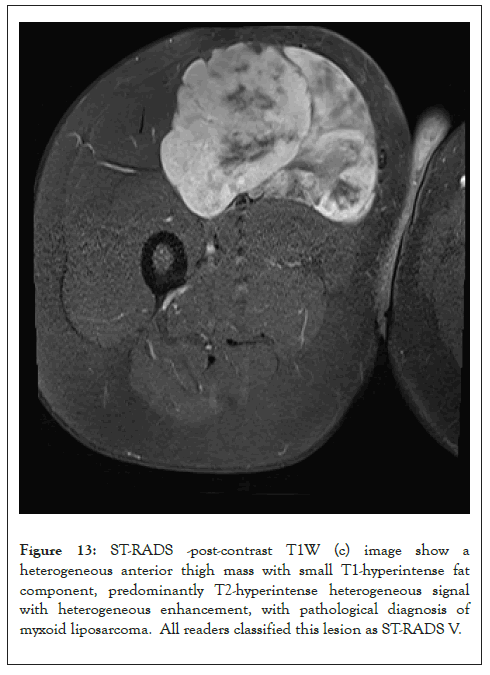
Figure 13: ST-RADS -post-contrast T1W (c) image show a heterogeneous anterior thigh mass with small T1-hyperintense fat component, predominantly T2-hyperintense heterogeneous signal with heterogeneous enhancement, with pathological diagnosis of myxoid liposarcoma. All readers classified this lesion as ST-RADS V.
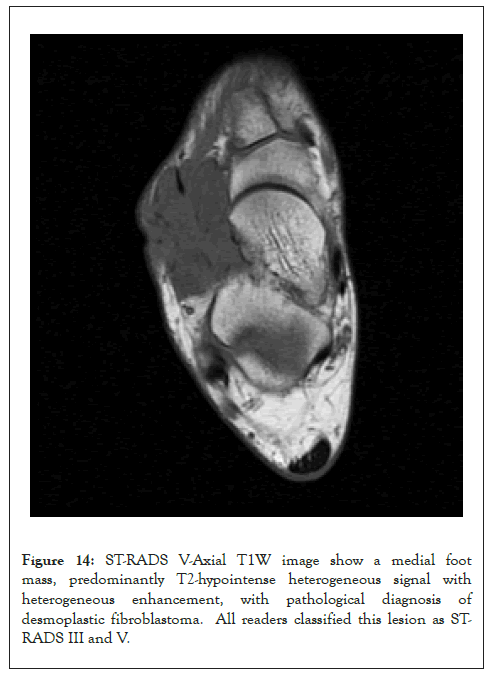
Figure 14: ST-RADS V-Axial T1W image show a medial foot mass, predominantly T2-hypointense heterogeneous signal with heterogeneous enhancement, with pathological diagnosis of desmoplastic fibroblastoma. All readers classified this lesion as STRADS III and V.
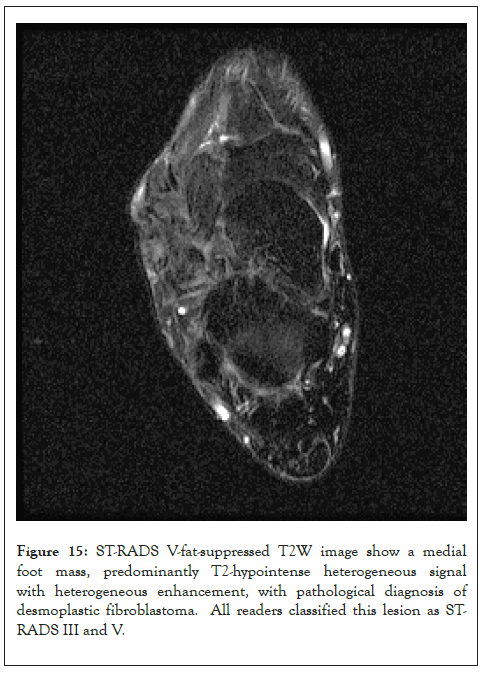
Figure 15: ST-RADS V-fat-suppressed T2W image show a medial foot mass, predominantly T2-hypointense heterogeneous signal with heterogeneous enhancement, with pathological diagnosis of desmoplastic fibroblastoma. All readers classified this lesion as STRADS III and V.
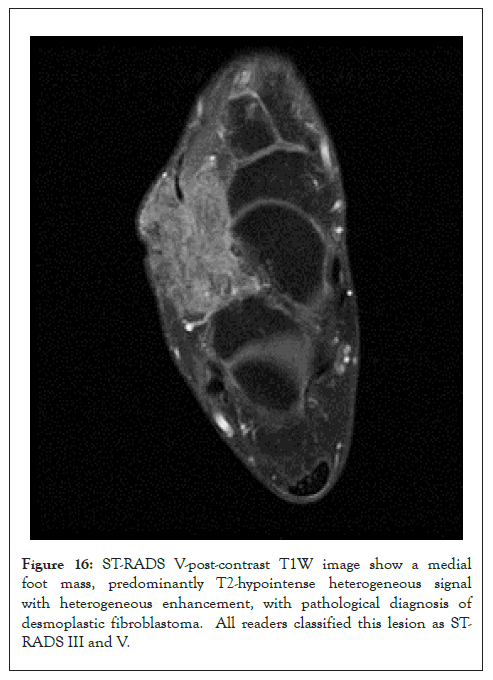
Figure 16: ST-RADS V-post-contrast T1W image show a medial foot mass, predominantly T2-hypointense heterogeneous signal with heterogeneous enhancement, with pathological diagnosis of desmoplastic fibroblastoma. All readers classified this lesion as STRADS III and V.
Reliability of the system
There was a good inter-reader agreement with ICC=0.72 [95% CI=0.64-0.79] for adipocytic tumors and 0.69 [95% CI=0.59-0.70] for T2-hyperintense masses and fair, 0.48 [95% CI=0.35-0.62] for T2-hypointense tumors. Stratified ICC by years of experience (<10 years vs. ≥ 10 years) were also reported (Tables 4-6).
| Hyperintense masses | Sensitivity | Specificity |
|---|---|---|
| T2-hyperintense masses | 93% | 71% |
| T2-hypointense masses | 64% | 84% |
| Adipocytic tumors | 96% | 63% |
Table 4: Intraclass correlation with a mixed-effects model used for inter-reader agreement.
| Hyperintense masses | Sensitivity | Specificity |
|---|---|---|
| T2-hyperintense masses | 93% | 71% |
| T2-hypointense masses | 64% | 84% |
| Adipocytic tumors | 96% | 63% |
Table 5: Sensitivity and specificity of ST-RADS for soft tissue masses.
| ICC | <10 years | >10 years |
|---|---|---|
| Adipocytic tumors | 0.75 (0.65, 0.83) | 0.71 (0.60, 0.80) |
| T2-hyperintense masses | 0.69 (0.56, 0.79) | 0.21 (0.06, 0.40) |
| T2-hypointense tumors | 0.48 (0.31, 0.64) | 0.50 (0.26, 0.69) |
| AUC | <10 years | >10 years |
| Adipocytic tumors | 0.84 (0.76, 0.91) | 0.83 (0.76, 0.91) |
| T2-hyperintense masses | 0.94 (0.86, 0.99) | 0.85 (0.76,0.95) |
| T2-hypointense tumors | 0.75 (0.63, 0.88) | 0.86 (0.76, 0.96) |
| Sens/spec | <10 years | >10 years |
| Adipocytic tumors | 98%/59% | 92%/57% |
| T2-hyperintense masses | 100%/80% | 87%/71% |
| T2-hypointense tumors | 68%/72% | 80%/80% |
Table 6: Statistics of reader-reliability and diagnostic performance based on reader’s experiences of less than 10 years (4) and more than 10 years (4).
Diagnostic performance
AUC (Area Under the Curve) was 0.89 (0.82, 0.95) for adipocytic masses, 0.82 (0.72, 0.92) for T2-hyperintense masses and 0.79 (0.67, 0.91) for T2-hypointense masses (Figure 17). Using ST-RADS ≥ 4 as a threshold for malignancy, the sensitivity and specificity of the system for detection of malignancy in adipocytic masses were 96% and 63%, T2-hyperintense masses were 93%, 71%, and T2-hypointense masses were 64% and 84%, respectively.
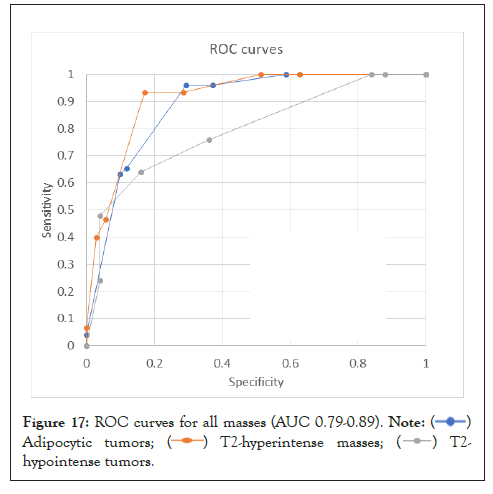
Figure 17: ROC curves for all masses (AUC 0.79-0.89). 


 .
.
After the initial success of BI-RADS, which was first introduced in 1993, followed several reporting and data systems, e.g. for liver, brain, and thyroid tumors, all with a common goal of addressing the lack of uniformity in reporting imaging findings [52]. So far, there are nine established RADS and several new in different stages of development [53], including CO-RADS, to assess the probability of pulmonary involvement with the Covid 19 virus [54]. For soft tissue tumors, the development of a standardized guideline can serve as a useful template for a radiologist for MR interpretation and future management of such patients. According to Datir, et al. large tumors (>5 cm) that are deeply seated indicate a higher malignancy risk and should be biopsied [55]. A tumor classification on MR imaging merely by location and size is certainly not enough and results in much ambiguity in reporting soft tissue tumors. Thus, this study was performed to validate and fulfill the need for a standardized guideline to facilitate soft tissue tumor categorization, thereby allowing specific management recommendations. The tumors used for this system included both common and uncommon histologies encountered in daily practice. In addition, unknown imaging cases were used from three tertiary care centers to minimize confirmation bias and memory effects.
The ST-RADS creation followed the methodology of the prototype “BI-RADS” [14] by using an expert consensus to develop the system followed by a validation step. The system showed good AUC (Area Under the Curve) for both adipocytic (0.89) and T2-hyperintense and T2-hypointense lesions (0.82, 0.79). The final score for each set of tumors was also reproducible by readers of different experience levels. The accuracy of malignancy detection in soft tissue tumors by MRI has been reported to range from 44-85%, and the results can be variable due to differences in reader experience and complexity of cases [56-59]. In this large multicenter prospective study evaluating 548 untreated and proven soft tissues masses, a consensus MRI interpretation by two radiologists based on qualitative features yielded an overall accuracy of 85%, sensitivity of 93%, and specificity of 82% for the categorization of soft tissue masses as benign or malignant. Another study by Emery, et al. evaluated 225 cases of soft tissue tumors and showed an accuracy of 44% with a sensitivity of 78% and 89% specificity in differentiating benign from malignant tumors on MRI [60]. ST-RADS showed good ROC in our study validating the classification system. The overall sensitivity for detecting malignancy using the ST-RADS scoring system for adipocytic and T2-hyperintense masses is higher when compared to the sensitivity of the BI-RADSs system (87.2%). However, The BI-RADS scoring system specificity (90.1%) outperforms the ST-RADS system [61]. The ROC curve and AUC (Area Under the Curve) currently are the current standard assessment of any given diagnostic test's accuracy. The closer the value to 1, the more accurate the test is, with the best results above 0.9. The AUC (Area Under the Curve) in BI-RADS is 0.93, only slightly higher than this study's results for adipocytic tumors and like T2-hyperintense masses. This implies that both systems have a comparable moderate to high degree of accuracy in detecting malignancy. It should also be noted that compared to tumors of the breast and prostate, soft tissue tumors however represent a much larger group with multiple benign, intermediate, and malignant entities (WHO), and the individual treatment strategies show a higher variability for benign as well as malignant tumors.
There was a good inter-reader agreement for both categories of tumors. The ICCs were even better for adipocytic tumors, possibly due to the wide variety of histologies among T2-hyperintense and T-hypointense lesions. The average ICC amongst adipocytic and T2-hyperintense tumor types was ~0.7 (good) among 8 MSK trained radiologist, similar to Cietto, et al. who reported average intrareader kappa of 0.71 based on 12 radiologists interpreting mammograms following the BI-RADS scoring system [62,63]. It was fair for T2-hypointense lesions. To the best of our knowledge, inter-reader agreement for differentiating benign and malignant soft tissue masses on MRI has not been reported before and larger available studies in this domain only used consensus opinion to determine the diagnostic accuracy. We used DWI as a supplementary tool in this study, as it is not routinely used in all practice settings. DWI might improve the ICCs for T2-hyperintense tumors if used uniformly in all cases [18,21]. ST-RADS are designed to be a dynamic or living document that will continue to be refined based on wider user experience with DWI and feedback.
We found that the categorization of soft tissues utilizing the ST-RADS was an effective way to describe imaging findings and characterize lesions. Like other RADS, the proposed reporting structure provides defined categories based on the probability of malignancy for final assessment and suggestions for further management. This will allow the reader to apply consistent terminology and reduce imaging interpretation variability and errors. The standardized reporting terminology can facilitate better communication and reduce confusion among physicians and patients.
Another important strength was that this study was a tertiary multicenter collaborative study involving eight radiologists with different experience levels in tumor imaging interpretation, ranging between 2 years to >30 years attending level expertise. None of the radiologists had previously seen the cases presented to them, and the pathologic diagnosis was not known to them at the time of interpretation. We believe having tested this system with readers of different experience levels; it will be applicable to both general radiologists and experienced oncoradiologists. The younger reader performed better, and it might be the case that they were more diligent and cautious in evaluations, however all readers were fellowship trained musculoskeletal radiologists who routinely conduct tumor boards.
The categorical reporting system would be advantageous in the management of indeterminate soft tissue lesions by providing clear guidelines for further management. It can help determine which lesion needs an invasive procedure, such as a biopsy or surgery, thereby saving time and effort by avoiding unnecessary procedures. In addition, this system will also facilitate data collection and provide new opportunities for education, quality assurance, peer review, and research.
This study has some limitations. The cases were presented by PowerPoint presentations among institutions. While this allowed for easy anonymization and data sharing, real-time windowing and image scrolling were not available, which may have limited detailed evaluation. However, it was ensured that representative sections, margins, and extents of tumors were included in the imaging presentation. Ideally, this system should be tested and re-tested prospectively before its widespread use. This system, however, followed the processes used during the validation of other existent guidelines, such as BI-RADS and LI-RADS. It is hoped that more widespread use of ST-RADS will lead to further validation, refinement, and acceptance. Furthermore, future works will include incorporating advanced imaging sequences, including DWI, dynamic contrast imaging, etc., as has been done for prostate cancer guideline (PI-RADS system).
The ST-RADS lexicon using standardized terminology helps stratify musculoskeletal soft tissue tumors into benign and malignant categories and provides an MRI-based guideline for their management. This study is also the largest for revealing the inter-reader agreement in the domain of soft tissue sarcoma and for different categories of soft tissue tumors. The ST-RADS guideline is meant to be a dynamic document that can be further refined by larger society participations and updated in response to future user feedback and as new scientific data becomes available. It is hoped that more widespread use of ST-RADS will lead to further validation, refinement, and acceptance.
Citation: Chhabra A , Ashikyan O, Ratakonda R, Bajaj G, Thakur U, Pezeshk P, et al. (2022) Soft-Tissue Tumor Reporting and Data System (ST-RADS): MRI Reporting Guideline with Multi-Institutional Validation Study of Musculoskeletal Extremity Tumors. J Tumor Res. 8:179.
Received: 25-Nov-2022, Manuscript No. JTDR-22-20437; Editor assigned: 29-Nov-2022, Pre QC No. JTDR-22-20437 (PQ); Reviewed: 13-Dec-2022, QC No. JTDR-22-20437; Revised: 20-Dec-2022, Manuscript No. JTDR-22-20437 (R); Published: 27-Dec-2022 , DOI: 10.35248/2684-1258.22.8.179
Copyright: © 2022 Chhabra A, et al. This is an open-access article distributed under the terms of the Creative Commons Attribution License, which permits unrestricted use, distribution, and reproduction in any medium, provided the original author and source are credited.