Journal of Geography & Natural Disasters
Open Access
ISSN: 2167-0587
ISSN: 2167-0587
Research Article - (2024)Volume 14, Issue 2
Differential Interferometric Synthetic Aperture Radar (DInSAR) observations conducted in this study have provided crucial insights into the earthquake-induced deformation patterns. The analysis indicates that the majority of deformation is concentrated in the zone between the NE-SW (North East-South West) trending Samwal Fault and the NW-SE trending Jhelum Fault. This concentration of deformation aligns with the known tectonic features of the region. Furthermore, the phase profile obtained from DInSAR data reveals specific details about the nature of ground displacement. South of the East-West trending Samwal Fault, an upliftment of 0.27 meters is observed. In contrast, on the Northern side in the Line Of Sight (LOS) direction, there is evidence of subsidence, with a downward displacement of 0.16 meters. These findings underscore the localized nature of the earthquake-induced deformation and highlight the significance of the underlying fault systems in governing the observed ground movements. In summary, the 2019 Kashmir earthquake stands out for the severity of building damage relative to its magnitude. The study's findings emphasize the importance of considering local geological and tectonic factors in assessing seismic hazards. The complex tectonic setup, influenced by major faults like Samwal and Jhelum, contributes to the region's heightened seismic activity. The detailed insights gained from DInSAR observations aid in unraveling the intricacies of ground deformation patterns, enhancing our understanding of earthquake dynamics in the Himalayan Belt and informing future seismic risk mitigation strategies. The 2019 Mw 5.6 Kashmir earthquake, despite its relatively moderate magnitude, had a pronounced impact on the foothill regions of the Himalaya, resulting in substantial damage to buildings. This phenomenon has intrigued researchers due to the seemingly disproportionate intensity of damage compared to the earthquake's magnitude. A comprehensive analysis suggests that the variance in damage intensity is attributed to several factors, including differences in sediment load, underlying geological structures, and the ongoing tectonic activity in the region. The area's tectonic setting is complex, contributing to its classification as one of the seismically active regions within the expansive Himalayan Belt. Two major faults, namely the Samwal Fault and Jhelum Fault, play a pivotal role in shaping the tectonic landscape of the area. The interplay of tectonic forces along these faults has modified the geological features, creating a dynamic environment prone to seismic activity.
Differential interferometry; Mirpur earthquake; Crustal deformation; Western himalaya
The continuous collision accumulates pressure and gives rise to major seismic events in and around ~2500 km stretch of Himalayan Belt. Historical seismic events are not documented properly before 1800 year which does not give adequate information regarding events. In order to accommodate the crustal movement (horizontal and vertical), major thrusts/faults are generated with the southward movement after collision at the boundary with dip towards north. Later on instrumental records provide evidence of major devastating earthquakes in Himalayan region namely; 1833 Nepal (Ms 7.7), 1905 Kangra (Mw 7.8), 1934 Bihar- Nepal (Mw 8), 1991 Uttarkashi (Mw 6.6), 1999 Chamoli (Mw 6.8), 2005 and 2013 Kashmir (Mw 7.6) and 2015 Nepal (Mw 7.8) [1,2]. These seismic events unlocked MHT which is considered as a source for many earthquakes and accommodate maximum strain during inter seismic period [3]. Some regional transverse faults played important roles in the Himalayan geodynamics. These regional faults cut across the major thrust systems. They include Karakoram Fault, Kishtwar Fault, Mansa Devi Fault, Kala Amb Tear Fault, Ganga and Yamuna Tear Faults, Judi Fault and Bari Gad Fault [4-10]. Space-time distribution of earthquakes along the Himalayan plate boundary has been investigated with an aim to discerning fluctuations in seismicity rates associated with great earthquakes, the possibilities of epicenter migration and identification of the gaps in seismic activity [11].
Western Himalaya is identified to be one of the most seismically active region in Himalaya. The western syntaxis makes highly complex tectonic structures with major thrust viz. Salt Range Thrust (SRT), Panjal Thrust (PT) and Main Boundary Thrust (MBT) and faults viz. Jhelum Fault (JF) and Kalabagh Fault (KF) with major structures, Hazara Kashmir Syntaxis (HKS), Northern Fold and Thrust Belt (NFTB) and Southern Fold and Thrust Belt (SFTB) [12]. Active faults in the Himalayas are significant in the study of active tectonics because displacements along them reflect the continued tectonic movements. Active faults and seismic hazard evaluation in the tectonically active outer Himalaya are crucial because of the increasing urbanization and population growth in the foothills and in the adjacent plains [11].
In 24th September 2019, an 5.6 Mw earthquake with epicenter near Mirpur, Kashmir causing a severe damage to the infrastructure. The shock affected around ~100 km radius with damage noticed in area of ~700 km. The earthquake also triggered landslide and soil liquefaction in some areas. Therefore investigating the deformation caused due to earthquake as well as driving force behind is necessary. For regional study, interferometric SAR is a promising technique for the deformation analysis since last few decades.
Spaceborne geodetic technique such as Differential Interferometric SAR (DInSAR) provides information on crustal shortening and slow surface deformation related to Himalayan geodynamics. Inter-seismic crustal deformation may be expressed through creep along active faults, crustal shortening and related horizontal and vertical deformations. DInSAR technique has been successfully used for co-seismic crustal deformation studies [13-18]. Recently, wide swath DInSAR using ScanSAR and TOPSAR mode data has been successfully used for studying large scale co-seismic crustal deformation [19-22].
The study of deformation in the challenging Himalayan terrain requires a meticulous approach to selecting Synthetic Aperture Radar (SAR) data and implementing appropriate processing steps. As highlighted by Hanssen, this selection is crucial and depends on the spatial and temporal distribution of available data from a specific sensor [23]. The feasibility of Differential Interferometric Synthetic Aperture Radar (DInSAR) hinges on factors such as the temporal and perpendicular baseline between two SAR images. The perpendicular baseline is sensitive to topographic conditions, decorrelation resulting from phase jumps, and the effectiveness of phase unwrapping. The normal baseline is equally important for interferogram generation, as beyond a certain value, phase information is lost along with coherence. The ambiguity height, a parameter sensitive to detecting elevation change, is proportional to 2π ambiguity height. As the baseline increases, the ambiguity height decreases, leading to an increase in the topographic sensitivity of the interferogram. Conversely, topographic effects can be ignored for image pairs with ambiguity height values much higher than the vertical accuracy of the Digital Elevation Model (DEM). However, for estimating surface displacement, a small perpendicular baseline is preferable [11,24].
Coherence, a key parameter, provides valuable information about interferogram quality. It enables the detection and extraction of useful features for detailed analysis. Coherence determines the quality of the measurement of interferometric phase between two SAR images and helps extract thematic information relevant to ground features, considering temporal decorrelation [25].
Temporal decorrelation can lead to disturbed interferometric fringe patterns and disrupt phase unwrapping due to phase residues. Therefore, decorrelation in the interferogram significantly affects the accuracy of InSAR [15].
To mitigate the impact of decorrelation, different phase filtering techniques are applied, aiming to maintain the interferogram with minimal residues [26]. Bhattacharya et al. have discussed the effectiveness of adaptive filtering in the Himalayan region [27]. Adaptive filtering is particularly useful in reducing phase noise due to decorrelation, thereby improving the accuracy of phase unwrapping for DEM generation.
The deformation obtained from the unwrapped phase plays the important role to calculate the absolute displacement value and sensitive to the phase noise. Temporal, thermal and spatial decorrelation in phase signal incorporate the phase noise [25]. Spatial decorrelation (baseline or geometry) should be zero between master and slave images which is not possible, hence small baseline is preferred. The scattering property in the area also depends upon the weather and other factors, which changes with time and space.
In this study, we have analyzed the deformation due to earthquake using DInSAR technique. Both ascending and descending pass interferometry helped us to track the deformation from both angles lowering the effect of error. With such information, the study can be helpful in identifying the fault responsible for earthquake.
Study area
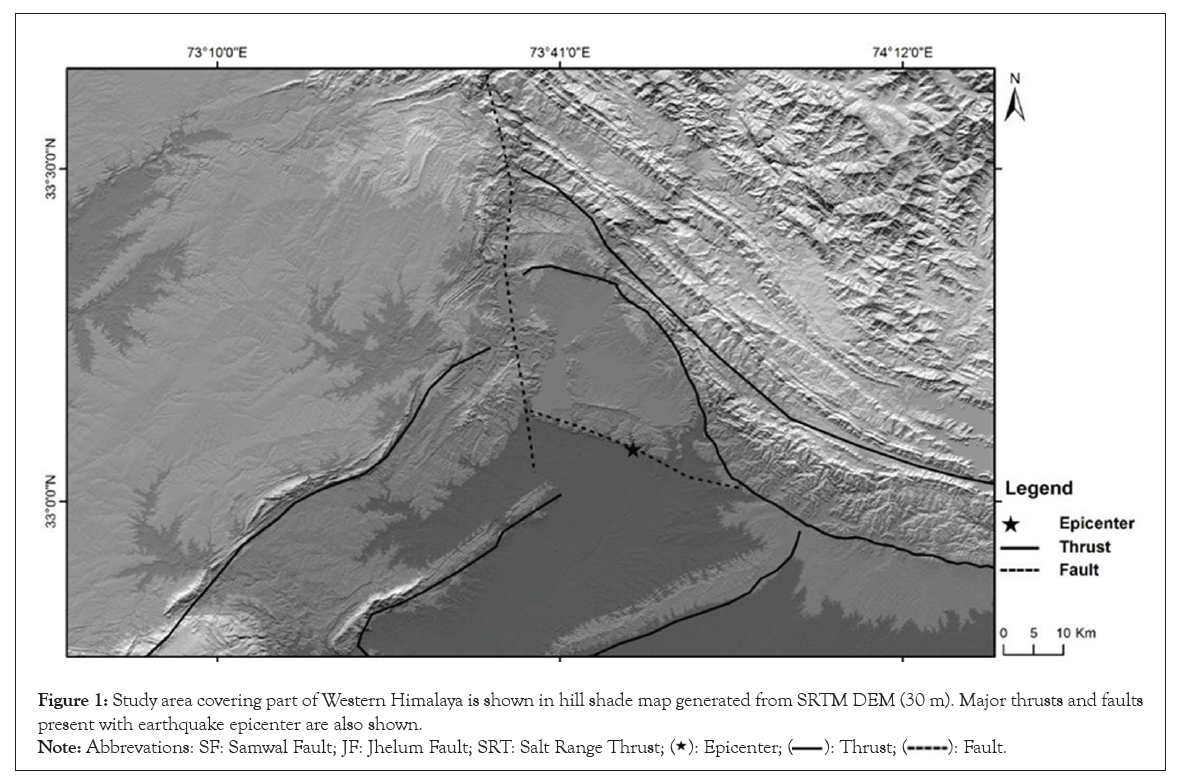
The study area covers a complex Himalayan tectonic zone of active deformation showing evidences of active fault and associated uplift in piedmont-alluvial region as shown in Figure 1. The stratigraphic units present in the study includes the Late Miocene Nagri Formation, Late Miocene Dhok Pathan Formation, Pliocene Soan Formation, Pleistocene Mirpur Formation and recent alluvium in chronological sequence. The Nagri Formation consists of sandstones, which are massive, medium to coarse-grained and are greenish grey to light grey in colour.

Figure 1: Study area covering part of Western Himalaya is shown in hill shade map generated from SRTM DEM (30 m). Major thrusts and faults
present with earthquake epicenter are also shown.

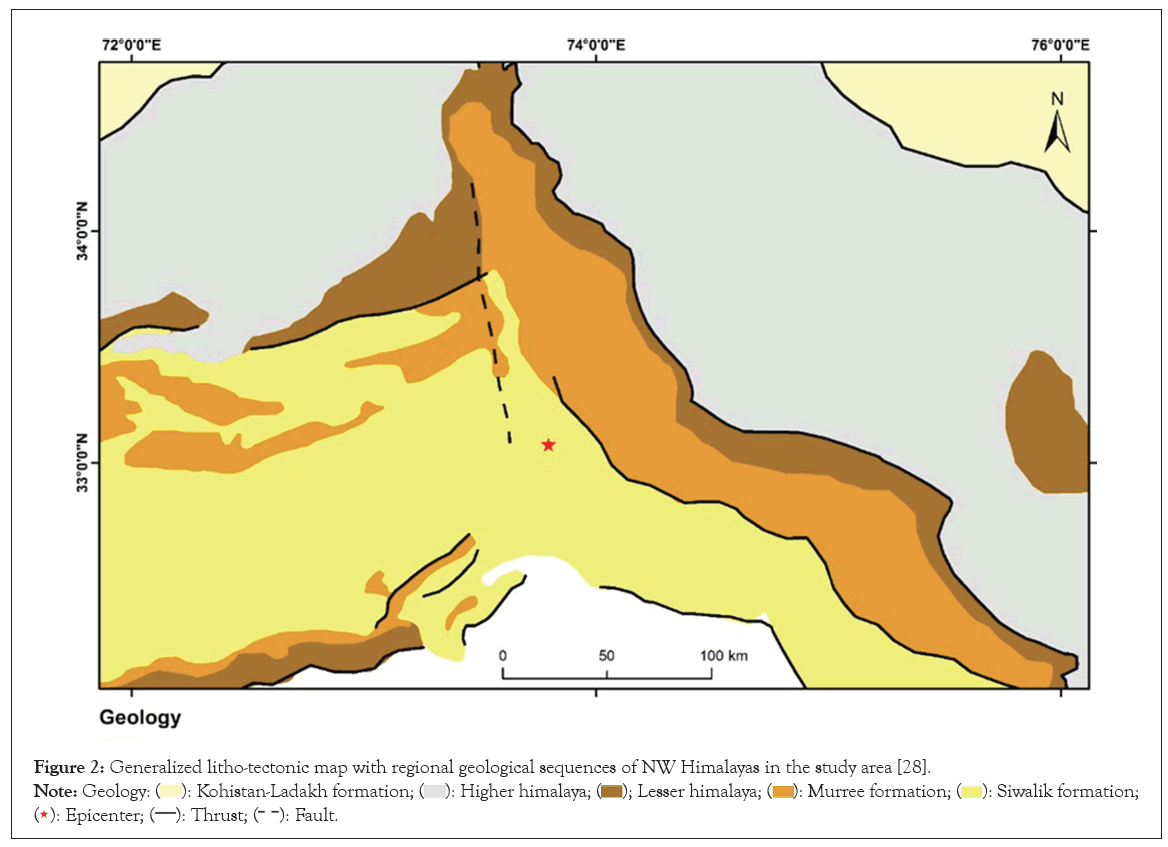
The Dhok Pathan formation includes the sandstone and clay beds deposited alternately. The sandstones are fine to medium grained, and are of grey, light gray, reddish brown and gleaming white in colour with alterartion of dull red and orange brown silty clay. The Pliocene Soan Formation is characterized by bentonite clays and conglomerates. Conglomerates of Soan Formation consist of fragments of cherty dolomite, granite gneisses, Panjal volcanics, quartzite and compact arenaceous matrix. Poorly sorted conglomerates comprising of pebbles, cobbles of igneous, metamorphic, sedimentary rocks and clay matrix, represent the Pleistocene Mirpur Formation. Lastly, we have alluvium on top, the youngest deposition that includes unconsolidated clay, silt and gravel as shown in Figure 2 [29].

Figure 2: Generalized litho-tectonic map with regional geological sequences of NW Himalayas in the study area [28].


The current earthquake is believed to be caused by the Samwal Fault. It is a NW-SE trending, high angle dip-slip fault ranging from 45° to 85° NE, which is situated around 5 km south of the Mirpur city and can be identified by a sudden topographic break. At places the Samwal fault emplace the Dhok Pathan Formation over the lower part of Soan Formation. The Samwal fault is situated adjacent to the fold axis of Hazara Kashmir Syntaxis (HKS) and is 20 km in length. It starts from Jari Kass in the east and ends at Mangla Colony in the west. The rocks at the eastern end of the Samwal Fault formed an overturned syncline with the hanging wall consisting of upper part of Soan Formation whereas the rocks at western end were dipping normally in the NE direction. Near the Samwal village a major fault trace was exposed which lies on the faulted contact between the Soan and Dhok Pathan Fomations.
The frontal zone of the Himalaya is most active at present. Active faults are common features in the frontal zone. Active faulting has been taking place along the Main Boundary Fault (MBF) and their associated faults. These active faults generally form a North-dipping imbricated thrust zone. Under the present stress field, the mode of active faulting is closely related to fault strike. Displacement along these active faults is generally up to the north, indicating late Quaternary uplift of the range along the Himalayan Front [11].
We used Sentinel 1A data to study how the ground changed after the earthquake as shown in Figure 1. We selected two pairs of images that were taken before and after the earthquake from different angles: One from an ascending track with a normal baseline of 40 m (16.09.2019-28.09.2019) and one from a descending track with a perpendicular baseline of 154 m (17.09.2019-29.09.2019). We applied a two pass interferometry method to create deformation maps using SNAP Software. We also used an external DEM (SRTM 30 m) to correct for the topographic effects and subtracted it from the interferogram. We filtered the interferogram with Goldstein filter to reduce noise and generated a coherence image. Coherence is important for extracting phase information from the interferogram, but it can be affected by temporal and spatial baselines. The differential interferogram after removing the topographic effects still has wrapped phase values between 0-2π, which causes ambiguity in each pixel. We used SNAPHU software to unwrap the phase values and resolve the ambiguity [15,30,31]. Finally, we geocoded the deformation map.
Himalaya being highly undulating, the topographic error is added to the unwrapped phase value. Topographic (DEM) error was calculated from SRTM 30 m DEM as ± 10 m and these corrections has been applied to the unwrapped phase value. The topographic error is more significant in steep slope areas particularly at the fault scarps due to the difficulty in phase unwrapping of InSAR based SRTM DEM. Phase profile taken on the corrected phase data with moderate to high coherence pixel considering less rugged terrain with lesser spatial decorrelation and lesser temporal decorrelation [11].
The phase value in SAR interferograms are mainly combination of a number of error components such as tropospheric path delay, topographic component and orbital uncertainties. Tropospheric artifact is due to the change in refractive index of the medium caused by atmospheric pressure, temperature and water vapour. The variation in temperature and pressure does not play enough role for any strong and localized phase gradient in interferograms showing small magnitude and evenly distributed throughout the interferogram comparative to water vapour and sometimes coincide with orbital uncertainties [32,33]. Topographic error can be compensated using a reference elevation model where the surface deformation is known or insignificant. In order to suppress noise, Multilooking and careful interferometric processing is required. After considering above factors, the end product of interferogram contains only atmospheric signature which can be removed using various atmospheric products [11].
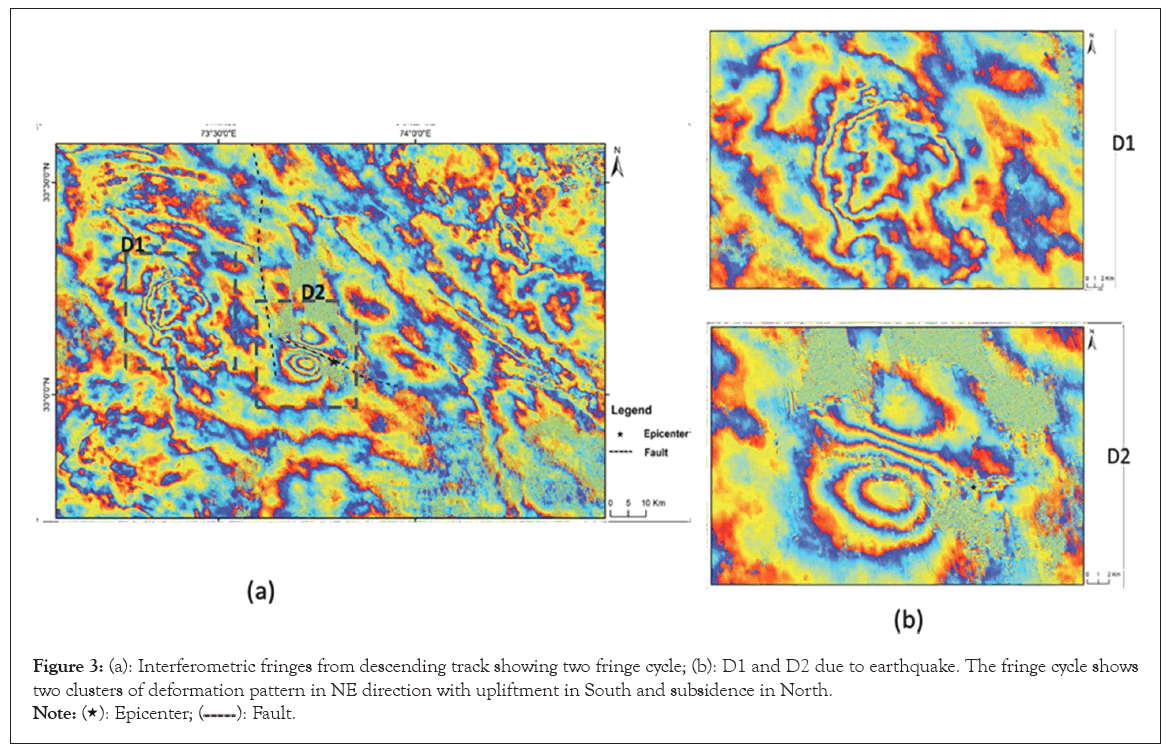
DInSAR observations suggested that most deformation was concentrated in two areas such as western side of Jhelum Fault (D1) and South of Mangla Reservoir of Mirpur city near Samwal Fault (D2) as shown in Figures 3a and 3b. Both the ground deformations are indicative of sift sediment deformation present south of thrust belt. From the fringe pattern, it can be inferred that the density of damage is maximum towards the proximity of epicenter followed by the distant areas. Deformation location D1, shows a LOS displacement range of 0.27 to -0.16 m with phase value of -3.14 to +3.14. Similarly, D2 shows maximum ground deformation with proximity to epicenter around EW trending Samwal fault near Jhelum River. The northern zone was close to Mangla dam whereas the other one was at southern side of the river where it takes a rectangular turn in river channel indicating ongoing tectonic activity in the area. The fringes in the southern side of the fault shows more deformation in soft sediments compared to Siwalik ranges. The Samwal Fault is identified to be the main cause of Mirpur earthquake. From the deformation pattern, it can be observed that deformation is restricted to Jhelum Fault and Samwal Fault in south and north respectively [11].

Figure 3: (a): Interferometric fringes from descending track showing two fringe cycle; (b): D1 and D2 due to earthquake. The fringe cycle shows
two clusters of deformation pattern in NE direction with upliftment in South and subsidence in North.

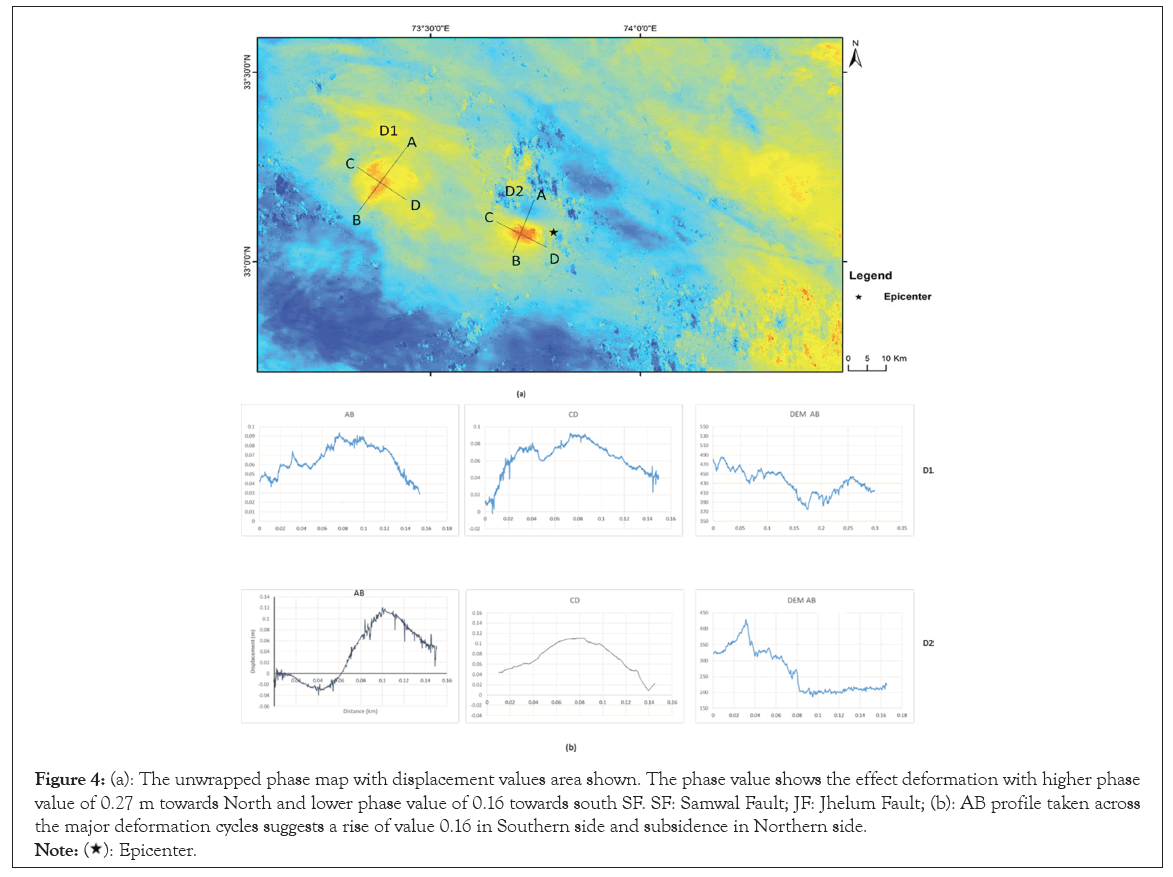
The difference in damage in area is subjected to the difference in sediment cover which is much thicker in and around banks of Jhelum River. The fringe pattern showed both upliftment and subsidence in phase value indicating difference in scale of deformation in the study area. The Northern cycle of fringes showed lower phase value in comparison to Southern cycle phase value. These values clearly indicates subsidence in the northern cycle and upliftment in southern. The unwrapped phase showed upliftment and subsidence with value ranging from -3.14 to +3.14 as shown in Figure 4a. We analyzed the phase profile in order to illustrate the deformation pattern in the area. AB profile as shown in Figure 4b taken across the unwrapped phase image showed two sites of maximum deformation. The profile indicates upliftment of 0.27 m in southern bank of Jhelum River whereas subsidence of 0.16 m near northern side on LOS direction. The signal in NW part of the area was lost because of low coherence due to presence of water reservoir.

Figure 4: (a): The unwrapped phase map with displacement values area shown. The phase value shows the effect deformation with higher phase
value of 0.27 m towards North and lower phase value of 0.16 towards south SF. SF: Samwal Fault; JF: Jhelum Fault; (b): AB profile taken across
the major deformation cycles suggests a rise of value 0.16 in Southern side and subsidence in Northern side.

Both ascending and descending tracks helped to model deformation in both directions. The interferogram from descending track images showed significant displacement fringes compared to ascending track images. From the deformation fringes, two major displacement sites can be identified as shown in Figure 4a corresponding to different color cycle in the direction of line of sight of the sensor. The incidence angle of 36 degrees caused 3.14 m of total deformation in LOS direction. The ascending track data did not show better interferogram compared to descending mode as shown in Figure 4b.
This can be due to difference in look angle during the event. Therefore, it can be suggested both the tracks can be comparable in case of low to medium magnitude earthquakes as they can provide data in both directions of ground deformation. Complex tectonic setup makes the area seismically active falling under Riasi Seismic Zone. Being close to syntaxial bend, the area is modified by Jhelum Fault and Samwal Fault. Both the fault systems modify the area by the relative movements of both faults. Therefore, the study area receives maximum damage due to difference in sediment load as well as the tectonic processes undergoing from both sides. Samwal Fault and Dil Jabba Thrust, passed by Mirpur area, show significant role in seismic activity in the area [34]. Most of the medium magnitude earthquakes (>5) have generated within the depth of 30 km under the crust. This earthquake is believed to be generated at a shallow depth causing severe damage.
In the present study, we attempted to estimate the deformation due to 2019 Mirpur earthquake which is a seismically active region of the Himalaya. Differential Interferometric SAR technique was implemented to determine the deformation amount. The result shows the Samwal Fault and Jhelum Fault plays an important role in deformation pattern due to the earthquake. The fringe pattern shows two major deformation zones i.e., one in the area with Samwal Fault as a boundary between two fringe cycles (D2) and D1 in the western side of NW-SE Jhelum fault. The phase profile indicates upliftment of 0.27 m in south of EW Samwal Fault near Jhelum River whereas subsidence of 0.16 m near northern side on LOS direction. The signal in NW part of the area was lost because of low coherence due to presence of water reservoir. The low displacement value indicating the difference in tectonic activity between Samwal Fault and Jhelum Fault present in the area. Therefore, more detailed observation is required to study the long term effects of this surface deformation and the behavior of fault systems present in the area.
The authors acknowledge the RSS Cloud Toolbox service of ESA for data processing.
The study was funded by Indian Space Research Organization (ISRO) under the Earth Observation Application Mission (EOAM) project scheme.
The authors declare that they have no known competing financial interests or personal relationships that could have appeared to influence the work reported in this paper.
Somalin Nath (corresponding Author) has written the manuscript and analysed the DInSAR data. Ashutosh Venkatesh Prasad has processed the data.
Citation: Nath S, Prasad AV (2024) Space Geodesy for Deformation Analysis of 2019 Mirpur Earthquake, Western Himalaya. J Geogr Nat Disasters. 14:306.
Received: 12-Mar-2024, Manuscript No. JGND-24-30106; Editor assigned: 15-Mar-2024, Pre QC No. JGND-24-30106 (PQ); Reviewed: 01-Apr-2024, QC No. JGND-24-30106; Revised: 08-Apr-2024, Manuscript No. JGND-24-30106 (R); Published: 15-Apr-2024 , DOI: 10.35841/2167-0587.24.14.306
Copyright: © 2024 Nath S, et al. This is an open-access article distributed under the terms of the Creative Commons Attribution License, which permits unrestricted use, distribution, and reproduction in any medium, provided the original author and source are credited.