International Journal of Advancements in Technology
Open Access
ISSN: 0976-4860
![]() +44 1478 350008
+44 1478 350008
ISSN: 0976-4860
![]() +44 1478 350008
+44 1478 350008
Research Article - (2017) Volume 8, Issue 2
In general, Population and other forms of data for different states and times in India are taken from census data which will be taken for every 10 years. This data may have spatial autocorrelation which is characterized by a correlation in a signal among nearby locations in space. Spatial autocorrelation is more complex than onedimensional autocorrelation because spatial correlation is multi-dimensional and multi-directional. Thus in this work a model is being used to study population data for its spatial and temporal characteristics. Before the model being considered, the data will be initially studied for its relevance in spatial analysis problem. Once the problem is satisfied for its spatial autocorrelation characteristics, the model is used to generate coefficients from available census data, which will be used to generate data within 10 years span and for future predictions.
<Keywords: Simulation and modeling, Spatial and temporal data, Spatial regression analysis, Census data
The Indian Census is the most credible source of information on Demography (Population characteristics), Economic Activity, Literacy and Education, Housing and Household Amenities, Urbanization, Fertility and Mortality, Scheduled Castes and Scheduled Tribes, Language, Religion, Migration, Disability and many other sociocultural and demographic data since 1872. Census 2011 will be the 15th National Census of the Country. It comprises the only source of primary data in the village, town and ward level, It is the source of information for planning and policy decisions for Central and the State Governments and is widely used by National and International Agencies, Scholars, business people, industrialists, and many more.
The Delimitation/reservation of Constituencies- Parliamentary/ Assembly/Panchayats and other Local Bodies is also done on the basis of the demographic data thrown up by the Census. Census is the basis for reviewing the country's progress in the past decade, monitoring the ongoing Schemes of the Government and most importantly, plan for the future.
But the limitation with this data is, it is generated for a 10 years span and thus the data obtained is intermittent in nature rather than continues.
Thus a temporal data mining is adopted on this data to generate data in a continues way where temporal data mining extracts useful and non-generated data from large quantities of data which has time based relationship. Spatial analysis also being applied which involves the study of formal techniques for subjects involving their topological properties. Some of applications of Spatial and temporal analysis are astronomy based, complex algorithms and meteorological applications, population studies and so on. This study involves complex issues as most of the parameters involved are neither completely defined nor completely resolved.
Carroll MW et al. [1] explored the spatial and temporal techniques being used in outbreak of Ebola Virus in West Africa. Lee MM et al. [2] studied air polluted data by using self-organizing maps. In this work Boots B [3] used the spatial analysis in geographical prioritization of social network messages in real time applications like floods. In their work Krishna AVN [4] the importance of spatial analysis in applications like traffic analysis, household data and so on. The articles [5] deals with relevance of Moran’s I in spatial analysis problems like transportation, planning and technology, the relevance of local measures in spatial problems and in geographical applications. In the work on Back ground paper on Demographic Projections, the census data has been presented which gives Demography (Population characteristics), Economic Activity, Literacy and Education, Housing and Household Amenities, Urbanization, Fertility and Mortality, Scheduled Castes and Scheduled Tribes, Language, Religion, Migration, Disability and many other sociocultural and demographic related information which can be processed for planning better societal needs. Census India document specifies the importance of census data for the purpose of planning, development and improvement of the residents' quality of life [6-12].
Interdisciplinary relevance
The work mainly deals with Spatial and Temporal Data Mining techniques, Numerical techniques, Statistical analysis and Social Sciences. The work also involves error analysis to identify the variations in obtained data and generated data.
Tools that may be used for data analysis: Data Analytics using MATLAB, R or SPSS may well be used for proper validation of data.
Scope and significance of the work
This area of presentation involves both environment and interactive effects. The problem supports data driven and model driven concepts. Data driven methods gives insight into obtaining the data, identifying its characteristics and finalize in obtaining analytical results. Model driven methods will help in analyzing and modeling a problem, identifies its characteristics and help to develop patterns which forms the base for both data interpolation and its extrapolation values.
Thus every country needs basic information on its residents for purposes of planning, development and improvement of the residents' quality of life. Good planning is based on reliable, up-to-date, accurate and detailed information on the state of the society in the country. This information makes it possible to plan better services, improve the quality of life and solve existing problems. Statistical information, which serves as the basis for constructing planning forecasts, is essential for the democratic process since it enables the citizens to examine the decisions made by the government and local authorities, and decide whether they serve the public they are meant to help. For these reasons official statistics are collected and published in all countries, worldwide. Thus, for example, while planning a road system, the planners use information regarding the quantity of people and number of vehicles who are likely to use the road; for if not, the advantages of constructing the road may not justify its cost. Similarly, when planning a school system, there is a need for a forecast of the number of pupils who are likely to need schools, in order to ensure that they will be built in locations with an appropriate number of pupils.
Problem statement
Regression Analysis models form the relationships between one or more response variables and predictors. If there is more than one response variable, it is called as multivariate regression. In general, Population and other forms of data for different states and times are taken from census data which will be taken for every 10 years. In statistics, Moran's I or Geary’s index is used as measure of spatial autocorrelation. Spatial autocorrelation is characterized by a correlation in a signal among nearby locations in space. Spatial autocorrelation is more complex than one-dimensional autocorrelation because spatial correlation is multi-dimensional and multi-directional. Thus in this work a model is used for its spatial and temporal characteristics. Before the model being considered, the data will be initially studied for its relevance in spatial Analysis problem. Once the problem is satisfied for its spatial autocorrelation characteristics, the model is used to generate coefficients from available census data, which will be used to generate data with in 10 years span and for future predictions.
Research methodology
The population at different states and different times is taken as problem set. Before starting with the problem, the data is tested for its spatial auto correlation characteristics. The methods that are going to be used for testing its correlation characteristics are Moran’s I and Garey’s index which helps to generate an index which will be in the range of -1 to +1. Negative values indicate negative spatial autocorrelation and positive values indicate positive spatial autocorrelation. A zero value indicates a random spatial pattern. Based on the index value, the data set will be verified. Once the data is satisfied for its auto correlation characteristics, the proposed model will be used. In statistical modeling, regression analysis is a statistical process for estimating the relationships among variables. It includes many techniques for modeling and analyzing several variables, when the focus is on the relationship between a dependent variable and one or more independent variables. Thus in the proposed method, the data is divided into set of grid points. The grid points are solved by using spatial regression model to generate coefficients. Using these coefficients, data can be either interpolated or extrapolated depending on the requirements. It is crucial to understand that all measurements of physical quantities are subject to uncertainties. It is never possible to measure anything exactly. So measures must be taken to make errors as negligible as possible. Thus care must be taken to draw valid conclusions where the error must be indicated and dealt with properly. Thus the generated data is tested for error analysis to make it more suitable in real time environment.
Thus in the proposed work Population data analysis will be done by different models and the data will be validated. Once the data is validated, it can be used for proper predictions which in turn can be used for better Policy decisions and for betterment of Society.
Proof of concept
The work is tried for its spatial auto-correlation between North, Central and Eastern states by using Moran’s I and found that the population among these states follow spatial relationship. The population census in some states in India has been presented in Table 1. The data is used to measure the spatial analysis and its dependency among some states in India. The Table 2 refers to the adjacency matrix to identify the weights associated with the states which are being used to calculate Auto correlation of Population among different states to be used in Moran’I Model.
| States Ten Year span | 1971 × 106 | 1981 × 106 | 1991 × 106 | 2001 × 106 | 2011 × 106 |
|---|---|---|---|---|---|
| Utter Pradesh | 83 | 106 | 132 | 166 | 198 |
| Bihar | 42 | 52.43 | 64.65 | 82.99 | 103.8 |
| West Bengal | 44 | 54.54 | 68.03 | 80.17 | 91.34 |
| Orissa | 21 | 26.48 | 31.76 | 36.8 | 41.95 |
| Madhya Pradesh | 30 | 38.14 | 48.53 | 60.34 | 72.59 |
Table 1: Population census in some states in India.
| States | UtterPradesh | Bihar | WestBengal | Orissa | MadhyaPradesh |
|---|---|---|---|---|---|
| UtterPradesh | 1 | 1 | 0 | 0 | 1 |
| Bihar | 1 | 1 | 1 | 0 | 1 |
| WestBengal | 0 | 1 | 1 | 1 | 0 |
| Orissa | 0 | 1 | 1 | 1 | 0 |
| MadhyaPradesh | 1 | 1 | 0 | 1 | 1 |
Table 2: Adjacency matrix for the considered states.
Moran’s I: Calculations for Moran’s I are based on a weighted matrix, with units i and j. Similarities between units is calculated as the product of the differences between yi and yj with the overall mean.

The Moran’s statistic is calculated using the basic form, which is divided by the sample variance: 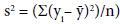

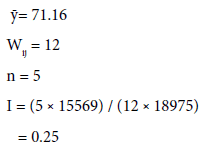
Which says that the population data in Case study 1: i.e., Northern- Central-Eastern India by both the models is correlated, similar, regionalize, smooth and clustered.
Linear regression model
P(x) = a0 × x +a1
The work will be extended by considering a Multi-Variate regression analysis model. Different parameters will be identified which influence the population of a specific state.
By considering the state like Utter Pradesh, for a 3 degree polynomial, the extrapolated result can be obtained by considering the polynomial.
Multi variate regression model
P(x) = a0 × x 3 +a1 × x 2 + a2 × x +a3
Population Census estimates by Linear and Multi Variate Regression Models in Some States in India has been calculated and presented in Table 3.
| StatesTen Year span | 2001 × 106 | 2011 × 106 | 2021 × 106 (LR) | 2021 × 106 (MVR) |
|---|---|---|---|---|
| UtterPradesh | 166 | 198 | 225.6 | 228 |
| Bihar | 82.99 | 103.8 | 116 | 128.6 |
| WestBengal | 80.17 | 91.34 | 103.3 | 101 |
| Orissa | 36.8 | 41.95 | 47.5 | 46.8 |
| MadhyaPradesh | 60.34 | 72.59 | 82.4 | 87.3 |
Table 3: Population census estimates by linear and multi variate regression models in some states in India by 2021.
For the year 2021, the population predicted for Utter Pradesh is 228 and in 2031 it is 238, which give a better predicted value when compared to a linear regression model.
Spatial analysis model
Y = ρy+βx+€(error),
ρy gives the difference in Data Values of the respective neighboring states over different years of time span.
βx refers to calculating the coefficients of difference values by regression model.
The Lagrange interpolating polynomial is the polynomial p(x) of degree ≤ (n-1) that passes through the n points (x1,y1 = f(x1)) , (x2,y2 = f (x2)),......, (xn,yn = f(xn)), and is given by:
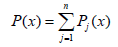 (1)
(1)
Where, 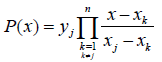 (2)
(2)
Written explicitly,
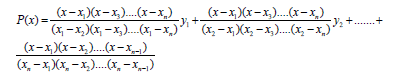 (3)
(3)
Algorithm for spatial analysis model:
1. Read the data of neighboring states in sequential order till it reaches to the boundary of the country.
2. Consider the states with respect to any one border.
3. Calculate the difference in population over two successive Border States over a span of time.
4. Calculate the missing data over the border state and its difference data over the neighboring state by any interpolation technique (say Lagrange method).
5. Estimate the missing data over the next border state by summation of values of step 4.
6. Go to step 2.
7. Repeat the process for different time spans for the identified state.
Spatial relationship of Utter Pradesh with respect to the neighboring states like Rajasthan, Madhya Pradesh and Bihar is represented in Tables 4-6 respectively.
Years |
1971 × 106 | 1981 × 106 | 1991 × 106 | 2001 × 106 | 2011 × 106 | 2021(Expected) × 106 |
|---|---|---|---|---|---|---|
| Utter Pradesh | 83 | 106 | 132 | 166 | 198 | nbsp; |
| Rajasthan | 24 | 34 | 44 | 57 | 69 | 80 |
| Difference | 59 | 72 | 88 | 109 | 129 | 149 |
| Expected estimation in UP | nbsp; | nbsp; | nbsp; | nbsp; | nbsp; | 229. |
Table 4: Spatial analysis estimates in Utter Pradesh wrt Rajasthan as border state.
| Years | 1971 × 106 | 1981 × 106 | 1991 × 106 | 2001 × 106 | 2011 × 106 | 2021(Expected) × 106 |
|---|---|---|---|---|---|---|
| Utter Pradesh | 83 | 106 | 132 | 166 | 198 | nbsp; |
| Madhya Pradesh | 30 | 38 | 49 | 60 | 73 | 86 |
| Difference | 53 | 68 | 83 | 106 | 125 | 143 |
| Expected estimation in UP | nbsp; | nbsp; | nbsp; | nbsp; | nbsp; | 229. |
Table 5: Spatial analysis estimates in Utter Pradesh wrt Madhya Pradesh as border state.
| Years | 1971 × 106 | 1981 × 106 | 1991 × 106 | 2001 × 106 | 2011 × 106 | 2021(Expected) × 106 |
|---|---|---|---|---|---|---|
| Utter Pradesh | 83 | 106 | 132 | 166 | 198 | nbsp; |
| Bihar | 42 | 52 | 65 | 83 | 104 | 125 |
| Difference | 41 | 54 | 67 | 83 | 94 | 104 |
| Expected estimation in UP | nbsp; | nbsp; | nbsp; | nbsp; | nbsp; | 229 |
Table 6: Spatial analysis estimates in Utter Pradesh wrt Bihar as border state.
In Table 7, the work is extended by considering the western border states of Utter Pradesh like Rajasthan, Gujarat and Maharashtra. Initially spatial analysis being done on Population data of Maharashtra and Gujarat, then the work is extended to population estimates of Gujarat and Rajasthan and finally the estimates of Rajasthan is used to estimate the population in Utter Pradesh in 2021.
Years |
1971 × 106 | 1981 × 106 | 1991 × 106 | 2001 × 106 | 2011 × 106 | 2021(Expected) × 106 |
|---|---|---|---|---|---|---|
| Utter Pradesh | 83 | 106 | 132 | 166 | 198 | 229 |
| Difference between UP and Rajasthan | 59 | 72 | 88 | 109 | 129 | 149 |
| Rajasthan | 24 | 34 | 44 | 57 | 69 | 80 |
| Difference between Rajasthanand Gujarat | -4 | 0 | 3 | 7 | 9 | 12 |
| Gujarat | 28 | 34 | 41 | 50 | 60 | 68 |
| Difference between Gujarat and Maharashtra | 22 | 29 | 38 | 47 | 52 | 57 |
| Maharashtra | 50 | 63 | 79 | 97 | 112 | 125 |
Table 7: Spatial analysis estimates in Utter Pradesh wrtwestern states as border states.
Result Analysis
The above results from Tables 4-7 says that the population estimates in Utter Pradesh will be around 229 millions i.e., 22.9 crores by spatial analysis model.
Applications in this Area
The data estimation helps for proper understanding the population census of a country, its residential needs and demographic, social and economic needs. Thus the generated data is utilized by Government Ministries, Local Authorities, Bodies of Research, Public and Private Companies, Journalists, Students and Public in general.
The statistics of data generated will be helpful for proper forecasts of the needs of the people. This helps for understanding the needs of the population of a country, its residential needs, demographic and socialeconomic needs of the society.
The proposed work generates coefficients which are constant in nature. The normal (or Gaussian) distribution has to be used for error analysis as it follows a very common continuous probability distribution. Normal distributions are used as the data represent realvalued random variables whose distributions are not known.
The different parameters which influence population growth like Birth rate, Death rate, migration factors, Development factors etc. may also be studied and analyzed using Multi Variate regression models.
And the work may be extended by considering a Cubic Spline curve based model which generates coefficients which are self-learning. The process will be iterative in nature and the coefficients generated will be refined based on self-learning model. The proposed models may consider future data estimates while generating coefficients which may well be used for data analysis.