Journal of Depression and Anxiety
Open Access
ISSN: 2167-1044
ISSN: 2167-1044
Research Article - (2022)Volume 11, Issue 8
Background: A growing body of evidence suggests a link between diet and depression. However, the existing research conclusions are inconsistent.
Objective: The purpose of this paper was to investigate the association between dietary macronutrient intake and depressive symptoms in middle-aged and older adults.
Methods: We collected data on the diets of middle-aged and elderly people in northern China and assessed depression status. The relationship between dietary macronutrient intake and risk of depressive symptoms was explored using Restricted Cubic Spline (RCS), and the combined effect among macronutrients was further explored using the Generalized Additive Models (GAMs).
Results: Of 3,095 study subjects, 808 (26.11%) were assessed as having depressive symptoms. An RCS analysis revealed the following: the proportion of monounsaturated fat energy supply and Polyunsaturated Fat Energy Supply (PFES-P) were negatively associated with the risk of depressive symptoms; the Proportion of Carbohydrate Energy Supply (PCES) was positively associated with the risk of depressive symptoms. As analysis of GAM found that the risk of depressive symptoms was at a lower level when the PCES was less than 50% and the PFES was more than 40%. The risk of depressive symptoms decreased as the PFES-P increased, and the risk further decreased when the PFES-P exceeded 20%.
Conclusion: A dietary pattern characterized by a high PFES (>40%), particularly a PFES-P >20% and a low PCES (<50%) is recommended as a dietary pattern for depression prevention in middle-aged and older adults.
Depression; Middle-aged and elderly; RCS; GAM; Macronutrient
Depression is one of the most common psychological disorders, characterized by a significant and persistent depressed mood as the main clinical feature, which seriously affects a person’s physical and mental health. As of 2017, 264 million people worldwide were affected by depression [1]. A 2019 cross-sectional epidemiological study on the prevalence of mental disorders in China showed that the lifetime prevalence of depression (the percentage of the population who have had depression in their lifetime) was 6.8%, and the 12-month prevalence (the percentage of the population who have had depression in the previous 12 months) was 3.6%. On this basis, it is estimated that more than 95 million Chinese people have experienced depression in their lifetime [2].
Depression has a greater impact on physical performance and cognitive function in older adults than in younger adults. Some studies have shown that depression may be the most common cause of emotional distress in later life, significantly reducing the quality of life of older adults [3-8]. Depression is also associated with increased rates of suicide and non-suicide mortality in older adults [9]. In recent years, there has been growing evidence of a link between diet and depression. Improved nutrition has a positive effect on mental health. Adherence to healthy dietary patterns such as the Mediterranean diet (a diet characterized by a high intake of fruits, vegetables, and olive oil and a low intake of animal foods) is associated with a reduced risk of depression [10,11]. In addition, a correlation between depression and the intake of different types of fats, vitamins, and micronutrients has also been reported [12-17].
However, most of the existing studies have focused only on the relationship between specific dietary patterns and depression, defining a diet as compliance with a particular dietary pattern or evaluating a diet’s dietary characteristics, while little is known about the relationship between dietary macronutrient intake and depression. For example, studies examining the association between low-carbohydrate diets and depression are often focused on evaluating low-carbohydrate diet scores rather than directly exploring the relationship between carbohydrate as a nutrient and depression outcomes [18,19]. It is not possible to determine the role of different nutrients in the diet or only focus on the role of a specific food or nutrient, such as olive oil or Poly-Unsaturated Fatty Acid (PUFA), on depression; few studies have examined the role of which food or nutrient in the diet as a whole or its interaction with other nutrients. In addition, different studies on the relationship between macronutrients and depression have presented different conclusions. Several studies have shown that PUFA can prevent and improve depression [20-22], while a prospective study found that long-chain omega-3 supplementation may have little or no effect on preventing depression [23].The aim of this study was to investigate the relationship between dietary macronutrient intake and depressive symptoms and further explore the combined effects of different nutrients—for the purposes of clarifying relatively appropriate Macronutrient Energy Supply Ratios (MESR) and thereby providing dietary recommendations for the prevention and treatment of depression in middle-aged and elderly people.
Study participants
The data in this study were obtained from the baseline survey of the Community Cohort Study of Nervous System Diseases (CCSNSD), an ongoing longitudinal study established by the project in 2018–2019, focusing on potential factors related to the risk of three neurological diseases. The ethics review committee of the National Institute of Nutrition and Health of the Chinese Center for Disease Control and Prevention has reviewed and approved this topic (No. 2017-020). Informed consent was obtained and signed by each participant prior to the survey.
A total of 6,720 respondents were included in the CCSNSD baseline survey. The following criteria determined which respondents were eligible for inclusion in this study: (a) 55 years and older; (b) resident population living in the sampled community; (c) absence of clinically diagnosed depressive symptoms; (d) ability to perform a normal depressive symptom scale assessment; (e) complete data on sociodemographic characteristics, medical history, and food frequency questionnaire. A total of 3,095 middle-aged and elderly residents were finally included as study subjects (Figure 1).
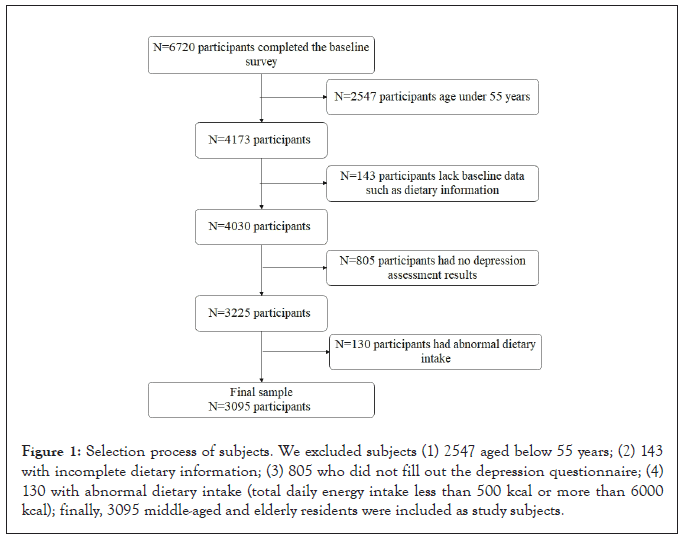
Figure 1: Selection process of subjects. We excluded subjects (1) 2547 aged below 55 years; (2) 143 with incomplete dietary information; (3) 805 who did not fill out the depression questionnaire; (4) 130 with abnormal dietary intake (total daily energy intake less than 500 kcal or more than 6000 kcal); finally, 3095 middle-aged and elderly residents were included as study subjects.
Survey method and content
A food frequency scale was used to ask the respondents about their frequency of intake regarding various types of food or beverages in the previous 12 months. The intake frequencies were classified as the following: never, <1 time/month, 1–3 times/month, 1 time/ week, 2–4 times/week, 5–6 times/week, 1 time/day, 2–3 times/day, 4–5 times/day, and ≥6 times/day. For each food type, the frequency and amount of intake were obtained from the food frequency table and converted into the daily intake of that food. We calculated the energy provided by macronutrients and total daily energy intake based on 4 kcal/g of carbohydrate, 4 kcal/g of protein, and 9 kcal/g of fat in conjunction with the food composition table.
Depressive symptoms were assessed according to the Geriatric Depression Scale, one of the most widely used scales for assessing depressive symptoms in the elderly; it consists of 30 self-assessment items with yes/no response options, one point for being yes, no point for being no. A total of 0–10 points indicate no depressive symptoms, 11–20 points indicate mild depressive symptoms, and 21–30 points indicate severe depressive symptoms.
Physical measurements and blood collection were performed for each participant in the morning under fasting conditions. The height, weight, and blood pressure of the respondents were measured in a standardized manner using the uniformly distributed instruments. Fasting venous blood was collected to measure serum total cholesterol, triglycerides, High-Density Lipoprotein Cholesterol (HDL-C), and Low-Density Lipoprotein Cholesterol (LDL-C) Levels.
Diagnostic criteria of disease and definition of related variables
In this study, a depression scale score of ≥ 11 was defined as the presence of depressive symptoms. Baseline characteristics included were age; gender; education level; body mass index; physical activity level; smoking or nonsmoking; drinking or nondrinking; presence or absence of hypertension, diabetes, or dyslipidemia; total daily energy intake; and daily energy intake of protein, fat, and carbohydrates. Age was the self-reported age of the subjects. Education level was divided into a low education group, medium education group, and high education group. Study subjects who were unaware of their education level, did not attend school, or did not graduate from elementary school were classified in the low education group; those who graduated from elementary school or junior high school were classified in the medium education group; and those who graduated from high school or higher were classified in the high education group. Smoking was defined as smoking at least one cigarette per day presently; otherwise, the subject was considered nonsmoking. No alcohol consumption within the last year was defined as nondrinking. Study subjects with hypertensive disorders or systolic blood pressure ≥ 140 mmHg and/or diastolic blood pressure ≥ 90 mmHg were defined as hypertensive patients [24]. Study subjects who reported having diabetes or fasting blood glucose values ≥ 7.0 mmol/l were defined as diabetic patients [25]. The presence of any physical activity according to the questionnaires of the study. The presence of any one or more of the following was defined as dyslipidemia: hypercholesterolemia, hypertriglyceridemia, elevated LDL-C, and lower HDL-C [26].
Statistical analysis
The proportion of total energy from protein, fat, and carbohydrate energy was used as the independent variable, and after correcting for confounding factors, three penalty splines were performed with depressive symptom outcomes, taking into account the potential nonlinear relationship. Fat energy was further categorized into Saturated Fat (SF), Mono-Unsaturated Fat (MUF), and Poly- Unsaturated Fat (PUF) energy sources, and after correcting for confounding factors, the proportion of total energy from the three types of fat energy was penalized three times with depressive symptom outcomes to explore the relationship between MESR and the risk of depressive symptoms.
The Restricted Cubic Spline (RCS) is a regression spline with a restriction that requires the spline function to be linear in the two intervals at either end of the range of the independent variable data, allowing for more accurate predictions at both ends [27]. In this study, RCS fitted logistic regression was used, and the model was as follows:
logit (OR)=β0+rcs (X, k)
where OR is the risk of depressive symptoms, rcs (X, k) was modeled using restricted cubic splines, X is the independent variable, such as Proportion of Carbohydrate Energy Supply (PCES), and k=4.
To determine the relatively appropriate MESR, we used the Generalized Additive Models (GAM), incorporating two nutrient energy supply ratios into the model, to further explore the joint effect between the two nutrients. GAM is based on the generalized linear model and the additive model [28]. Its basic form is g ( μ )=s0+s1(X1)+s2(X2)+..+sp(Xp), n=s0+Σ_(i=1)^psi(Xi), μ=E(Y|(X1, X2, .. Xp), where n is the linear predictive value and si is a nonparametric smooth function. Moreover, this model does not require any assumptions of X on Y, and it consists of a random component Y, an additive component n, and a link function. In this study, the logit function was used as the link function, and the spline function was used as the smooth function according to the type of outcome indicator (binomial distribution), with correction for factors such as age and gender.
Continuous variables were described in the form of mean ± standard deviation, and a t-test was used to analyze the differences between groups. For categorical variables, the descriptions were in the form of quantities (percentages). The X² test was used to analyze the differences between groups. A statistical analysis was performed using R software (version 3.6.0). All statistical tests were performed using a two-sided test, and differences were considered statistically significant when P<0.05.
Descriptive statistics
This study included 3,095 middle-aged and older adults, of whom 808 (26.11%) were assessed as having depressive symptoms. The baseline characteristics of the study population are shown in Table 1. Compared with residents without depressive symptoms, those with depressive symptoms had higher levels of physical activity (372 (46.0%) vs. 754 (33.0%)), dyslipidemia (316 (39.1%) vs. 754 (33.0%)), and a higher carbohydrate intake (794.04 ± 326.79 vs. 765.41 ± 348.06 kcal/day). A higher proportion of residents with depressive symptoms were female (507 (62.7%)), and the proportion of depressive symptoms was higher among residents with low and medium education levels (693 (85.7%)). In the other indicators, no significant differences were found between the two groups.
| Characteristic | Non-Depressive symptoms(n=2287) | Depressive symptoms(n=808) | p-value | |
|---|---|---|---|---|
| Age | years | 67.66 ± 7.29 | 67.67 ± 7.48 | 0.971 |
| Sex | male | 1007(44.0%) | 301(37.3%) | 0.001 |
| female | 1280(56.0%) | 507(62.7%) | ||
| Education leve | low | 880(38.5%) | 267(33.0%) | 0.008 |
| medium | 1065(46.6%) | 426(52.7%) | ||
| high | 342(15.0%) | 115(14.3%) | ||
| Tobacco Smoking | no | 1788(78.2%) | 654(80.9%) | 0.098 |
| yes | 499(21.8%) | 154(19.1%) | ||
| Alcohol Drinking | no | 1928(84.3%) | 691(85.5%) | 0.41 |
| yes | 359(15.7%) | 117(14.5%) | ||
| Hypertension | no | 812(35.5%) | 292(36.1%) | 0.747 |
| yes | 1475(64.5%) | 516(63.9%) | ||
| Diabetes | no | 1922(84.0%) | 682(84.4%) | 0.807 |
| yes | 365(16.0%) | 126(15.6%) | ||
| BMI(kg/m2) | 25.037 ± 3.78 | 25.192 ± 4.03 | 0.327 | |
| Physical activity | no | 1466(64.1%) | 436(54.0%) | <0.001 |
| yes | 821(35.9%) | 372(46.0%) | ||
| Dyslipidemia | no | 1533(67.0%) | 492(60.9%) | 0.002 |
| yes | 754(33.0%) | 316(39.1%) | ||
| Daily energy intake | 1349.99 ± 603.16 | 1371.32 ± 568.37 | 0.381 | |
| (kcal/day) | ||||
| Daily protein intake | 230.54 ± 119.59 | 235.62 ± 119.92 | 0.3 | |
| (kcal/day) | ||||
| Daily fat intake | 354.02 ± 245.13 | 341.66 ± 201.83 | 0.198 | |
| (kcal/day) | ||||
| Daily carbohydrate intake | 765.41 ± 348.06 | 794.04 ± 326.79 | 0.041 | |
| (kcal/day) |
Table 1: Baseline characteristics of the 3095 Subjects.
Relationship between MESR and risk of depressive symptoms
Figure 2A shows the RCS results for the relation of MESR and depressive symptoms. There was no significant correlation between the Proportion of Protein Energy Supply (PPES) and the risk of depressive symptoms (P=0.0667) (Figure 2A), but the Protein Fat Energy Supply (PFES) was negatively correlated with the risk of depressive symptoms (P<0.001); the Proportion of Carbohydrate Energy Supply (PCES) was reversed (P<0.001) (Figures 2B and 2C).
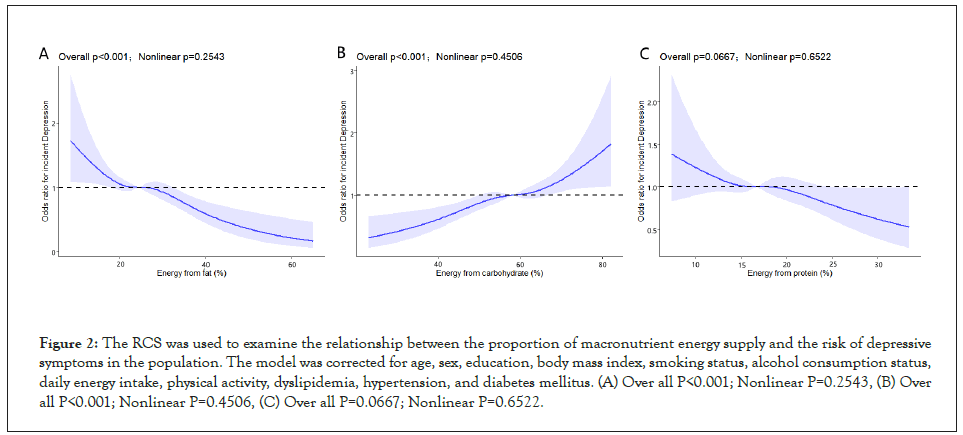
Figure 2: The RCS was used to examine the relationship between the proportion of macronutrient energy supply and the risk of depressive symptoms in the population. The model was corrected for age, sex, education, body mass index, smoking status, alcohol consumption status, daily energy intake, physical activity, dyslipidemia, hypertension, and diabetes mellitus. (A) Over all P<0.001; Nonlinear P=0.2543, (B) Over all P<0.001; Nonlinear P=0.4506, (C) Over all P=0.0667; Nonlinear P=0.6522.
Figure 3A shows the results of RCS results for the relation of different types of PFES and depressive symptoms. The proportion of MonoUnsaturated Fat Energy Supply (PFES-M) and the proportion of Polyunsaturated Fat Energy Supply (PFES-P) were negatively associated with the risk of depressive symptoms (P=0.0062, P<0.0001) (Figures 3A and 3B), while the risk of depressive symptoms decreased, then increased, and finally showed a flat decrease (P<0.0240) with the increase of saturated fat energy supply PFES-S (Figure 3C).
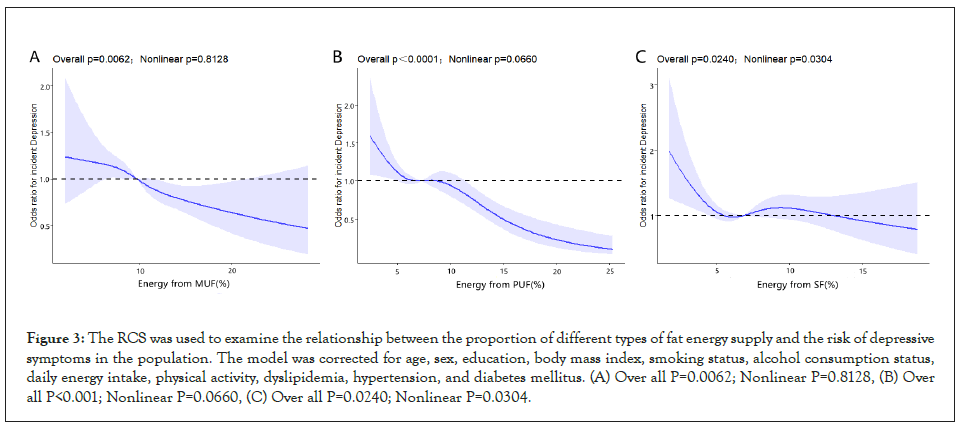
Figure 3: The RCS was used to examine the relationship between the proportion of different types of fat energy supply and the risk of depressive symptoms in the population. The model was corrected for age, sex, education, body mass index, smoking status, alcohol consumption status, daily energy intake, physical activity, dyslipidemia, hypertension, and diabetes mellitus. (A) Over all P=0.0062; Nonlinear P=0.8128, (B) Over all P<0.001; Nonlinear P=0.0660, (C) Over all P=0.0240; Nonlinear P=0.0304.
Relationship and interaction between energy supply ratio of two nutrients and depressive symptoms
Figure 4A shows the relationship between depressive symptoms and the proportion of energy supplied by the three macronutrients after correcting for confounding factors (Figure 4A). The relationship among PCES, PPES, and the risk of depression is complex, with two peaks. As PPES increased, the protective effect of PFES on the risk of depression decreased (Figure 4B). The risk of depression was lower when the PCES was less than 50% and the PFES was more than 40% (Figure 4C).
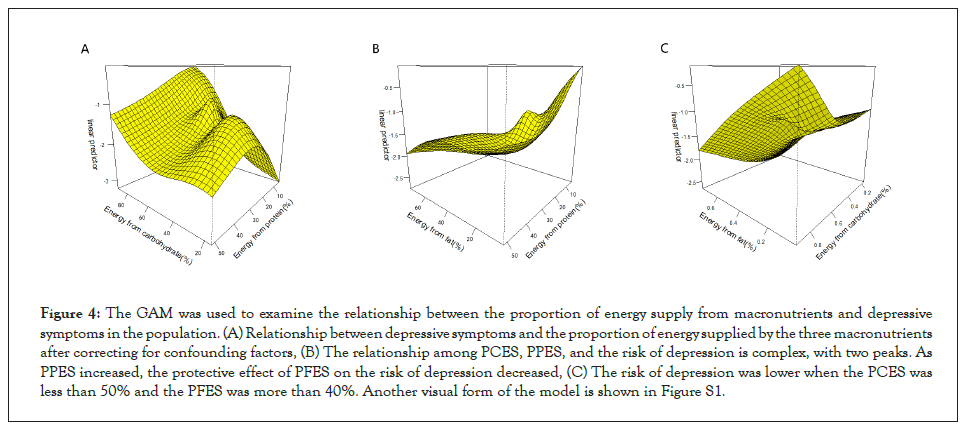
Figure 4: The GAM was used to examine the relationship between the proportion of energy supply from macronutrients and depressive symptoms in the population. (A) Relationship between depressive symptoms and the proportion of energy supplied by the three macronutrients after correcting for confounding factors, (B) The relationship among PCES, PPES, and the risk of depression is complex, with two peaks. As PPES increased, the protective effect of PFES on the risk of depression decreased, (C) The risk of depression was lower when the PCES was less than 50% and the PFES was more than 40%. Another visual form of the model is shown in Figure S1.
Figure 5A shows the relationship between depressive symptoms and carbohydrate, protein, and three types of PFES. In models that included the PCES, we found that the risk of depressive symptoms was positively associated with the PCES, almost independent of MUF with a synergistic effect of SF, while PFES-P was protective against the elevated risk of depression associated with carbohydrate intake (Figures 5A-5C). In the model of PPES, the PFES of three different types and the risk of depression, different types of PFES were negatively correlated with the risk of depression on the whole, but proteins play a complex role. With the increase of protein, the protective effect from PFES-P was adverse but was beneficial for PFES-M. The special situation appeared in the relationship with PFES-S; when PFES-S was more than 10% and PPES was more than 20%, the risk of depression showed a rapid decline (Figures 5D-5F).
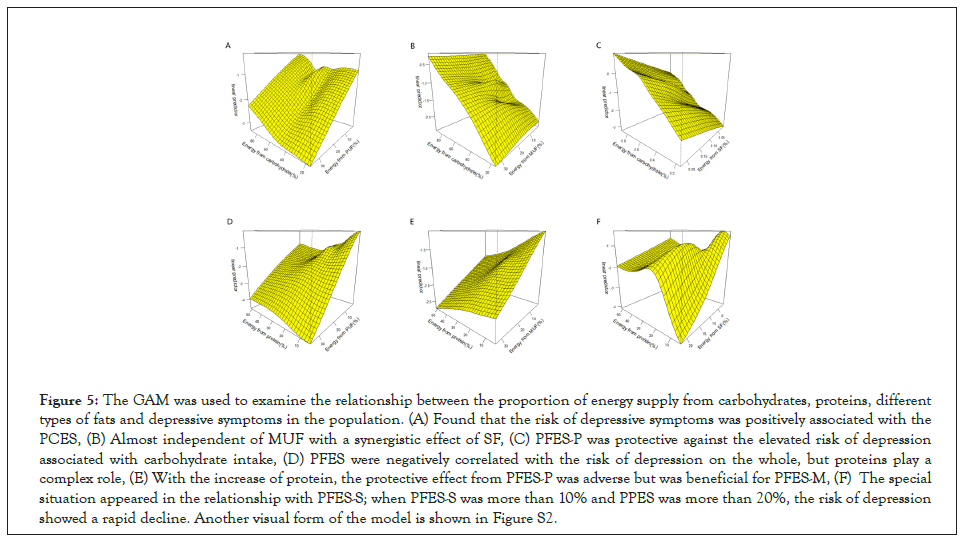
Figure 5: The GAM was used to examine the relationship between the proportion of energy supply from carbohydrates, proteins, different types of fats and depressive symptoms in the population. (A) Found that the risk of depressive symptoms was positively associated with the PCES, (B) Almost independent of MUF with a synergistic effect of SF, (C) PFES-P was protective against the elevated risk of depression associated with carbohydrate intake, (D) PFES were negatively correlated with the risk of depression on the whole, but proteins play a complex role, (E) With the increase of protein, the protective effect from PFES-P was adverse but was beneficial for PFES-M, (F) The special situation appeared in the relationship with PFES-S; when PFES-S was more than 10% and PPES was more than 20%, the risk of depression showed a rapid decline. Another visual form of the model is shown in Figure S2.
Figure 6A shows the relationship between the three types of PFES and depressive symptoms. PFES-P showed the strongest protective effect among the three (particularly more than 20%), and the effect of PFES-M and PFES-S on the protective effect of PFES-P was not obvious (Figures 6A and 6B). In the model of PFES-M, PFES-S, and risk of depressive symptoms, PFES-M showed the protective effect, while PFES-S had the opposite effect (Figure 6C).
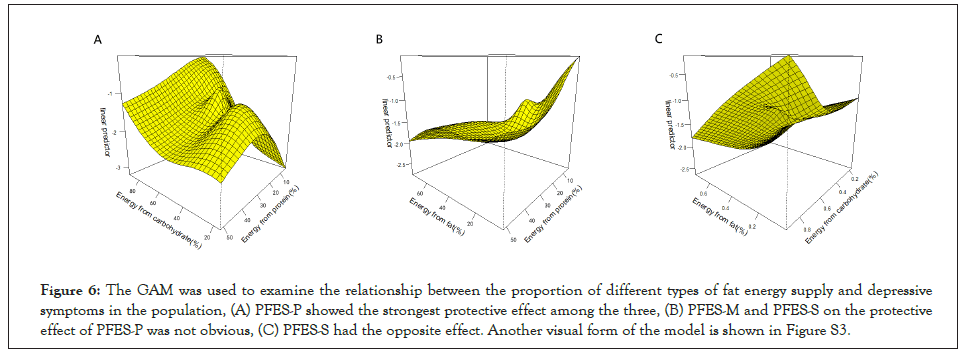
Figure 6: The GAM was used to examine the relationship between the proportion of different types of fat energy supply and depressive symptoms in the population, (A) PFES-P showed the strongest protective effect among the three, (B) PFES-M and PFES-S on the protective effect of PFES-P was not obvious, (C) PFES-S had the opposite effect. Another visual form of the model is shown in Figure S3.
Diet, as a modifiable factor, may influence the risk of depression, but diet is a multidimensional exposure factor that includes combinations and interactions between dietary components [29]; therefore, studying dietary patterns that reflect the overall characteristics of the diet seems to be a more comprehensive and effective way to find the relationship between diet and illness. In recent years, many articles have been published on the relationship between dietary patterns and depression. However, even for the same dietary pattern, different studies have revealed different findings. This study takes the perspective of MESR as a continuous-type variable rather than a categorical definition of dietary characteristics. A preliminary quantitative exploration of the relationship between macronutrient intake and depression symptoms was conducted. It was found that a dietary pattern characterized by a high PFES (>40%), particularly a high proportion of PUF (>20%), and a low PCES (<50%) was associated with a lower risk of depressive symptoms in Figures S1-S3.
Much of the existing research on the relationship between fats and depression has focused on PUFA and SF. A mate analysis found that the use of omega-3 PUFA was effective in patients diagnosed with Major Depressive Disorder (MDD) as well as in depressed patients without a diagnosis of MDD [30]. The possible pathogenesis of depression includes monoamine deficiency and hypothalamic-pituitary-adrenal axis hyperactivation [31], which is also associated with immune system activation and chronic inflammation [32,33]. The role played by PUFA in depression may be related to its neuroendocrine regulation and anti-inflammatory effects [34,35]. The results of this study also showed a significant negative association between MUF and PUF intake and depressive symptoms and suggested a rapid reduction in the risk of depressive symptoms with a higher PFES-P (>20%) after correction for associated factors. As for SF, some animal experiments have found that a high-fat (SF), high-refined sugar (sucrose) diet can reduce Brain- Derived Neurotrophic Factor (BDNF) levels in the hippocampus of rodents [36], while low levels of BDNF are thought to promote hippocampal atrophy and depression [37]. SF can also inhibit 3', 5'-cyclic AMP protein kinase A signaling through the activation of phosphodiesterase 4A, thereby disrupting hypothalamic function and causing a depressive phenotype [38]. The same results were shown in this study, where SF and carbohydrates had a synergistic effect with an increased risk of depressive symptoms.
Whereas the effect of carbohydrate intake on mood is highly controversial, examining the relationship between carbohydrates and mood has become important in recent years as the global consumption of sugary products, particularly sugary beverages, has increased dramatically [39]. On the one hand, study has shown that carbohydrate intake has mood-boosting properties and that individuals with affective disorders (e.g., depression) tend to selfmedicate by increasing their carbohydrate intake, as compared with healthy populations [40,41]. On the other hand, other studies have found that a high-carbohydrate intake is associated with a higher prevalence of depression [42,43]. A recent mate analysis found that carbohydrates had no positive effect on any aspect of mood at any point in time after intake, but rather they increased fatigue and decreased alertness [44]. In this study, the risk of depressive symptoms was found to be at a lower level when PCES was at approximately less than 50%, taking into account the intake of other macronutrients, which again suggests that high-carbohydrate intake is detrimental to depressive symptoms.
Possible mechanisms for the association between carbohydrate intake and risk of depression include the following: a highsugar diet induces hypoglycemia through an exaggerated insulin response, which affects hormone levels and underlying mood states [45], while carbohydrate consumption is associated with an increase in circulating inflammatory markers, which may suppress mood [46,47].
The results of GAM also suggest that diet has interactions among macronutrients, as a whole, and influence the relationship with depressive symptoms outcomes. Although the RCS results showed no significant association between PPES and risk of depressive symptoms, the combination of protein and different macronutrients in GAM that included protein led to complicated associations between PPES and depressive symptoms. Regarding the relationship between dietary protein and depression, the results of different studies widely vary, with one study in the United States finding that total protein intake and protein intake from milk and dairy products may reduce the risk of depressive symptoms in adults [48]. Its follow-up study found a positive association between protein intake and major depressive mood in American women [49]. A Japanese study, however, found no significant association between protein intake and depressive symptoms [50]. These findings suggest that the role of other factors should be fully considered when exploring the relationship between a single nutrient in the diet and depressive symptoms outcomes. The health effects of different food sources of nutrients may also differ. Current recommended dietary patterns for patients with depression include low-carbohydrate diets, ketogenic diets, and Mediterranean diets. Low-carbohydrate diets emphasize the role of low-carbohydrate intake in the diet, and a recent cross-sectional study of the relationship between low-carbohydrate diets and depression scores found a negative association between carbohydrate diet scores and risk of depression in patients with diabetes [51].The more extreme ketogenic diet, which is characterized by a high-fat intake instead of carbohydrate intake, compared with the low-carbohydrate diet, has been used for the treatment of severe medically refractory epilepsy since 1921 [52]. Today, the use of the ketogenic diet is highly prevalent. Animal experiments have found that the ketogenic diet may positively affect depression [53,54] and suggest that while its antidepressant effect may be mediated by this may be through restoration of microglia inflammatory activation and neuronal excitability [55]. Moreover, a recent meta-analysis of the effects of the Mediterranean diet on stroke, cognitive impairment, and depression found that moderate and high adherence to the Mediterranean diet was consistently associated with a reduced risk of depression. It also found that adherence to the Mediterranean diet may help prevent a range of brain disorders [56].
The results of this study suggest that a dietary pattern characterized by a high PFES (>40%), particularly a high PFES-P (>20%), and a low PCES (<50%) would be more beneficial for reducing the risk of depression. Compared with the low carbohydrate diet, the energy supply ratio characteristics of this diet model are more similar to the ketogenic diet, because it considers not only the role of carbohydrate intake ratio, but also the role of fat intake ratio. Our study has the following strengths. First, we quantitatively explored the relationship between MESR as a continuous-type variable and depressive symptoms, and proposed a suitable MESR range for the first time. Second, GAM was used to investigate the combined effect of two nutrients on the risk of depression as a whole. Our study also has some limitations. As a cross-sectional study, we were unable to determine the causality of the findings. More prospective cohort studies are needed to confirm the current findings. Also, this study only focuses on the proportion of dietary macronutrient composition and did not consider their food sources. In conclusion, based on a constant total daily energy intake, a dietary pattern characterized by a high PFES (>40%), particularly a high proportion of PFES-P (>20%), and a low PCES (<50%) is recommended as a dietary pattern for preventing depression in middle-aged and older adults.
We are very grateful to the investigators and workers from Shijiazhuang, Tangshan, Hunan and Hebei provinces, including the provincial, municipal, district. Center for Disease Control and Prevention, the township health center, and the Medical University of Hebei province. In addition, the authors would like to thank all of the participants.
Yuxia Ma received the fund. Yuxia Ma, Jun Ge, and Xin Huang conceptualized this work and supervised the data collection. Xian Gao, Yutian Zhou, Yan Sun and Huichen Zhu trained the investigators.
Meiqi Zhou, Qingxia Li, Limin Zhang, Shuaishuai Lv edited the questionnaires of the portable devices. Xian Gao and Yutian Zhou, wrote the manuscript and made the same contribution. All authors read and approved the final manuscript.On behalf of all authors, the corresponding author states that there is no conflict of interest.
Community Cohort Study on Specialized Nervous System Diseases (No.2017YFC0907701).
The studies involving human participants were reviewed and approved by the National Institute for Nutrition and Health, Chinese Center for Disease Control and Prevention. The patients/ participants provided their written informed consent to participate in this study.
All authors agree to publish
The datasets used and analyzed during the current study are available from the corresponding author on reasonable request.
The authors have no conflicts of interest.
[Crossref][Google Scholar][PubMed].
[Crossref][Google Scholar][PubMed].
[Crossref][Google Scholar][PubMed].
[Crossref][Google Scholar][Pubmed].
[Crossref][Google Scholar][Pubmed].
[Crossref][Google Scholar][Pubmed].
[Crossref][Google Scholar][Pubmed].
[Crossref][Google Scholar][Pubmed].
[Crossref][Google Scholar][Pubmed].
[Crossref][Google Scholar][Pubmed].
[Crossref][Google Scholar][Pubmed].
[Crossref][Google Scholar][Pubmed].
[Crossref][Google Scholar][Pubmed].
[Crossref][Google Scholar][Pubmed].
[Crossref][Google Scholar][Pubmed].
[Crossref][Google Scholar][Pubmed].
[Crossref][Google Scholar][Pubmed].
[Crossref][Google Scholar][Pubmed].
[Crossref][Google Scholar][Pubmed].
[Crossref][Google Scholar][Pubmed].
[Crossref][Google Scholar][Pubmed].
[Crossref][Google Scholar][Pubmed].
[Crossref][Google Scholar][Pubmed].
[Crossref][Google Scholar][PubMed].
[Crossref][Google Scholar][PubMed].
[Crossref][Google Scholar][PubMed].
[Crossref][Google Scholar][PubMed].
[Crossref][Google Scholar][PubMed].
[Crossref][Google Scholar][PubMed].
[Crossref][Google Scholar][PubMed].
[Crossref][Google Scholar][PubMed].
[Crossref][Google Scholar][Pubmed].
[Crossref][Google Scholar][Pubmed].
[Crossref][Google Scholar][Pubmed].
[Crossref][Google Scholar][Pubmed].
[Crossref][Google Scholar][Pubmed].
[Crossref][Google Scholar][Pubmed].
[Crossref][Google Scholar][Pubmed].
[Crossref][Google Scholar][Pubmed].
[Crossref][Google Scholar][PubMed].
[Crossref][Google Scholar][PubMed].
[Crossref][Google Scholar][PubMed].
[Crossref][Google Scholar][PubMed].
[Crossref][Google Scholar][PubMed].
[Crossref][Google Scholar][PubMed].
[Crossref][Google Scholar][PubMed].
[Crossref][Google Scholar][PubMed].
[Crossref][Google Scholar][PubMed].
[Crossref][Google Scholar][PubMed].
[Crossref][Google Scholar][PubMed].
Citation: Ma Y, Gao X, Huang X, Sun Y, Zhu H, Zhou M, et al. (2022) Specific Ratios of Macronutrient: Intake to Reduce the Risk of Depressive Symptoms in People Aged 55 Years and Older in Northern China. J Dep Anxiety.11:479.
Received: 22-Aug-2022, Manuscript No. JDA-22-18957; Editor assigned: 26-Aug-2022, Pre QC No. JDA-22-18957 (PQ); Reviewed: 09-Sep-2022, QC No. JDA-22-18957; Revised: 16-Sep-2022, Manuscript No. JDA-22-18957 (R); Published: 23-Sep-2022 , DOI: 10.35248/2167-1044.22.11.479
Copyright: © 2022 Ma Y, et al. This is an open access article distributed under the terms of the Creative Commons Attribution License, which permits unrestricted use, distribution, and reproduction in any medium, provided the original author and source are credited.