
Journal of Clinical Chemistry and Laboratory Medicine
Open Access
ISSN: 2736-6588

ISSN: 2736-6588
Research Article - (2024)Volume 7, Issue 3
Peptide Loaded Chitosan Coated (PLCC) and Sodium Alginate (SA) nanoparticles are considered as an effective deliver therapeutic molecules to the target site. PLCC and SA nanoparticles were synthesized by the ionic gelation process and their peptide polymer compatibilities were analysed by Fourier Transform-Infrared Spectroscopy (FT-IR) and X-Ray Diffraction (XRD). Nanoparticles (NPs) morphology Scanning Electronic Microscope (SEM), process yield, association and loading efficiency, in vitro peptide release, size distribution and zeta potentials, kinetic modelling, haemocompatibility, plasma stability, genotoxicity and embryo toxicity studies were performed by using Danio rerio model. High peptide polymer compatibility was high in PLCC than the SA nanoparticles. X-ray diffraction proved that the peptide had been loaded perfectly in the chitosan nanoparticles. SEM analysis showed that PLCC were irregularly arranged circular in shape. Process yield was 19.97%, association efficiency was 83.45%, loading efficiency was 1.85%, release rate was 71.95%, equally distributed and zeta potential was 32.6 ± 4.65. The toxicity screening of the peptide loaded chitosan coated was found to be concentration and time dependent manner.
Peptide loaded chitosan nanoparticles; In vitro peptide release; Zeta potential; Toxicity screening; Danio rerio model
Unique molecular size, basic synthesis and modification process, tumor penetrating potential with biocompatibility and anti-cancerous activities are the ideal characters of peptide therapeutics. Peptides pharmacokinetics and biological activities are easily affected by their short plasma half-life, poor oral bioavailability and different administration routes. Nanoparticles are the potential materials for protein delivery to target site especially into the nucleic acids of the tumor cells. Mechanism of peptide action is significantly high in tumor cells than normal cells. This phenomenon is the significant driving force for cancer targeted drug delivery [1,2].
The biocompatible polymers are either synthetic or natural polymers which are compactable in the in vivo system or it could have degraded by enzymatically or by the non-enzymatically into the non-toxic by-products, further it would excrete via the normal physiological pathways. A suitable molecular weight is required for the renal clearance from 30,000 to 40,000 based on the using polymer. Polymer size is larger than this, then the polymer necessity undergoes degradation. Either the chemical or the enzymatic biodegradation would provide the fragments suitable for the renal clearance. The chemical degradation is referred to the acid catalyzed degradation such as in the stomach. The biocompatible polymers are intended to be as a biological system like a peptide carrier, which desires to hold certain compulsive parameters such as the permeability, biodegradability, biocompatibility and the tensile strength, even though, these properties are interdependent to a certain degree. The advantages of the selection of the biocompatible polymers for the peptide delivery are: 1) constant peptide release rate at specific intervals, 2) catabolized into a non-toxic, absorbable subunit and easily detoxified from biosystem; 3) polymer permeability based diffusion coefficient. The Polymer-Peptide Conjugate (PPC) hydrogels is a physically-bonded network capable of imbibing large quantities of water. There are many advantages of using the PPC hydrogels for the biomaterials including the combination of the best properties of peptides and that of synthetic polymers which is noteworthy [3].
Chitosan is the most existing basic biopolymer and similar to cellulose in structure which is composed of only one monomer of glucose. The solubility, biodegradability, reactivity and adsorption of many substrates depend upon the amount of the protonated amino groups in the polymeric chain of chitosan. The biodegradability of chitosan is ensured by the enzymes which are able to hydrolyse glucosamine-glucosamine, glucosamine-N-acetyl-glucosamine and N-acetyl-glucosamine-N-acetyl glucosamine linkages. Chitosan is known to be degraded in vertebrates predominantly by lysozyme and by certain bacterial enzymes in the colon. Chitosan particles have been studied for nasal delivery of proteins. It was noticed earlier that the insulin loaded chitosan nanoparticles enhanced the nasal absorption of the proteins to a greater extent than the relevant chitosan solutions. The insulin-loaded nanoparticles were produced by spray-drying a mannitol/lactose solution resulting in powders with a particle size of approximately 1 to 3 micrometers, which is optimal for alveolar deposition [4-10].
The sodium alginate is made up of sodium salt consist of alginic acid which is a mixture of polyuronic acids composed by the residues such as D-mannuronic acid and L-guluronic acid units. These units are interlinked by the β-1,4 and the α-1,4 glycosidic bonds to form a chain. Due to the equatorial-equatorial bonding, the mannuropyranosyluronic region looks flat and ribbon-like similar to the cellulose conformation. The gulopyranosyluronic acid region has a wrinkled conformation due to the axial-axial glycosidic bonds. Alginates consist of large number of free hydroxyl and carboxyl groups distributed along its backbone which makes it a better candidate for chemical modification. The sodium alginate is widely used in cosmetics, food products and pharmaceutical formulations, such as in tablets and in topical products. It is generally regarded as a non-toxic and non-irritant material, although excessive oral consumption may be harmful. The augmented reports display the hydrogel systems used for delivery of proteins and peptides is very effective. The peptide ICD-85 (combination of 3 peptides isolated partially from two different venoms) loaded with sodium alginate nanoparticles were prepared and investigated for their ability to inhibit the proliferation of the cancer cells. The ICD-85 peptide is loaded with the sodium alginate nanoparticles which can reduce its necrotic effect in the primary lamb kidney cells. An important mechanism of this cancer cells can adapt to the hypoxic microenvironment is through the activation of Hypoxia Inducible Factors (HIF), which are heterodimer composed of an O2-regulated HIF-1α or HIF-2α subunit and a constitutively expressed HIF-1β subunit [11,12].
Hypoxia inducible factor 9 peptide chitosan nanoparticles
Peptide Chitosan Nanoparticles (PCN) were prepared by using ionic cross linking of chitosan with sodium Tripolyphosphate (TPP) anions [13]. Chitosan 20 mg/mL was dissolved in separately aqueous solution of acetic acid (2% v/v) at pH 5.5 with constant stirring at 10°C (1 h). Aqueous solution of TPP ratio, Chitosan: TPP (1/0.1) was added in drops to the above solution and kept in the magnetic stirrer for 3 h. 100 ng/mL Hypoxia Inducible Factors 9 (HIF9) peptide (previously dissolved with High Performance Liquid Chromatography (HPLC) grade water) was added and continuously stirring for the next 6 h (4°C). The resultant was centrifuged at 13000 rpm at 4°C for 20 min. The supernatant was removed and PCN were collected and freeze-dried (-55°C) for further process.
Peptide hypoxia inducible factor 9 sodium alginate nanoparticles
Sodium Alginate Peptide Nanoparticles (SPN) were prepared by controlled ionic gelation method [12,14]. Calcium chloride (2 mL, 18 mM) was added to sodium alginate solution (38 mL, 0.1% w/v) to promote gelation. 100 ng/mL of HIF9 peptide (previously dissolved with HPLC grade water) was added to calcium alginate solution to form nanoparticles. The suspension was stirred for 2 h and kept overnight for stabilization. The nanoparticles subjected to centrifugation (13000 rpm) for 45 min at 4°C. The supernatant was then removed and peptide sodium alginate nanoparticles were collected and freeze-dried (-55°C) for further process.
Peptide polymer compatibility study
Fourier transform-infrared spectroscopy analysis: The peptide and Potassium Bromide (KBr) were prepared by constricting the powder at 20 psi for 10 min on KBr and the spectra were scanned in the wave number range of 4000 cm-1-400 cm-1. FT-IR was carried on peptide HIF9, pure polymers, chitosan and sodium alginate formulations containing both peptide and polymers were performed to study the peptide HIF9 and polymer interaction.
X-ray diffraction study: Crystallinity studies were performed for chitosan and PCN-M04 to confirm the non-existence of crystalline structure. XRD studies were performed on the samples by exposing them to Cuk α1 radiation and the scanning rate was 5% min over a range of 4°C-90°C and with an interval of 0.1°C.
Characterization of peptide chitosan nanoparticles
The chitosan nanoparticles were formulated by keeping constant peptide HIF9 concentration at different ratios of chitosan. Different concentrations of chitosan (0.5, 1.0, 2.0, 4.0 and 6.0% (w/v)) were obtained by dissolving in acetic acid (2% v/v) under constant stirring (300 rpm) for overnight. The ratio of chitosan: TPP (1/0.1) were mixed added 100 ng/mL of peptide HIF9 and stirring was raised to 320 rpm for 6 h at 4°C. The resultant dispersion was subjected to sonication for 10 min at 4°C. Further, the dispersion was washed thrice (2200 × g) and re-dispersed in HPLC grade water and again centrifuged at 13000 rpm for 20 min at 4°C to obtain five different peptide polymer ratio formulations (PCN-M01 (1:0.5), PCN-M02 (1:1.0), PCN-M03 (1:2.0), PCN-M04 (1:4.0) and PCN-M05 (1:6.0)). Finally, the nanoparticles were freeze dried and stored at -20°C for further characterization.
Morphological analysis
Scanning Electron Microscopy (SEM) of the chitosan nanoparticles were performed to observe the particle size and surface morphology. The size and shape of the nanoparticles were further characterized using the Transmission Electron Microscope (TEM).
Process yield
The freeze dried formulations (PCN-M01 to PCN-M05) were weighed in order to calculate the process yield as previously described by Nesalin et al., [15]. The results were expressed as mean values of three replicates.
Association and loading efficiency
Association Efficiency (AE) and Loading Efficiency (LE) were calculated based on the slight modification Ma et al., method [16]. Momentarily, peptide chitosan nanoparticles were pelletized at 5800 rpm and supernatant was quantified for peptide by HPLC. The formulae mentioned below were used to calculate AE and LE.


In vitro peptide release
In vitro release of formulations (PCN-M01 to PCN-M05) was determined by plasma simulation and dialysis membrane method with slight modifications [17,18]. Briefly, the formulations were re-dispersed in 10 mL of Sodium Chloride (NaCl) (0.9% w/v) with final peptide concentration of 20 ng/mL. One milliliter of the above mentioned mixture was added to 10 mL of Phosphate-Buffered Saline (PBS) (0.5 M, pH 7.4) and 10 mL of suspended blood cells were added. The suspension was kept in orbital shaker at 37°C. One milliliter of released solution was collected at different time intervals and replaced with fresh solution. The harvested solutions were centrifuged and supernatant was used to analyze peptide content using HPLC method. The release rate was calculated using following equation.

In dialysis membrane method, 2 mg of formulations (PCN-M01 to PCN-M05) was redispersed in 10 mL of PBS (0.5 M pH 7.4), placed in dialysis membrane (cut-off 10 kDa) and dialyzed against PBS (0.5 M pH 7.4). Two milliliter of released solution was collected at different time intervals, replaced with fresh solution and analyzed using HPLC by calibration curve method.
Size distribution and zeta potentials
The size distribution and zeta potentials of formulations (PCN-M01 to PCN-M05) were measured by zeta sizer. Sample was dispersed in water (pH 7.4) and the particles were counted in 4.8 mm calibrated area with the count rate of 210.3 kilo counts per second (Kcps) for 70 sec. The analysis was performed in triplicates and mean values were reported.
Kinetic modelling
Kinetic model describing the mechanism dissolution of the drug which represented the in vitro release obtained from dialysis membrane and plasma simulation methods were fitted with various kinetic equations such as zero order, first order, Higuchi’s model and Peppa plot methods using following equations.
Zero order release rate kinetic: For the zero-order release kinetics the release rate data were fitted to the following equation.
F = Kot
Where ‘F’ is the drug release, ‘Ko’ is the release rate constant and ‘t’ is the release time. The plot of % drug release versus time is linear.
First order release rate kinetics: The release rate data were fitted to the following equation.
Log (100 - F) = kt
Higuchi release model
To study the Higuchi release kinetics, the release rate data were fitted to the following equation.

Where ‘k’ is the Higuchi constant, in Higuchi model, a plot of % drug release versus square root of time is linear.
Korsmeyer and Peppa release model: The release rate data were fitted to the following equation.

Where, Mt/M∞ is the fraction of drug released, K is the release constant and t is the release time. n is diffusion exponent, if n is equal to 1.0 the release is zero order.
If ‘n’ is equal to 0.5 the release is best explained by Fickian diffusion and if 0.5<n<1.0 then the release is through anomalous diffusion or non-fickian diffusion (swellable and cylindrical matrix). In this model, a plot of log (Mt/M∞) versus log (time) is linear.
Animal studies
Hemocompatibility of PCN-M04: Hemocompatibility was evaluated as previously reported by Pooja et al., [19]. Whole blood was collected from a wistar rats and anti-coagulated with sodium citrate (ratio of blood to anticoagulant taken was 9:1). Erythrocytes were isolated by centrifuging whole blood at 1000 × g for 10 min. The erythrocytes were washed thrice with saline before use. PCN-M04 were mixed with Red Blood Cells (RBCs) in different concentrations (2 μg/mL-12 μg/mL) and then incubated for 2 h at 37°C and the supernatant was collected by centrifugation at 1500 × g for 5 min. Haemoglobin release was monitored spectrophotometrically at 541 nm. TritonX-100 (1% v/v) and 0.9% (w/v) NaCl were taken as positive and negative controls, respectively. The hemolysis rate was calculated as follows:

Where, OD-test, OD-neg and OD-pos are the absorbance of the test sample, negative control and positive control, respectively. Triplicate measurements were performed for each sample.
Plasma stability of PCN-M04: Fresh blood (Wistar rat) was collected in heparinized tubes and plasma was separated by centrifugation (1800 × g for 15 min at 4°C). Separated plasma was incubated at 37°C for 30 min in 0.9% (w/v) of NaCl solution and PCN-M04 (10 ng) was added. Plasma solutions (1 mL) were collected at regular intervals and stored at -20°C until use. The peptide HIF9 content was analyzed by HPLC after centrifugation (17000 × g) at 20 min.
Genotoxicity of PCN-M04: The Genotoxicity studies for PCN-M04 were carried out by using plasmid University of California (pUC19) [20]. The PCN-M04 (20 ng and 40 ng) were suspended in double distilled water and added to 3 μl of pUC19 (1 ng) plasmid and the reaction mixture were run on 0.8% agarose gel for 30 min. Instead of PCN-M04, H2O2 (215 µM) served as positive control. The results were analyzed using Image J software.
Embryo toxicity of PCN-M04: Mature zebrafish were commercially purchased from local source and was maintained at 28°C according to westerfield protocol with 14/10 h light/dark cycle [21]. Zebrafish were fed with commercial spirulina micro pelleted food twice a day. Embryos were obtained from natural spanning of male and female (1:2 ratios) fishes overnight. The spawning was induced in the early morning by the onset of light source. Normally fertilized eggs those reached blastula stage were picked and maintained in E3 medium (0.2 mM Ca(NO3)2, 0.13 mM MgSO4, 19.3 mM NaCl, 0.23 mM KCl and 1.67 mM HEPES) for further experimental analysis [22]. Healthy embryos (n=30) were collected and exposed to PCN-M04, 4 hours-5 hours post fertilization (hpf). Each well contained 6 embryos with different concentrations of PCN-M04 (30 μg/L, 300 μg/L, 600 μg/L, 1000 μg/L). Throughout the experiment, the developmental status of the Danio rerio embryos and larvae was observed under compound microscope at different time intervals. The toxicity was assessed with multiple parameters such as zebrafish embryo/larva survival, hatching rate and malformations including tissue ulceration, pericardial edema and body arcuation.
Fourier transform-infrared spectroscopy analysis
The FT-IR spectrum Figures 1A and 1B, shows multiple polymers interactions with peptide. The yellow manifested spectra of peptide show significant peaks at 3395 cm-1 (O-H stretching). 1625 cm-1 (C=N stretching), 713 cm-1 (C-H stretching). In chitosan spectra the peaks were observed at 3360 cm-1 (N-H stretching), 1556 cm-1 (N=N stretching). 1386 cm-1 (C=O), 1257 cm-1 (C-O stretching), 1083 cm-1. The Peptide Chitosan Nanoparticles (PCN) shown significant peaks at 3380 cm-1 (O-H stretching), 1710 cm-1 (C=O stretching). Further, the sodium alginate spectrum shown significant peaks at 3473 cm-1 (O-H stretching), 1614 cm-1 (C=C stretching), 1414 cm-1 (C-H deformation vibration), 1018 cm-1 (CH3 rocking vibration). The broadening of peak at 3380 cm-1 was due to the intermolecular hydrogen bonding between chitosan and peptide when compared to the peak broadening resulted in Sodium Alginate Peptide Nanoparticles (SPN).
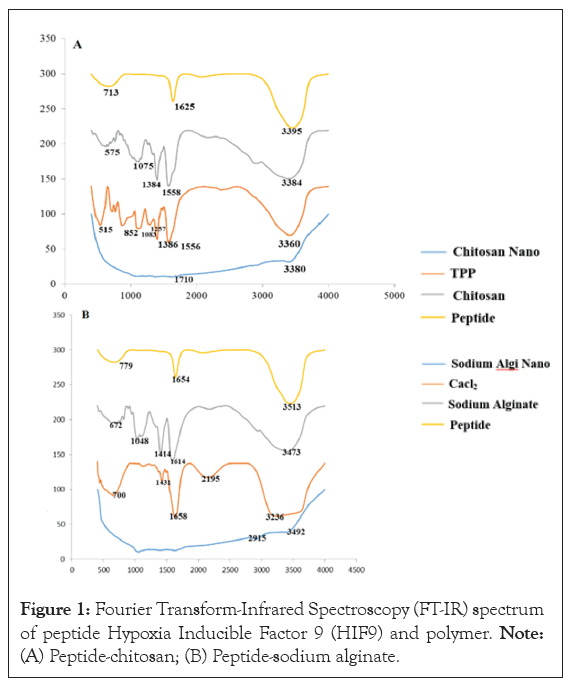
Figure 1: Fourier Transform-Infrared Spectroscopy (FT-IR) spectrum of peptide Hypoxia Inducible Factor 9 (HIF9) and polymer. Note: (A) Peptide-chitosan; (B) Peptide-sodium alginate.
X-ray diffraction spectrum of chitosan and peptide chitosan nanoparticles
The XRD spectrum of chitosan showed a sharp peak in 25 ϴ and PCN did not have the sharp peak at 25 ϴ. The ultra-structural image of PCN-M04 spherical shape particles and appeared to be little aggregated and the microscopical image shown in Figure 2.
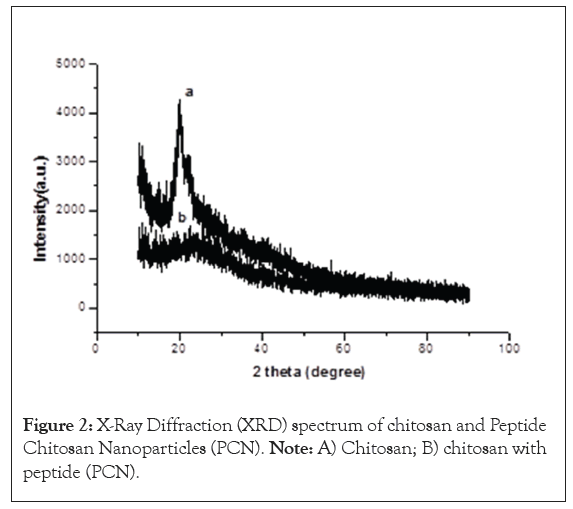
Figure 2: X-Ray Diffraction (XRD) spectrum of chitosan and Peptide Chitosan Nanoparticles (PCN). Note: A) Chitosan; B) chitosan with peptide (PCN).
Optimization of peptide polymer ratio
The effective peptide polymer ratio was optimized by keeping constant peptide concentration and variable chitosan concentrations. The different ratio result in higher yield and efficiency is due to the amount of peptide per unit of polymer. The result of process yield of formulations (PCN-M01 to PCN-M05) was found to be directly proportional to polymer ratio. The 1:4.0 (w/w) ratio of peptide polymer showed greater carbon efficiency which yields higher degree of process yield when compared with other peptide polymer ratio (Table 1). Interestingly, the increased peptide polymer ratio (1:4.0) results increases association and loading efficiencies. The mean particle size of formulations (PCN-M01 to PCN-M05) obtained by zeta seizer were ranged from 322 nm-532 nm. This greater particle size when compared to Transmission Electron Microscopy (TEM) analysis (200 nm-250 nm) might be due to swelling and formation of good polymeric networks of chitosan in the polar medium (water). The Poly Dispersity Index (PDI) of formulations (PCN-M01 to PCN-M05) was maintained on an average between 1.000-0.486. Formulation M04 possessed less PDI of 0.486 when compared with all other peptide polymer ratios.
| Batch code | Peptide chitosan ratio | Process yield (%) | Association efficiency (%) | Entrapment efficiency (%) | Z-average (d.nm) | Polydispersity (ᴆ) |
|---|---|---|---|---|---|---|
| M01 | 01:0.5 | 31.53 | 45.98 | 9.19 | 10.4 ± 3.73 | 1.000 |
| M02 | 01:1.0 | 27.75 | 67.89 | 5.65 | 22.3 ± 5.45 | 0.739 |
| M03 | 01:2.0 | 28.47 | 75.61 | 3.28 | 19.8 ± 5.34 | 0.744 |
| M04 | 01:4.0 | 19.97 | 83.45 | 1.85 | 32.6 ± 4.65 | 0.486 |
| M05 | 01:6.0 | 20.05 | 89.00 | 1.32 | 15.9 ± 4.37 | 0.978 |
Table1: Characteristics of peptide chitosan nanoparticles.
In vitro peptide chitosan nanoparticles release determination
The results of formulations (PCN-M01 to PCN-M05) release pattern showed Figures 3A and 3B, not much of variations in plasma simulation and membrane dialysis methods respectively. The HIF9 release pattern in 25 h was decreased the rate of peptide because of increased size of PCN. The peptide HIF9 content was achieved 50% of release between 3 h-10 h in most of the formulations. The fitting of release pattern into various kinetic modelling the results of all formulations followed Higuchi diffusion with regression values range (Table 2).
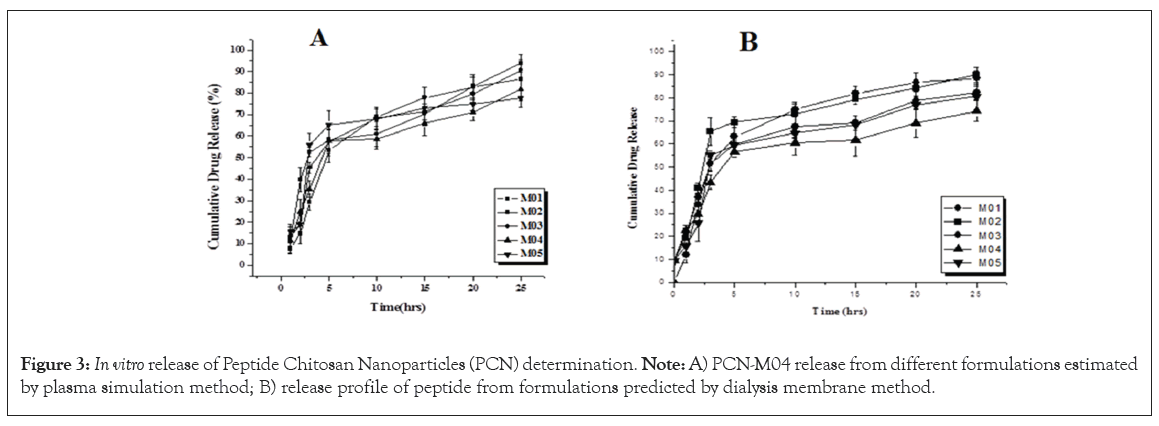
Figure 3: In vitro release of Peptide Chitosan Nanoparticles (PCN) determination. Note: A) PCN-M04 release from different formulations estimated by plasma simulation method; B) release profile of peptide from formulations predicted by dialysis membrane method.
| Batch code | Cumulative drug release (%) | Zero order | First order | Higuchi plot | Peppa plot | N value | Hixsson |
|---|---|---|---|---|---|---|---|
| Simulated blood plasma method | |||||||
| M01 | 78.31 | 0.845 | 0.574 | 0.942 | 0.773 | 1.184 | 0.032 |
| M02 | 80.11 | 0.754 | 0.463 | 0.863 | 0.653 | 0.924 | 0.059 |
| M03 | 68.57 | 0.722 | 0.485 | 0.872 | 0.636 | 0.974 | 0.044 |
| M04 | 71.95 | 0.777 | 0.487 | 0.962 | 0.738 | 0.953 | 0.072 |
| M05 | 75.22 | 0.582 | 0.473 | 0.723 | 0.698 | 0.992 | 0.10 |
| Dialysis membrane method | |||||||
| M01 | 78.12 | 0.789 | 0.338 | 0.923 | 0.488 | 0.87 | 0.013 |
| M02 | 93.2 | 0.623 | 0.388 | 0.898 | 0.536 | 0.834 | 0.054 |
| M03 | 55.15 | 0.732 | 0.353 | 0.933 | 0.587 | 0.887 | 0.076 |
| M04 | 68.81 | 0.732 | 0.333 | 0.938 | 0.567 | 0.834 | 0.087 |
| M05 | 69.00 | 0.623 | 0.438 | 0.788 | 0.634 | 0.966 | 0.067 |
Table 2: Release kinetics and mechanism of drug release.
Hemocompatibility of PCN-M04
The PCN-M04 results an insignificant damage of the erythrocytes even at higher concentrations (12 μg/mL), which might not be the case in normal therapy available in the practice (1 μg/mL-2 μg/mL). Further, PCN-M04 results increased hemolytic property by increasing concentration up to 12 μg/mL (Figure 4).
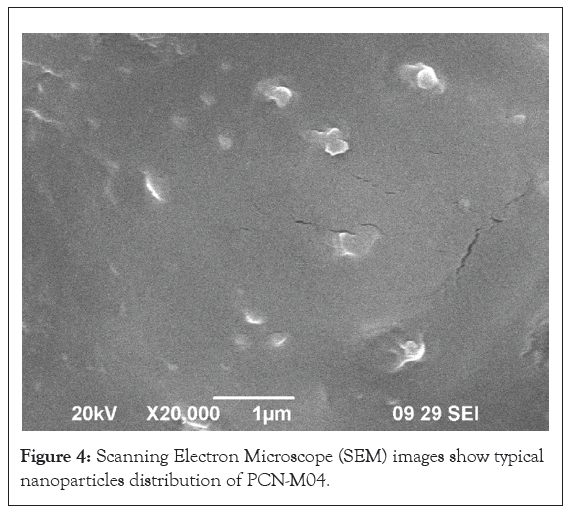
Figure 4: Scanning Electron Microscope (SEM) images show typical nanoparticles distribution of PCN-M04.
Plasma stability of PCN-M04
The results of plasma stability studies for PCN-M04 were represented in Figure 5. Nanoparticles might be degraded by some chemical (acids) and enzymes and the plasma stability of PCN-M04 is stable more than 60 min. Hence, PCN-MO4 is stable and suitable to target tumor tissue.
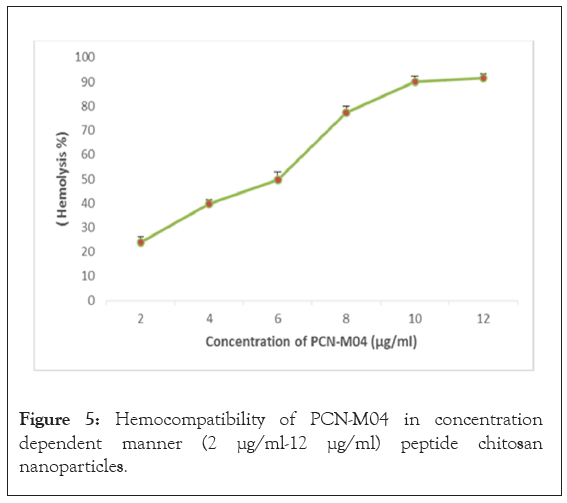
Figure 5: Hemocompatibility of PCN-M04 in concentration dependent manner (2 μg/ml-12 μg/ml) peptide chitosan nanoparticles.
Genotoxicity of PCN-M04
The Deoxyribonucleic Acid (DNA) damage assay of PCN-M04 shows no significant changes in lane-1, 3, 4 and 5 as well as intensity of band (Figure 6). The genotoxic intensity of band stands 100, 94, 93 and 92% respectively. Whereas, in Fenton’s reagent treated lane-2 shows the band intensity of 31% with fragmented DNA.
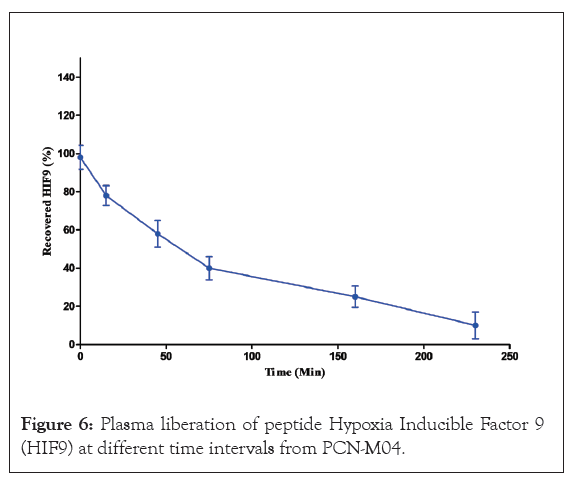
Figure 6: Plasma liberation of peptide Hypoxia Inducible Factor 9 (HIF9) at different time intervals from PCN-M04.
Embryo toxicity assessment
Survival rate: The survival rate of zebrafish embryos exposed to different concentration of PCN-M04 at specific time intervals was shown in Figure 7. Embryos were maintained in E3 medium showed no sign of lethality. Exposure of embryos at 100 μg/L of PCN-M04 exhibited significant lethal effect to zebrafish embryos for 96 h. Therefore, we suggested that PCN-M04 has a direct influence on survival rate which represents it is a toxic effect.
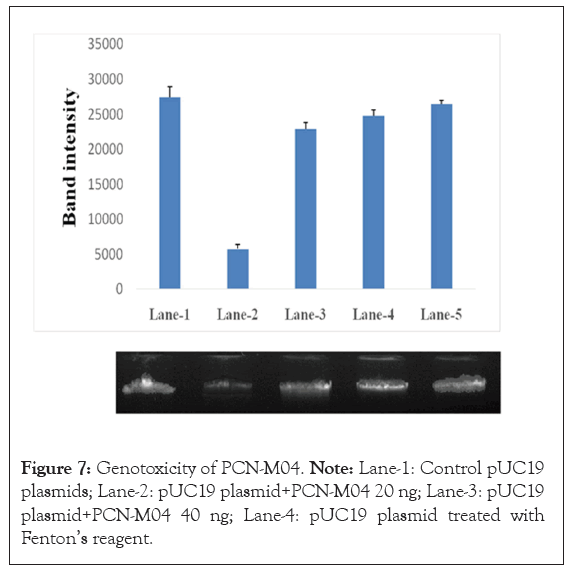
Figure 7: Genotoxicity of PCN-M04. Note: Lane-1: Control pUC19 plasmids; Lane-2: pUC19 plasmid+PCN-M04 20 ng; Lane-3: pUC19 plasmid+PCN-M04 40 ng; Lane-4: pUC19 plasmid treated with Fenton’s reagent.
Hatching rate: The hatching rate of zebrafish embryos exposed to different concentration of PCN-M04 at specific time intervals was shown in Figure 8. Embryos maintained in E3 medium showed no sign of lethality. Exposure of embryos at 100 μg/L of PCN-M04 exhibited no lethal effect on zebrafish embryos for 80 h. Therefore, we suggested that PCN-M04 did not influence on hatching rate which represents it is a no toxic effect.
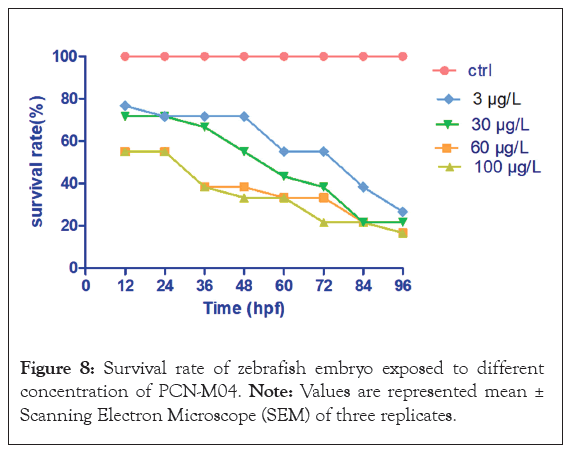
Figure 8: Survival rate of zebrafish embryo exposed to different concentration of PCN-M04. Note: Values are represented mean ± Scanning Electron Microscope (SEM) of three replicates.
Heart rate: Effect of PCN-M04 on heart rate of zebrafish embryos was shown in the Figure 9. The embryos exposed to PCN-M04 at 100 μg/L showed slight declines in heart rate but not significant with each other when compared to control.
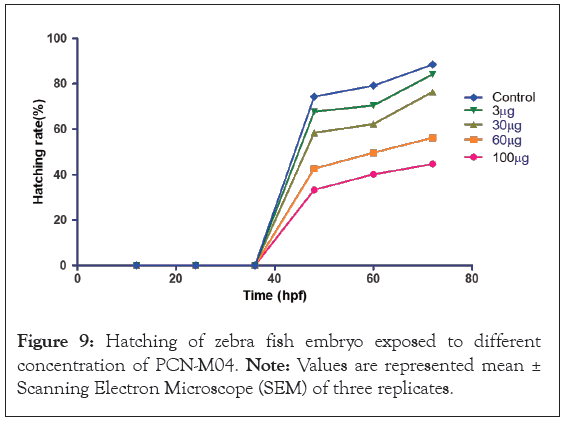
Figure 9: Hatching of zebra fish embryo exposed to different concentration of PCN-M04. Note: Values are represented mean ± Scanning Electron Microscope (SEM) of three replicates.
Deformities of Danio rerio-larvae
Alterations in phenotypic characteristics of zebrafish embryos after treatment with varying concentrations of PCN-M04 was shown in Figure 10. Embryos served as control develops normally with nil sign of abnormalities. Exposure with PCN-M04 at a concentration of 3,30,60 and 100 μg/L exhibited severe malformations including larvae with body arcuation deformity, tail deformity, larvae with tissue ulceration, pericardial edema, yolk-sac edema, unhatching matured larvae when compared with control for 96 h.
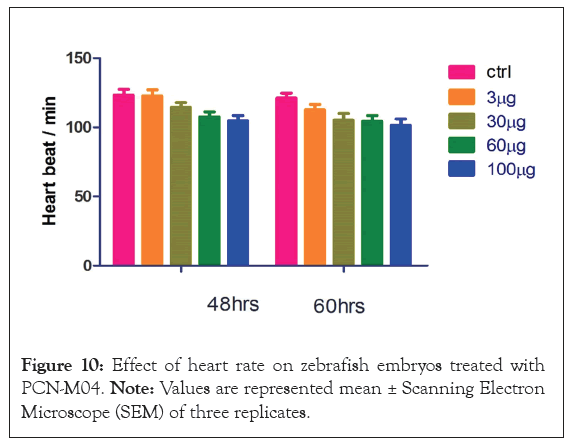
Figure 10: Effect of heart rate on zebrafish embryos treated with PCN-M04. Note: Values are represented mean ± Scanning Electron Microscope (SEM) of three replicates.
Morphological analysis
The ultra-structural images of PCN-M04, Figure 11, shows spherical shape particles although appeared to be little aggregated.
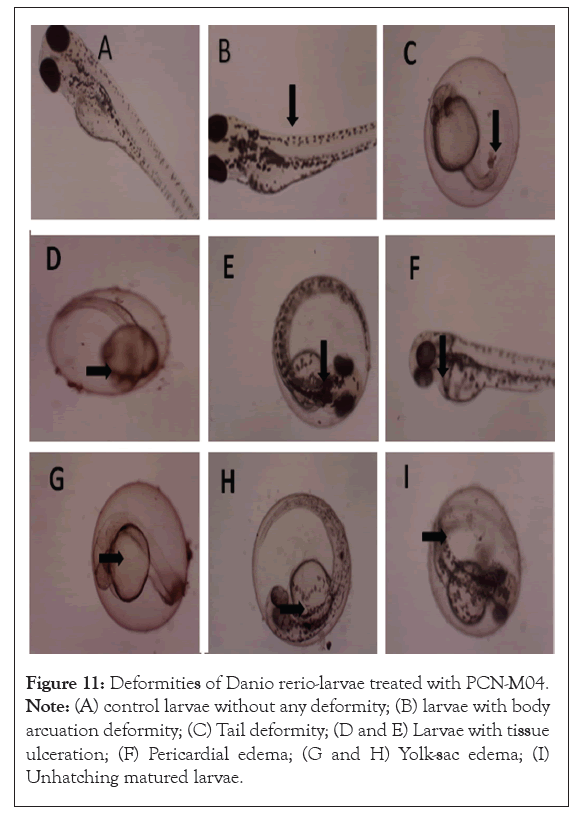
Figure 11: Deformities of Danio rerio-larvae treated with PCN-M04. Note: (A) control larvae without any deformity; (B) larvae with body arcuation deformity; (C) Tail deformity; (D and E) Larvae with tissue ulceration; (F) Pericardial edema; (G and H) Yolk-sac edema; (I) Unhatching matured larvae.
Mass spectrometry and tandem mass spectrometry were applied to estimate the composition and purity of peptide synthesis [23]. Protein identification is a process which has come to known that open source software (X! Tandem) could match tandem mass spectra through peptide sequences. The evaluations of peptide HIF9 purity by mass spectra revealed that peptide HIF9 possess 97% of purity. FT-IR techniques assist to point out the implication of the different functional groups of guest and host molecules by analysing the significant changes occurred in the shape and position of the absorbance bands [24].
The Flory-Huggins theory stated that the intermolecular hydrogen bonding in PCN was due to the strong interaction of hetero atoms and the carbonyl of amide (C=O---HO). The spectrum of SPN was observed in the peak range of 1400 cm-1-1600 cm-1 but, the peak broadening was not appreciable as compared to PCN. Hence, it might be suspected as very weak interaction (Van der Waals interactions) between the groups, possibly due to lack of electro negativity. Chitosan bounds with peptide by intermolecular hydrogen bond and it was found to be the best compatible polymer.
The present work emphasized that peptide and polymer ratio (1:4.0 w/w) showed high yield than other peptide polymer ratios, due to greater carbon efficiency. Interestingly, the association and loading efficiencies of formulations increased with an increasing in peptide polymer ratio (1:4.0). The greater association and loading efficiencies were due to reduced pH (6.5) in experimental condition. Hence, the positively charged chitosan (pKa~ 6.5) might depict greater attraction with negatively charged HIF9 peptide [25].
The Derjaguin and Landau, Verwey and Overbeek (DLVO) theory states that “stability of particle in the dispersion depends on the balance between attractive and repulsive forces among the particles” [26]. Hence, the particles with PDI<0.5 are considerably stable; lesser agglomeration and travel faster in the circulatory system. Evidently, the cancer cell surfaces are usually negatively charged due to translocation of negatively charged constituents in the inner layer of cell membrane such as phosphatidylserine, anionic phospholipids, glycoproteins and proteoglycans. Owing to the negative charges in the inner layer of cell membrane, tumor vasculature might have potentiated the electrostatic interaction between positively charged nanoparticles and negatively charged tumor cells of nanoparticles. This might be responsible for the tumor-specific accumulation of PCN. In addition, the positively charged nanoparticles were retained for a longer time span in the tumor site when compared to negative or neutral particles. Since phosphatidyl serine is a negatively charge residue, it gets translocated to the surface of cancer cells. These amendments are exactly matched with of PCN-M04 zeta potential and particles size analysis [27].
The PCN-M04 showed that increased Accumulated Efficiency (AE) was inversely proportional to the peptide release. Further, the study also revealed that there is no ‘burst’ effect in both plasma simulation and membrane dialysis methods of in vitro release which assured that the formulations were not weakly bound. All the peptide HIF9 and chitosan nano formulations (PCN-M01-M05) were obey Higuchi diffusion. Preponderance release of peptide is accommodated by diffusion. There was no effect persisted in Higuchi diffusion-driven released into the matrix and it may be due to the rate of solubility of chitosan exerted an influence in the release of peptide.
The ultra-structural analysis indicates that the incorporation of peptide as a solid structure contributed to the enhancement of morphology of nanoparticles. Further, there was no shearing on the surface of PCN-M04 due to the formation of inter molecular hydrogen bonding in multiple regions. The results of hemolysis at higher concentration of PCN-M04 treatment perhaps owing to the reason might be because chitosan interacts with the negatively charged membrane of erythrocytes by electrostatic attraction and triggers thrombus formation. It is believed that movements of nanoparticles are fast when compared to macro molecules and reached the tissue compartment from central compartment within 60 min [28]. Vascular leakage might also facilitate the nanoparticles entry into the tumor micro environment.
This study revealed that PCN-M04 could result in developmental toxicity, induced oxidative stress in the early stages of zebrafish development associated with serve abnormalities including yolk sac edema, tail tip, tissue ulceration, pericardial edema could be induced in zebrafish embryos after exposure to PCN-M04.To assess the potential impact and mechanism underlying the toxicity of PCN-M04 to zebrafish, embryo/larva assay including survival, hatching, heart beat rate malformation were employed. Large dose of nanoparticles might drive toxic amounts of thermal energy which could lead to lethality to embryos. Similar to the cancer cells de novo lipogenesis is normally adopting anaerobic metabolism. Large dose of nanoparticles might drive toxic amounts of thermal energy which could lead to lethality to embryos [29].
In conclusion, from this researchers successfully created and characterized Peptide Chitosan Nanoparticles (PCN), evaluating parameters such as efficiency, zeta potential, Poly Dispersity Index (PdI), morphology and zebrafish embryos toxicity assay. The optimal formulation, PCN-M04, exhibited a spherical shape, low hemolytic activity and no genotoxicity. Notably, PCN-M04 demonstrated intrinsic plasma stability for over 50 min, making it an effective solution to medication delivery. The nanoparticles physiochemical properties, including size, morphology and surface charge are suitable for effectively delivering the loaded drug to its targeted site. While further validation studies are ongoing, the results suggest that PCN-M04 nanoparticles hold potential as a drug delivery system.
[Crossref] [Google Scholar] [PubMed]
[Crossref] [Google Scholar] [PubMed]
[Crossref] [Google Scholar] [PubMed]
[Crossref] [Google Scholar] [PubMed]
[Crossref] [Google Scholar] [PubMed]
[Crossref] [Google Scholar] [PubMed]
[Crossref] [Google Scholar] [PubMed]
[Crossref] [Google Scholar] [PubMed]
[Google Scholar] [PubMed]
[Crossref] [Google Scholar] [PubMed]
[Crossref] [Google Scholar] [PubMed]
[Crossref] [Google Scholar] [PubMed]
[Crossref] [Google Scholar] [PubMed]
[Crossref] [Google Scholar] [PubMed]
[Crossref] [Google Scholar] [PubMed]
[Crossref] [Google Scholar] [PubMed]
[Google Scholar] [PubMed]
Citation: Manimaran D, Palanisamy V (2024). Synthesis, Characterization and Potential Studies of Peptide Loaded Chitosan Coated (PLCC) and Sodium Alginate (SA) Nanoparticles. J Clin Chem Lab Med. 7:291.
Received: 26-Aug-2024, Manuscript No. JCCLM-24-32875; Editor assigned: 28-Aug-2024, Pre QC No. JCCLM-24-32875 (PQ); Reviewed: 12-Sep-2024, QC No. JCCLM-24-32875; Revised: 19-Sep-2024, Manuscript No. JCCLM-24-32875 (R); Published: 26-Sep-2024 , DOI: 10.35248/2736-6588.24.7.291
Copyright: © 2024 Manimaran D, et al. This is an open-access article distributed under the terms of the Creative Commons Attribution License, which permits unrestricted use, distribution and reproduction in any medium, provided the original author and source are credited.