Journal of Aeronautics & Aerospace Engineering
Open Access
ISSN: 2168-9792
ISSN: 2168-9792
Research - (2024)Volume 13, Issue 3
Inerting of the aircraft fuel tank is performed to reduce the oxygen concentration in the ullage to a safe limit (9% for military aircraft and 12% for commercial aircraft) such that the overall flammability of the tank is reduced. Conventionally, nitrogen generated by an on-board Air Separation Module (ASM) based on selective permeation is used to displace the oxygen in the ullage. We have investigated a different approach comprising an Electrochemical Gas Separation and Inerting System (EGSIS) to produce Nitrogen-Enriched Air (NEA) for fuel tank inerting. EGSIS employs a Polymer Electrolyte Membrane (PEM) fuel cell cathode in combination with a PEM electrolyzer anode such that oxygen from the inlet air is reduced to produce NEA at the cathode outlet, and water is dissociated to produce oxygen at the anode outlet. This paper presents a technoeconomic analysis of EGSIS as an on-board inert gas generation system for aircraft by considering both capital and operating expenses. This study reveals that EGSIS is more cost-effective as an ASM for aircraft fuel tank inerting than incumbent hollow fiber membrane systems.
Electrolyzer; Fuel cell; Gas separation; Nitrogen-enriched air; Capital cost; Operating cost
Following investigations, the National Transportation Safety Board concluded that the TWA flight 800 disaster in July 1996 was probably due to an explosion of the fuel tank caused by ignition of the combustible fuel-air mixture in the tank ullage (volume of air above the fuel level in the tank) [1]. Subsequently, the US Federal Aviation Administration proposed a rule to minimize the formation of flammable vapors in the fuel tank [2]. Ullage flammability can be reduced by the process of fuel tank inerting in which an inert gas is dispensed to the ullage to lower its oxygen concentration. The safety level for the ullage oxygen concentration is 9% for military aircraft and 12% for commercial aircraft [3].
Oxygen concentration in the fuel tank ullage can be lowered using Nitrogen-Enriched Air (NEA) through ullage washing and fuel scrubbing. During ullage washing, NEA is directly introduced in the empty space of the fuel tank to sweep away oxygen and flammable fuel vapor evolved over time. During fuel scrubbing, NEA is injected into the fuel in the form of small bubbles to carry away dissolved oxygen [4,5]. Since the ullage volume increases as fuel is consumed, the NEA demand is greater towards the later stages of flight. Even if the ullage oxygen concentration is below the prescribed level at a given time, dissolved oxygen can continue to enter the ullage as the fuel is agitated due to turbulence for example, and hence, NEA must be supplied continuously. The effectiveness of ullage washing is higher than that of fuel scrubbing [6].
Inerting can be carried out before flight takeoff using ground-based systems, or during the flight using onboard liquid nitrogen or by using an On-Board Inert Gas Generation System (OBIGGS) [7]. Ground-based inerting involves the use of a fuel scrubber during aircraft refueling, or inerting the fuel while it is stored in tanks at the airport. Despite implementing ground-based inerting systems, additional amounts of inert gas may be needed during the flight to counter the influx of air into the tank ullage because of pressure changes and the evolution of dissolved oxygen from the fuel [7]. Ground-based inerting is not considered cost-effective due to high ground equipment costs and nonrecurring labor charges [8]. Hence, in-flight inerting is more effective. Liquid nitrogen systems are relatively light and simple, but they must be refilled between flights which introduces a logistical challenge. Additionally, these systems also necessitate a cryogenic nitrogen storage container which raises the aircraft’s weight and volume overhead [9,10]. Explosion suppressant foam is another option to suppress in-tank combustion and prevent destructive overpressures. However, suppressant foam adds significant weight, reduces fuel volume, accumulates static charge, and greatly complicates fuel tank maintenance [11]. Similarly, optical detector/extinguishment systems are also impractical because a large number of detectors would be required to completely cover multiple fuel tank compartments. Halon fuel tank fire protection systems are too expensive for full-time fire protection and can damage the ozone layer [6].
In conventional OBIGGS, NEA is produced when pressurized atmospheric air is passed through Air Separation Modules (ASM). Typically, the working principles of such modules are pressure swing adsorption, selective permeation through hollow fiber membranes, oxygen ionization with ceramic membranes, and cryogenic air separation, all of which separate nitrogen from oxygen to produce NEA.
Pressure swing adsorption
Pressure Swing Adsorption (PSA) is used to provide gas streams enriched with either oxygen or nitrogen. When air is passed through a bed of zeolite pellets or powder (Na/Ca alumino-silicate) nitrogen from the air is adsorbed by the zeolitic surface under high pressure, and the output gas is nearly free of nitrogen. However, when the pressure is decreased during the purge step, the desorbed nitrogen can be released for further use [12]. Thus, pressure swings from high to low cause cyclic adsorption and desorption of nitrogen, respectively, giving oxygen as the output gas during the loading cycle and nitrogen during the purge cycle. PSA requires a large amount of pressurized air, although the ratio of NEA to inlet air is between 10%-20%, and the lack of a storage system implies that it must be large enough to provide the maximum required NEA rate, resulting in higher system weight [13].
Hollow fiber membrane
Hollow fibers comprised of polymers are formed by asymmetric solution spinning and bundled together to form membranes used within ASMs to provide selective permeation with high efficiency. When air moves down the Hollow Fiber Membrane (HFM), the pressure difference between the inside and the outside causes oxygen to permeate more rapidly through the walls than nitrogen, and hence the retentate gas has substantially lower oxygen concentration [14-16]. In contrast to PSA, HFM is used exclusively to produce NEA from air. The process is costly and complex as compared to PSA for separating oxygen from the air. HFM systems provide their best performance at inlet air pressures around 7 atm which is much higher than typical bleed air pressures. Nonetheless, for commonly available bleed air pressures of around 2 atm, the ratio of NEA to inlet air flow is between 25%-30% [13]. Just like PSA, HFM also requires pretreated and high-pressure inlet air.
Ceramic membranes
This process separates oxygen from the air through catalytic ionization of oxygen at high temperature (700℃) with the help of specialized ceramic materials. The advantages over other separating technologies are that ceramic membranes are insensitive to supply air contaminants and one can easily detect the failure of the ceramic membrane by the fall-off in the output oxygen pressure which is otherwise around 2000 psia [13]. The efficiency of such membranes is affected by the electrolyte constituents, the membrane geometry, operating conditions and the supply airflow design and heat transfer [17].
Cryogenic air separation
Cryogenic air separation techniques produce oxygen or NEA either in liquid or gaseous state through refrigeration and distillation of air, where the separation process is facilitated by the difference in the boiling points of nitrogen and oxygen [18]. Due to recent developments in miniaturized high-speed turbomachinery, distillation columns for oxygen and nitrogen, and high-efficiency thermal recovery devices, cryogenic processes are also gaining popularity in aircraft systems [13]. However, these systems are complex and costly.
Electrochemical gas separation and inerting system
All the techniques listed above have an added disadvantage when used as ASMs for aircraft–a fixed NEA generation rate. However, aircraft fuel tanks demand inerting at different rates based on the ullage volume. During takeoff and cruise phase, a low flow of NEA is sufficient due to low ullage volume whereas a higher flow of NEA is required during the descent as the ullage volume grows [9]. Hence, the size of the ASM is controlled by the maximum required NEA flowrate which makes the system large and heavy [16]. A conventional ASM lacks the feature to easily vary the NEA production rate.
An Electrochemical Gas Separation and Inerting System (EGSIS) is an electrically powered device that integrates a Polymer Electrolyte Membrane (PEM) fuel cell cathode with an electrolyzer anode [19-21]. EGSIS converts atmospheric air to NEA at the cathode by the Oxygen Reduction Reaction (ORR) whereas water is converted to oxygen by the Oxygen Evolution Reaction (OER) at the anode. Basically, EGSIS is an ASM that produces NEA and oxygen at the cathode and anode outlet respectively. The chemical reactions involved in an EGSIS for an acidic membrane consisting of a Perfluorosulfonic Acid (PFSA) ionomer are:


Although the schematic in Figure 1, shows a system with a single cell, a practical EGSIS ASM would consist of multiple cells in a stack as depicted in our previous work [22,23]. The advantage of such an electrochemical system is that lends itself to modularization and scale-up can be easily accomplished for any NEA production range. Additionally, the NEA production rate can be easily varied just by controlling the voltage applied to the system. EGSIS can be designed considering the lower NEA flow requirements during the early phases of the flight, and when the NEA requirement increases during descent, the voltage can be ramped up to increase production. Thus, the system weight and cost can be minimized. Furthermore, EGSIS operates at atmospheric pressure unlike current ASMs used in aircraft, which eliminates the use of bleed air or a compressor thereby reducing fuel consumption during flight.
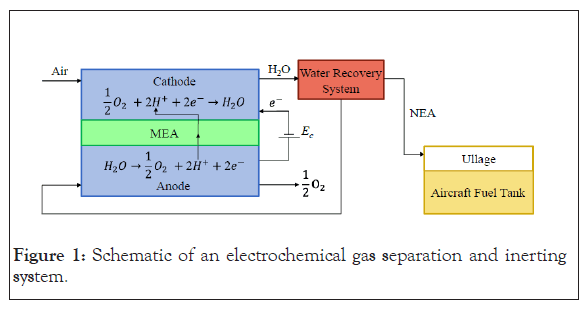
Figure 1: Schematic of an electrochemical gas separation and inerting system.
A technoeconomic analysis is performed to compare hollow fiber membrane systems that are currently used for NEA generation in aircraft with EGSIS. We begin with a thermodynamic and kinetic analysis, followed by an economic analysis. The analysis considers several parameters including the EGSIS cell performance, input power required, aviation fuel usage, fuel cost, and Equivalent Annual Cost (EAC). Since EGSIS is still an evolving technology, we first adopted performance metrics for a base case scenario based on experimental results obtained in our lab. We then extrapolated from lab-built to market-built by anticipating an optimization in overall EGSIS stack weight and capital cost. EGSIS does not require bleed air from the aircraft engine, therefore a direct comparison is made with the incumbent technology utilized in a bleedless aircraft like the Boeing 787 Dreamliner. A further comparison is also made with a bleed air system without considering the associated cost and weight of the heat exchanger and other related piping network and its effect on fuel consumption. However, in general a bleedless system will weigh less and have reduced fuel usage [24]. Various modules of the SEPURAN® nitrogen generation system are considered here to represent HFM systems. The NEA flow requirement has been divided into two regimes according to the flight time: (1) Average flow requirement (230 slpm NEA) for the first 75% of the flight duration; (2) Maximum flow requirement (524 slpm NEA) for the remaining 25% [25]. The water supply required for the EGSIS anode is assumed to be fully recycled from the cathode exhaust.
Thermodynamic and kinetic analysis
The following analysis involves calculating the required EGSIS air supply, and the power consumed to produce the desired flowrate of NEA. A similar analysis for the power required to compress atmospheric air to the required pressure has been conducted for the HFM systems.
Current density requirement: The current density required to fulfill the NEA demand can be calculated as a function of the number of cells in the stack as [19]:


Where, CDa (A/cm2) is the current density required for the average NEA generation rate NEAa = 230(slpm), CDm(A/cm2) is the current density required for the maximum NEA generation rate NEAa = 524(slpm), F (C/mol) is the Faraday constant, xO2 ,air is the mole fraction of oxygen in atmospheric air, N is the number of cells in the stack, Acell is the active area of one cell, and is the stoichiometric coefficient. λ can be obtained for a specified oxygen concentration in the NEA ( xO2 ,NEA ) as:

Power requirements: The average ( Pa ) and maximum ( Pm ) electrical power (kW) required by EGSIS to produce the desired flowrate of NEA can be calculated as:


Where, Va and Vm are the average and maximum voltages at which CDa and CDm can be achieved to produce the average and maximum NEA flowrates, respectively. Equations 6 and 7 reveal that the electrical power is not a function of the number of cells in the stack, but of the voltage applied to the system. One assumption made in the present analysis based on the experimental results from our previous study is that the maximum current density can be achieved when the EGSIS voltage is increased from Va to Vm as [19]:
Vm = Va + 0.2 …. (8)
Likewise, for SEPURAN® modules, the compressor power CP (kW) required to compress an ideal gas to an elevated pressure can be calculated as:


Where, k is the heat capacity ratio, R(J/mol.K) is the universal gas constant, T(K) is the temperature, P2/P1 is the pressure ratio, Qair,HFM,a and Qair,HFM,m (slpm) are the air flowrates required by the HFM module to produce a NEA and m NEA , respectively, and com η is the efficiency of the compressor taken as 0.72 here.
Economic analysis
In this section, the EGSIS technology is analyzed from an economic perspective. The metrics used in this analysis are capital costs, fuel cost due to the added weight of the system, power usage by EGSIS, compressor power for SEPURAN®, and finally equivalent annual costs.
System weight: The weight of the laboratory EGSIS was estimated based on our previous work and then extrapolated to a full-scale commercial system by considering a weight reduction of 30% which is justified by the selection of lighter materials such as carbon paper GDE instead of carbon cloth used in our lab-built system and thinner membranes [19,20]. Table 1, species the specific masses of the various components that comprise the MEA.
| Component | Specific mass (g/m2) |
|---|---|
| Membrane | 100 |
| Iridium oxide | 30 [19,20] |
| Ionomer for anode | 6 [19,20] |
| Titanium mesh for anode | 80 |
| Gas diffusion electrode for cathode | 175 |
| Total MEA specific mass | 391 |
Table 1: Specific mass of various MEA components.
The total MEA mass of the lab-built system is obtained by multiplying the specific mass by the total membrane area required for NEA production, and then reduced by 30% to obtain the total MEA mass of the market-built EGSIS. Finally, the full stack weight is obtained by noting that the MEA comprises 8% of the total stack weight [26].
Likewise, the weight of the SEPURAN® system is calculated by determining the number of modules required to produce the maximum NEA demand, and then multiplying the weight of each module by the number of required modules. Additionally, for a bleedless aircraft, the weight of the compressor required to deliver the maximum pressure should also be added to determine the total weight of the system.
Capital cost: The capital cost for EGSIS is calculated by considering a PEM electrolyzer system of equivalent stack size since the components and architectures for both systems are very similar. Additionally, the targeted lifetime of EGSIS is similar to that of electrolyzers which is higher than fuel cells. The electrical power (kw) of the electrolyzer stack is calculated as:

Where, N is the number of cells in the stack, Acell (cm2) is the cell area, iref is the reference current density taken as 1 A/cm2, and Vref is the reference voltage taken as 1.7 V [27]. Then the capital cost ($) is determined for the lab-built system as [28]:

Similarly, the capital cost for the market-built s stem is calculated b considering DOE’s electrolyzer capital cost target of $300 per Kw consumed as [29]:

However, the capital cost of the HFM systems is not considered in this study due to a lack of pricing data.
Fuel usage: The ultimate goal of this study is to determine whether EGSIS can be implemented cost-effectively in an actual aircraft as an air separation module for fuel tank inerting. The operating cost (fuel usage) is determined by the amount of fuel consumed to produce electrical power for EGSIS or compressor power for the HFM system in a bleedless aircraft, as well as the fuel consumption due to the added weight of each system. For bleed aircraft, we will need to consider the added fuel penalty to supply bleed air.
The annual fuel consumption FCpower (kg) for electric power production for EGSIS can be calculated as:

Where, Fspecific (0.35 kg/kWh) is the specific fuel consumption, Pa and Pm are the average and the maximum powers required for EGSIS operation, respectively, and Ta and Tm are the total hours of operation in one year at the average and maximum flow conditions, respectively [30].
Likewise, the annual fuel consumption FCpower (kg) for the HFM system’s compressor power can be calculated as:

Where, CPa and CPm are the compressor powers required for the average and maximum flow conditions, respectively.
Similarly, the annual fuel consumption FCweight (kg) due to added weight can be determined as:

Where, Fw (0.035/hr) is the mass in kg of fuel combusted per hour to carry 1 kg of added weight, and Weightadded is the weight of the system (either EGSIS or HFM plus compressor) [31].
The total annual fuel cost can be obtained by multiplying the total annual fuel consumption by the fuel price as:

Where, Fc ($1.3944/kg) is the cost of aviation fuel [32].
Next, the annual added fuel consumption (kg) due to the bleed air penalty can be calculated for bleed aircraft as:

Where, FB (0.028) is the specific bleed air penalty, and Weightbleed air,a and Weightbleed air,m are the weights (kg/hr) of bleed air required to produce the average and maximum NEA flowrates, respectively [33].
Then, the total annual fuel cost to operate the HFM system for bleed aircraft is:

Equivalent annual cost: Equivalent Annual Cost (EAC) is the cost of owning and operating an equipment over its lifetime. The only operation cost considered in this study is fuel cost and any maintenance cost is neglected.

Where, ROR is the rate of return and L (years) is the system lifetime.
The thermodynamic and kinetic analysis presented in materials and methods is used to calculate the current density required as a function of the number of cells for NEA95 (5% O2 concentration in the NEA). Next, the electrical power required by EGSIS is compared with the HFM compressor power for a bleedless aircraft for average and maximum NEA flow conditions. Then, the economic analysis is performed first by calculating the capital cost of the EGSIS system as a function of stack size. Additionally, the annual fuel usage cost is calculated which is used as the basis for comparison across the various modules and technologies. Finally, EAC was calculated for EGSIS systems only as the capital cost data was not available for HFM systems.
HFM system (bleedless operation)
Six different SEPURAN® HFM systems including 6” selective, 6” membrane cartridge, 4” short module, 6” selective (HP), 6” membrane cartridge (HP) and 4” short module (HP) are compared on the basis of operating pressure, number of modules required, module weight, and total system weight as summarized in Table 2. The minimum outer diameter for 6” selective and 6” membrane cartridge system is 6.6 inches (168 mm) whereas it is 4.1 inches (104 mm) for the 4” short module. The short module is cast in place whereas the other modules are assembled with cartridges in a housing. The difference between the 6” selective and 6” membrane cartridge system is that the polymer for the former is specially tailored for energy efficient nitrogen generation. HP refers to high pressure HFM modules (10 vs. 5.3 barg).
| 6” Selective | 6” Membrane cartridge | 4” Short module | 6” Selective (HP) | 6” Membrane cartridge (HP) | 4” Short module (HP) | ||
|---|---|---|---|---|---|---|---|
| Pressure (barg) [37] | 5.3 | 5.3 | 5.3 | 10 | 10 | 10 | |
| Air to NEA ratio [37] | 2.3 | 2.9 | 2.9 | 2.6 | 2.6 | 2.6 | |
| No. of modules | 2 | 1 | 4 | 1 | 1 | 2 | |
| Total module weight (kg) [37] | 72 | 35 | 40 | 36 | 35 | 20 | |
| Compressor weight (kg) [38] | 510 | 510 | 510 | 510 | 510 | 510 | |
| Total system weight (kg) | 582 | 545 | 550 | 546 | 545 | 530 | |
Table 2: Metrics for various SEPURAN® HFM modules.
Table 2, shows that all the HFM systems require air supply at elevated pressures: 5.3 and 10 (barg) for the regular and high-pressure systems, respectively. Unlike EGSIS, HFM demands the use of a heavy compressor. In fact, the total HFM system weight is dominated by the compressor weight.
Similarly, the airflow required to operate at average and maximum flow conditions is calculated by multiplying the required NEA flow rates by the air/NEA ratio. The air/NEA ratio decreases as the pressure increases because oxygen permeates at a higher rate through the hollow fiber walls when the pressure differential across the wall is greater as dictated by Henry’s law and Fick’s law. Hence, Figure 2, shows that a lower airflow is required for the High Pressure (HP) counterparts for each HFM module.
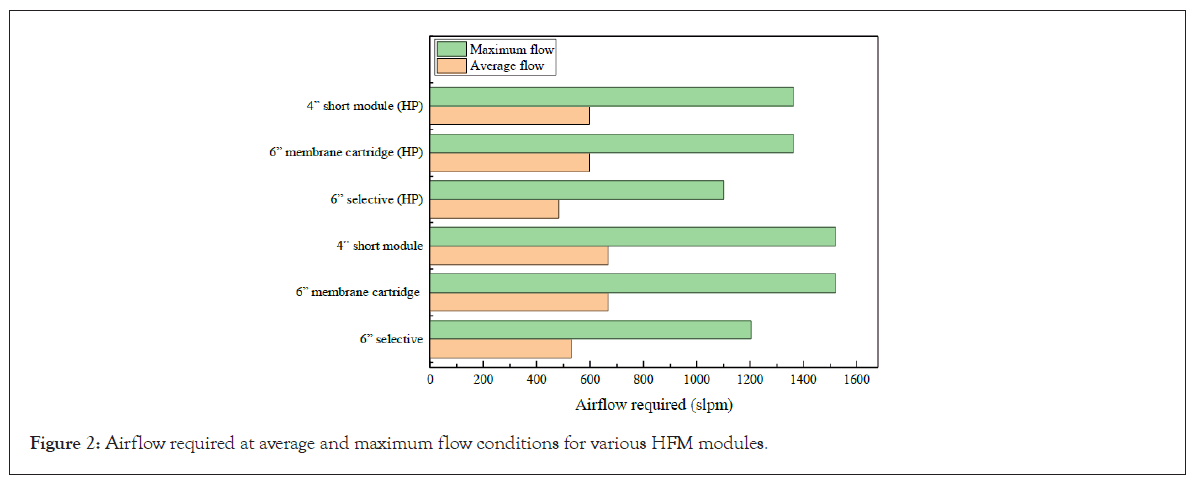
Figure 2: Airflow required at average and maximum flow conditions for various HFM modules.
Next, the compressor powers for average and maximum flow conditions are calculated through equation 9 and 10 respectively and plotted in Figure 3. The SEPURAN® 6” membrane cartridge and 4” short module (HP) require the highest power, and the lowest power requirement is for the 6” selective system.
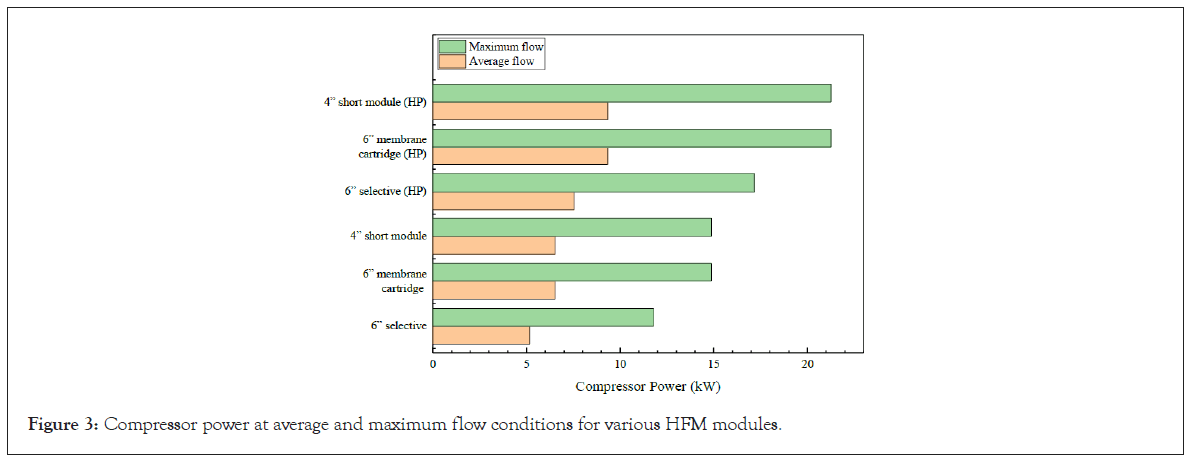
Figure 3: Compressor power at average and maximum flow conditions for various HFM modules.
Finally, the annual fuel cost has been divided into the cost due to the HFM compressor power, added HFM module weight, and HFM compressor weight in Figure 4. It is seen that the fuel cost is dominated by the added compressor weight–4.5 times as high as the combined fuel consumption due to added HFM weight and compressor power.
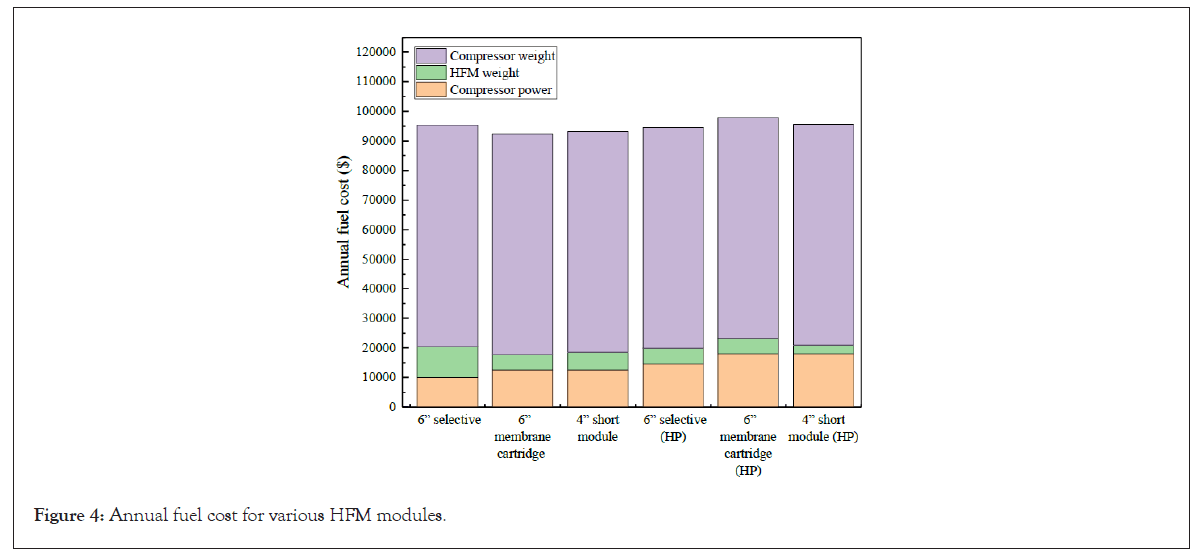
Figure 4: Annual fuel cost for various HFM modules.
HFM system–bleedless vs. bleed air
In this section, we compare bleedless and engine bleed air HFM modules. Usually, bleed air is delivered at higher temperatures (200°C) as compared to the HFM requirement of 70°C, therefore an HFM system based on engine bleed air requires a sizable cooling system. Here, we ignore any disadvantage that one system might have compared to the other in terms of added compressor weight (for the bleedless system) or added heat exchanger weight (for the bleed air system) for two reasons. First, there is a lack of information regarding the heat exchanger system used for bleed aircraft, and second, the added weight of the compressor alone would dominate the total fuel usage for bleedless aircraft which would not provide a meaningful comparison between the two systems. The power required to compress the air is different for the bleedless and bleed air operation due to their different air temperatures. Additionally, the bleed air operation incurs a fuel penalty as given by equation 14. The annual fuel costs for the bleedless vs. bleed air operations for the SEPURAN® N2 6” membrane cartridge (HP) system are summarized in Table 3.
| Bleedless operation | Bleed air operation | |
|---|---|---|
| Temperature (°C) | 70 | 194 [13] |
| Average compressor power (Kw) | 9.3 | 12.7 |
| Maximum compressor power (Kw) | 21.2 | 28.9 |
| Annual fuel consumption due to HFM weight ($) | 5,124.4 | 5,124.4 |
| Annual fuel consumption due to compressor power ($) | 18,016.4 | 24,529.6 |
| Annual fuel consumption due to bleed air penalty ($) | 0 | 6,793.4 |
| Total fuel cost for HFM system only ($) | 23,140.8 | 36,447.4 |
Table 3: Bleedless vs. bleed air operating costs for the SEPURAN® N2 6” membrane cartridge (HP) HFM system. Added weight effects of compressor/heat exchanger are not considered.
The use of engine bleed air as the inlet to the HFM not only incurs the bleed air penalty but also requires higher compressor power owing to the higher temperature of the bleed air. As stated earlier, the high temperature bleed air must be cooled by a heat exchanger before it enters the HFM, however, the added heat exchanger weight is not considered in the above analysis. The added weights of compressor or the heat exchanger system would contribute significantly to annual cost as shown by Figure 4.
EGSIS system
The analysis in this section has been carried out in terms of the number of cells in the EGSIS stack. Each cell in the stack is considered to have an active area of 680 cm2. An important parameter is the current density required to generate average and maximum NEA flow rates. The upper graph in Figure 5, represents the variation in average and maximum current density with increasing cell number. For the extreme case of a stack comprising just a single cell, the average and maximum current densities required are 19.7 and 44.8 A/cm2, respectively, which is unrealistic. Hence, the lower graph has an expanded vertical axis scale to highlight data for stack size greater than 25 cells. The average and maximum current densities decrease from 0.79 and 1.79 to 0.08 and 0.18 A/cm2, respectively, when going from 25 to 250 cells. The current density begins to plateau beyond 100 cells.
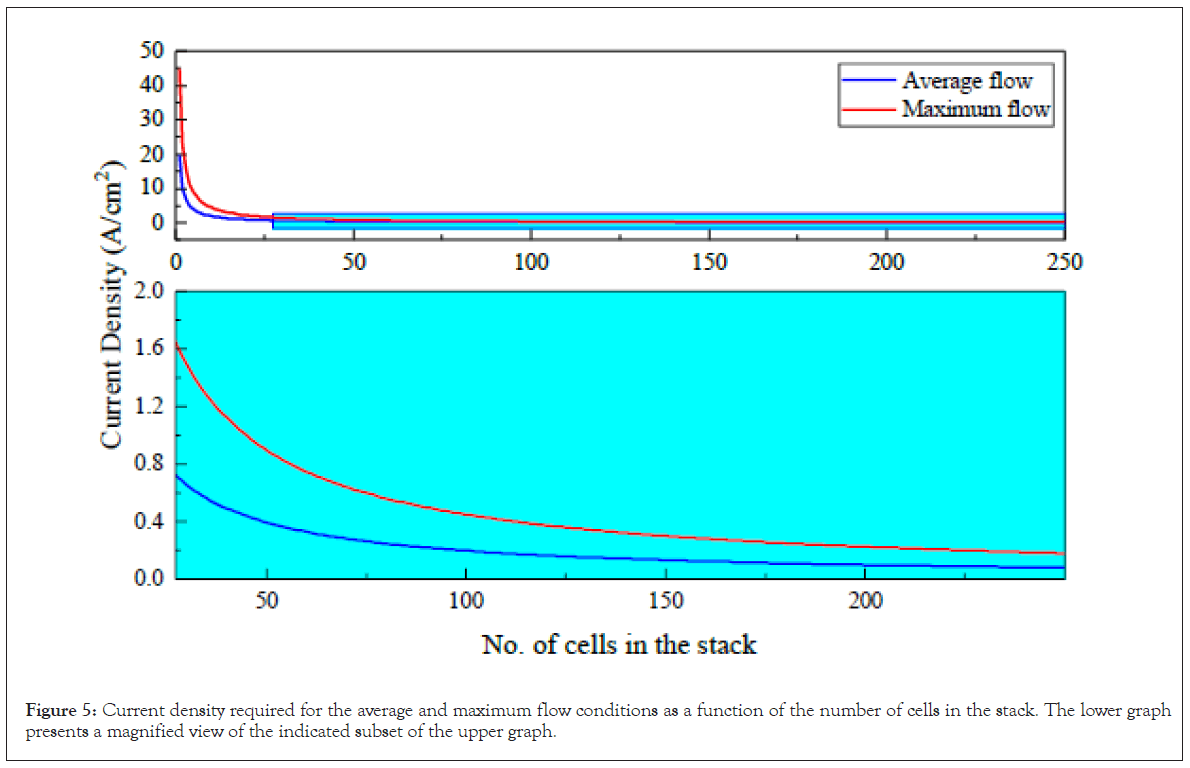
Figure 5: Current density required for the average and maximum flow conditions as a function of the number of cells in the stack. The lower graph presents a magnified view of the indicated subset of the upper graph.
Similarly, the electrical power required for EGSIS operation is calculated from equation 5 and plotted in Figure 6. As mentioned in power requirements, the electrical power is a function of the applied voltage. The electrical power increases with voltage, however, the slope for the maximum operation condition is steeper than that for the average operation. The electrical power required by EGSIS at lower voltages is comparable to the compressor power required by HFM systems. Hence, a future goal should be to decrease the required voltage, either by developing better catalysts with lower overpotential losses, or by using more cells in the stack to reduce the current density as suggested by Figure 5.
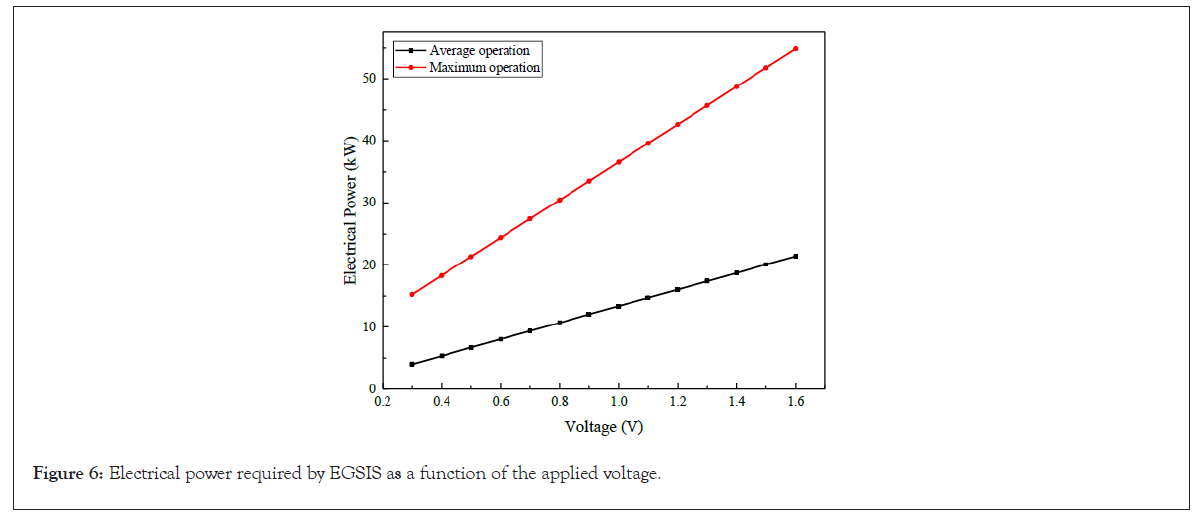
Figure 6: Electrical power required by EGSIS as a function of the applied voltage.
Next, the weight and capital cost of the EGSIS stack as determined in power requirements and capital cost are plotted in Figure 7. As expected, the stack weight and cost increase linearly with the number of cells. Although the power requirement for the EGSIS stack drops as the number of cells increases, the stack weight and capital cost will scale with stack size. This trade-off presents an interesting optimization problem, which will be discussed later.
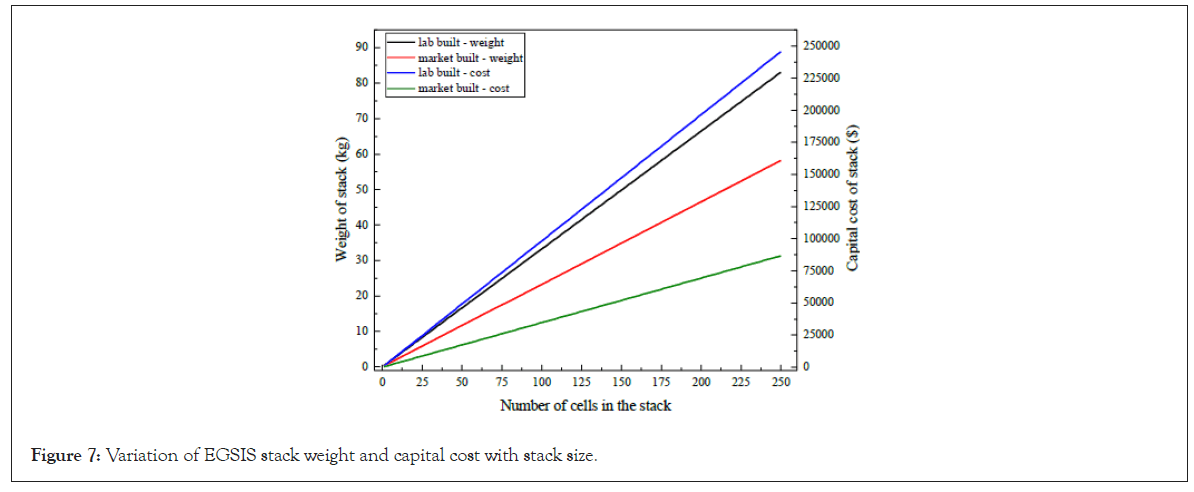
Figure 7: Variation of EGSIS stack weight and capital cost with stack size.
Additionally, the annual fuel cost and equivalent annual cost for both the lab-built and market-built EGSIS are plotted as heat maps in Figure 8, as a function of both working voltage and stack size. The annual fuel consumption and EAC are calculated using equations 13 and 16, respectively. The stack size primarily affects the capital cost and the fuel usage due to added weight, whereas the working voltage affects the fuel cost due to electric power consumption. Figure 8, shows that lowest cost is incurred at the lowest voltage and smallest stack size. However, such a combination of low voltage and small stack size results in current density values that are physically impossible to achieve. It can be observed that for a particular voltage the annual fuel cost and EAC increases with the stack size. Similarly, these costs also increase with voltage for a particular stack size. The current density remains excessively high even when the voltage is increased for a small stack. However, the current density approaches the achievable range even at low voltages for a larger stack size. The working range corresponding to the optimal operating condition is represented by the oval region in the heat maps. The lower-left corner in the heat map falls out of the feasible zone due to an impossibly high current density demand, and the top-right corner is not operationally suitable as the cost is excessive. The oval region indicates the combination of voltage and cell size where EGSIS could be operated–small voltage/large stack, medium voltage/medium stack, and large voltage/small stack. Figure 8 also shows that the annual fuel cost and the EAC of the market-built EGSIS is lower than that of the lab-built system although they both consume the same power due to the lower weight of the former. Comparing the annual fuel cost of EGSIS with the HFM annual cost for bleedless aircraft in Figure 4, we can conclude that although the electrical power requirements of EGSIS may be higher, it is actually more cost-effective to use EGSIS as an air separating module for aircraft NEA production. The ability of EGSIS to operate at standard pressure allows the system to bypass the use of large compressors or engine bleed air.
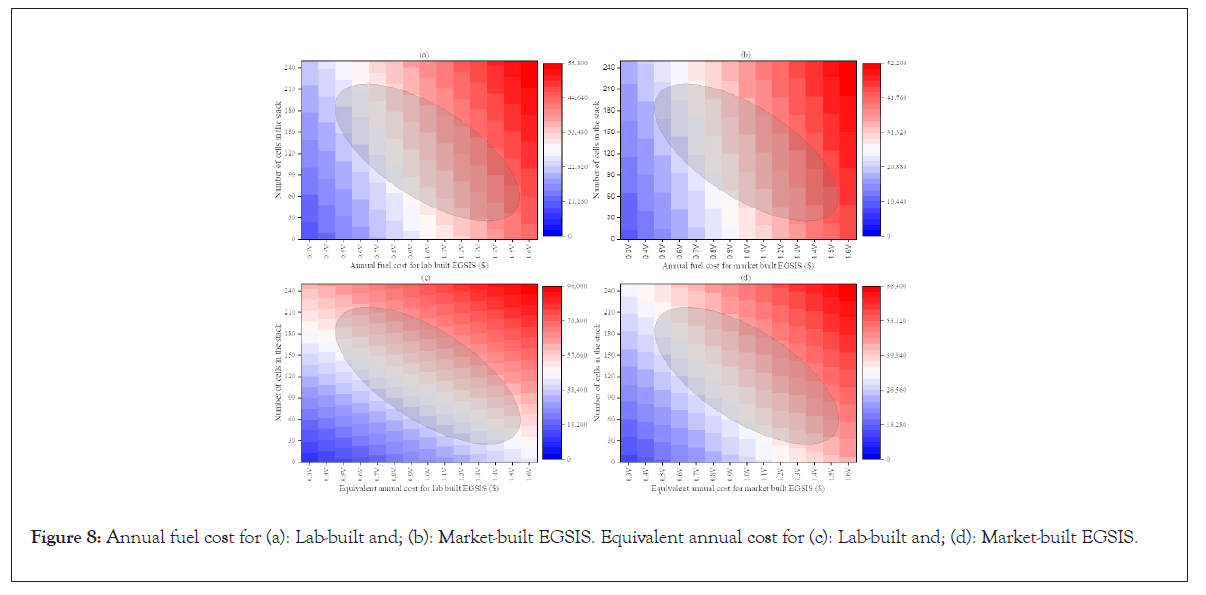
Figure 8: Annual fuel cost for (a): Lab-built and; (b): Market-built EGSIS. Equivalent annual cost for (c): Lab-built and; (d): Market-built EGSIS.
Furthermore, the annual fuel cost and EAC for market-built EGSIS is broken down for analysis in Table 4, according to the experimental data obtained in our previous work [19]. Table 4, considers three EGSIS stack sizes with 25, 85, and 225 cells. The table indicates that the most economic configuration is the 85-cell stack. If only the annual fuel cost is considered, it is more costeffective to deploy a stack with 225 cells than 25 cells; however, if we consider EAC which also includes the capital cost, the 25-cell stack is more economical than with 225 cells. However, the assumption that the maximum current density can be achieved by increasing the voltage by 0.2 V over the average current density might not always be practical. For a small stack size, the voltage increment might be larger, whereas even a smaller voltage increment might work for a larger stack.
| Number of cells in the stack | |||
|---|---|---|---|
| 25 | 85 | 225 | |
| Average current density (A/cm2) | 0.787 | 0.231 | 0.087 |
| Maximum current density (A/cm2) | 1.792 | 0.527 | 0.199 |
| Average voltage (V) | 1.4 | 0.9 | 0.8 |
| Annual fuel consumption ($) | 39,263 | 28,385 | 30,570 |
| EAC ($) | 40,674 | 33,183 | 43,269 |
Table 4: Annual fuel consumption and EAC for three EGSIS stack sizes.
Comparing the results in Figure 4 and Table 4, it is seen that the annual fuel consumption for EGSIS can be lower than for incumbent HFM technologies. Further improvements in catalyst activity and reductions in electrochemical overpotentials will result in additional reductions in EGSIS costs. However, it is vital to optimize the stack size as observed in Table 4. Even without considering the added weight of heat exchangers and associated piping network, EGSIS could be a viable option as compared to HFMs using bleed air as indicated by the results in Table 3 and 4.
Fuel cell as an inert gas generator
Aircraft design is undergoing a trend towards a “more electric aircraft,” therefore fuel cell systems represent a promising high-technology solution to enhance energy efficiency for both cruise and ground operations [34]. The oxygen reduction reaction occurring at the fuel cell cathode guarantees that NEA will be automatically produced at the cathode exhaust when air is supplied at the cathode inlet. Hence, if fuel cells are deployed for the power generation in future aircraft, they can also serve as an inert gas generator. The operating cost for inert gas generation alone will then be zero, as the NEA will just be a by-product of the power generation system. However, the stoichiometric coefficient of air required to produce NEA with sufficiently low oxygen concentration for inerting may be so low that mass transport losses will be exacerbated [35]. Hence, optimization will be crucial if a fuel cell is to be employed to also serve as an inert gas generator.
Technoeconomic analysis of any new technology is an essential first step before any replacement of incumbent technology can be considered. In this study, we have carried out the technoeconomic analysis of an electrochemical gas separation and inerting system as an air separation module for the generation of the NEA to inert aircraft fuel tanks. Two EGSISS builds–lab and market, have been compared with various SEPURAN® hollow fiber membrane modules in terms of fuel consumption and overall cost. We conclude that EGSIS is an economically superior alternative given its ability to accept unpressurized air input which eliminates the heavy external compressor required in bleedless aircraft, or the compressed engine bleed air penalty in bleed air systems. Although the electrical power required for EGSIS is higher than the compressor power required for technologies, the fuel consumption due to the added compressor weight for bleedless aircrafts, and engine bleed air penalty in bleed air systems is very high. The added weight of the heat exchanger system and its piping network will further increase the fuel cost for bleed air systems. This study reveals that EGSIS is a very promising alternative to incumbent air separation modules for fuel tan inerting in the aircraft industry.
This work was funded by a grant from the Rapid Advancement in Process Intensification Deployment (RAPID) Manufacturing Institute.
Citation: Prasad AK, Aryal UR (2024). Technoeconomic Analysis of an Electrochemical Gas Separation and Inerting System for Aircraft. J Aeronaut Aerospace Eng. 13:352.
Received: 09-Aug-2024, Manuscript No. JAAE-24-33430; Editor assigned: 12-Aug-2024, Pre QC No. JAAE-24-33430 (PQ); Reviewed: 27-Aug-2024, QC No. JAAE-24-33430; Revised: 03-Sep-2024, Manuscript No. JAAE-24-33430 (R); Published: 10-Sep-2024 , DOI: 10.35248/2168-9792.24.13.352
Copyright: © 2024 Prasad AK, et al. This is an open-access article distributed under the terms of the Creative Commons Attribution License, which permits unrestricted use, distribution, and reproduction in any medium, provided the original author and source are credited.