Journal of Agricultural Science and Food Research
Open Access
ISSN: 2593-9173
ISSN: 2593-9173
Research Article - (2018) Volume 9, Issue 1
This research was conducted in Amhara region located in the Gondar town specifically in Azezo Tekle Haymanot Kebele. The objective of the research to assess the cause of land use change and it effect of the change on crop yield. The research to collect both primary and secondary data was collected from sampling house hold. Household survey, field observation, questionnaire survey, and focus group discussion were used for primary data collection within 80 households were selected as sample household for interview based on simple random sampling. Secondary data were gathered from governmental organization, libraries, journals, and internet etc. A household sample was obtained using a simple random sampling technique; Information gather by interviews were conducted with community representatives, distract experts and development agents who worked in the community of Azezo Tekle Haymanot Kebele. The collected data were analyzed by using frequency, percentage, were used to analyze simple tables while to interpreting the result. The result shows that major 70.89% of in Azezo Tekle Haymanot Kebele land usage changed by infrastructure development and 13.92% of the cause of land usage changed by urban settlement expansion, 11.66% of land usage changed by building. In study area the declining agriculture productivity is due to above mentioned factors. Generally, in total farm land from the year 2002-2006 there is reduction land under farming, of 205 hectares in Azezo Tekle Haymanot Kebele farm land for infrastructure development, urban development like settlement explanation with a rate of change of 912 ha to reduced 825 ha per 4-year data. On the other hand, farm land cover reduced from 88 ha with a rate of land change. However, between urban expansion and agricultural land use change it effect on agricultural productivity of land scarcity or shortage and the community to give compensation money to change start off-farm opportunities.
Keywords: PA; DA; Key formats; Urbanization
In Ethiopia, where agriculture is the back bone of the economy (approximately 50% of GDP, 90% of foreign exchange earnings. It was estimated that half of the Ethiopian highlands arable lands are moderately to severely degraded and nutritionally deplete to over cultivation, over grazing, primitive production techniques, and over dependent on rainfall. Agriculture contributes more than 50% GDP, and peanut production and processing represent about 2% of GDP and 9% of exports. The peanut industry accounts for 70% of the rural labor force and 60% of household’s agricultural income. Policy changes in Ethiopia contributed to a national decline in consumption from 40 kg/ha in 1968 to 13.5 kg/ha in 1996-2000 [1].
Land-use change (LUC) is associated with large negative impacts on ecosystems observed at local, regional and global scales. High rates of water, soil and air pollution are the consequences of observed LULCC. Biodiversity is reduced when land is changed from a relatively undisturbed state to more intensive uses like farming, livestock grazing, selective tree harvesting, etc. [2]. Land-use change due to deforestation in the tropics was the major contributor to CO2 emissions in the 1990s, which averaged between 0.5 and 2.7 rigatoni of carbon per year (UNFCCC 2007). These changes alter ecosystem services and affect the ability of biological systems to support human needs, and also determine, in part, the vulnerability of places and people to climatic, economic and socio-political perturbations [3].
The extent and rates of change in land cover and some land uses are known with some certainty. According to Turner et al. most of the earth's surface is already modified, except those areas that are peripheral in location or are inaccessible. Of the total land surface, about 40 percent has been changed in the form of conversion into other uses. It is only about 25 percent of the land that remains nearly unchanged. In the case of Ethiopia, studies on land-use change are few. This being so, however, accurate information is believed to be critical for resources analysis [4,5].
The general objective of the study is to cause of land use change and the effect of change in agricultural production croup yield in case of Azezo Tekle Haymanot Kebele.
Study area description
The study area Azezo Tekle Haymanot Kebele located at Amhara region of North Gondar located in 717 km North West way from Addis Ababa and 180 km away from Bahar Dar. Azezo is the border of North of Tana Lake on the Lesser Angereb River and southwest of the Simien Mountains. The city has a latitude and longitude of 12°36′N 37°28′E /12.6°N 37.467°E with an elevation of 1800-2133 meters above sea level. The total land coverage in Azezo is 2164.98 ha and total number of population 3755 with 1780 Male and 1975 Female, household in Kebele there is total of 638 families, from this 600 are Male and 38 Females (Figure 1).
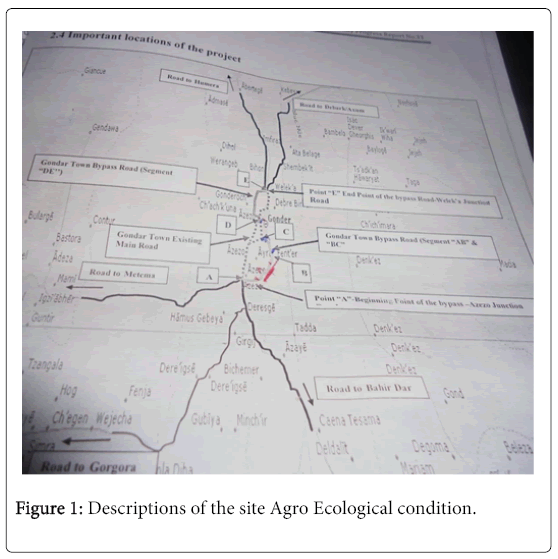
Figure 1: Descriptions of the site Agro Ecological condition.
Temperature
In study areas Azezo Tekle Haymanot Kebele the maximum temperature is (32.8°C) and the mean minimum temperature (180°C) was record. Temperature varies significantly by season, the annual variation ranges from 12 to 26°C Comparison last for year temperature data. The highest mean monthly temperature was recorded for the months of April (32.8°C), May (29.6°C), December (21.0°C) [6].
Rainfall
The rainfall data based on Gondar meteorological station area receives annual mean maximum rain occurs in July (1330.7 mm) and the minimum (643 mm). Rainfall is bimodal with small monthly rainfall occurring from March to May, and October to November and the big rains between June to September. Three months (December, January and February) receive the least amount of rainfall. Relative humidity average mean maximum and minimum relative humidity of 91.40% and 37.92%, respectively [6].
Topography condition
The elevation of the district ranges between 1800-2133 m.a.s.l. According to the report from Gondar Woreda Agricultural and Rural Development Bureau (GWARDB) the majority land flat topography in Azezo Tekle Haymanot Kebele (65%) and lands covers 1298.4 ha and undulated topography with gentle slopes (5%) it lands covers 108.22 ha, mountainous (30%) it lands covers 757.4 ha. The area coverage of the agro-climatic zone of is shows that (69%) Wayna Dega and (11%) Dega [7].
Soil
On the base of soil color, the Azezo Tekle Haymanot Kebele has four types of soil, comprising of Brown 45%, Red 25%, grey 22% and Black 8%. The common soil types are Fluvisols, Luvisols, Vertisols, Nitosols and Lithosols.
Socio-economic characteristics
The total population of Gondar woreda is total population 3755 from this 1780 male and 1975 female. And total house holds 638 from this 500-male household and female 138. Based on the population size and the average number of households in the study area, the average family size would be 6. Socio-economic characteristics of the farmer around 85% of total population led to agricultural work and 10% of the population livestock production and 5% of population worked hotel. The most common type of livestock in the study area are 117 is cattle, 616 was sheep and goats, horses and donkeys with a total number of 45, 585 and 9,798 respectively. The production of poultry with a total number of 52,585 is also expected to be one of the promising income generating activities for farmers [7]. Crop production is mostly rained though in some areas irrigation is practiced. The major crop types grown in the area include cereals (such as wheat, teff, maize, barley and sorghum), pulses (such as horse beans, chick peas, peas) [7,8].
This study carried out in Azezo Tekle Haymanot Kebele. The purpose of this research was to assess the cause of land use change on crop yield on the livelihoods of farmers in Azezo Tekle Haymanot Kebele. Data is collected in Random method.
In house hold survey questionnaires with open and closed ended questions was prepared to collect the required information. The socioeconomic data of the household age, sex, marital status, education level, family size, size of farm land, sours of income, cause of land use change, consequences land use change such data was collected. Household survey data was analyzed by descriptive statistics (such as frequency, percentage) with the socio economical characteristics of households.
Research design
Before the actual research work and data collection, a reconnaissance survey was conducted to have a general overview of the households in Azezo Tekle Haymanot Kebele, and how the livelihoods of the community, and the conditions of the currently land use changed practices in the study area. The reconnaissance survey was helping to refine the data collection methods. Primary data were collected through household questionnaire survey using structured questionnaires with both open-ended and closed-ended questions, focus group discussion with the key informants to develop checklist, field observation and household’s survey, while secondary data were collected through documentary review. The aim was to cross check and verify information obtained through these different methods regarding the topic in question. The target group for this study was all farmers in the households Azezo Tekle Haymanot Kebele area. The sampling unit was the household in this study is referred to as a basic unit of production and consumption, made up from the persons who farm common fields and live under one central decision maker, the household head [9].
Sample procedures and sample size determination
The overall sample size was determined by the method proposed by Bartlett et al. A total of 246 samples of households were randomly selected using simple random sampling technique household survey. It the accurate sample applying using 246 populations. but the constraint of money, times and other factors in this study used by 80 household selected sampling at a representative way for local community of all target population [10].
Therefore, to determine the sample household size for the researcher was applied proportional sampling formula.
n=n/1+N (e)
Where:
n=total samples size of the study;
e=source of errors.
N=total number of households in all samples.
Hence, proportionally 80 household selected sampling based on the number of heads of households residing in Kebeles.
Interview using questionnaires will to gather information on the problem of the cause of land use change it effect on agricultural productivity. Total population of the study areas 638 the household of from this population 500 male and 138 female household. The sampling techniques selecting sampling of respondents from the study area Azezo through simple random sampling to participate in the interviews and conducting information interviews with community representatives. Gondar district experts and development agents. In this study choose the sample techniques Simple Random sample used method to avoid biased. from 638 household to selected with 80 population within 10 small specific villages to selected 8 people total 80 population selected based on all location the whole community a representative way and wealth (poor, medium, very poor, inter medium and rich) and area land cover (ha).
Primary and secondary data sources were employed for this study and methods used in data collection were discussed below.
Primary data collection
Household questionnaires: This study uses a data collected of the years of 2013/2014. Accordingly, to only 80 respondent households survey (2014) has been found appropriate to with the households Azezo Tekle Haymanot Kebele. The researcher has the cause of land use change on crop yield on the livelihoods of farmers used a total of 80 respondent in this analysis. These observations are done in Azezo Tekle Haymanot Kebele households survey 2014. The questionnaire was pre-tested in household survey in Azezo Tekle Haymanot Kebele during the preliminary survey and was finalized by incorporating the feedbacks from farmers. The questionnaire was being prepared in English first and then translated into Amharic. The detail of the questionnaire is interviewed.
In this study 638 household questionnaires very difficult and it takes huge amount of times so minimized to selected 80 people from the whole in representative’s way. In the local area of peasant association there are ten small village to give semi structured questionnaires based on chalk list or written materials and collect qualitative data.
Socio economic data will be collect obtain from 80 respondents select heads of households and from four group discussions with leaders of administrations within the community select. The data collect also group discussions with elders. Group discussions with elders, conduct to gather information on farm size, land tenure issues and which conservation mechanisms from the household interview and group discussion levels. Two types of questionnaires (closed & open ended) will be prepare to collect data.
Focus group discussion: The groups were formed by including development agent, Words agricultural expert, DA PA Kebeles administration and community elders to preparing the checklist.
Field observation and survey: A total of farmlands were visited with the farmers for obtaining the accurate information about the land use change. Direct observation very important method to study present of the study areas. The information will be collected currently land use, socio economical, natural resource, soil condition, topography, water source, vegetation cover and agricultural crop production.
Secondary data collection
In our Household survey of the year 2013/2014 throughout Azezo Tekle Haymanot Kebele the researcher of this study has gathered important information from the Gondar Bureau of Agriculture and Rural Development offices. Secondary data was collected from various sources and records like reports, biophysical data of the like a temperature, rain fall, agro climatic zone, topography, Gondar Woreda Agriculture Office document, central Statistical office data, household data.
Different types of spatial data, the Bebela and Woreda topography map, Gondar Woreda agriculture office report or documents. Different literatures obtained from book, journals, publications, and reports of other line agencies, published or unpublished and relevant literature was also consulted in the library and the relevant websites to make better understanding, interpretation and analysis of the research.
Analyses of the data using table to easy understand and simplified form. The data collect qualitative and quantities data. This section summarizes the results from the descriptive analysis. An attempt is given to recapitulate only important variables that can help as an important background for the study this research analysis. The obtained information gathered and summarized by table with frequency and percentage summary is presented appropriate form easily understand the peoples
Data analyses and presentation
Household Socio-economic characteristics: The socio-economic characteristics of farmers examined in this study were sex, age, marital status, family size, and farm size and education level. The purpose of choosing these characteristics was to get general overview of what the sample households are composed of and towards the cause of land use change and it effect of the change on agriculture crop yield in case Azezo Tekle Haymanot Kebele.
Background information of respondent
Distribution of the respondent by their sex composition: As it is indicated in Table 1 showed that the respondent 90% was male respondent dormant over female respondent used in this study and 10% of female respondent. Out of the 80 observations used in this study, 72 (90%) are male household headed while the remaining 8 (32%) are female headed households.
| S. No | Respondent sex | Frequency | Percentage |
|---|---|---|---|
| 1 | male | 72 | 90 |
| 2 | Female | 8 | 10 |
| 3 | total | 80 | 100 |
Table 1: Sex composition of the of respondent. Source: Field households survey (2014).
Age category of the respondent
As it indicated in Table 2 showed that the respondent 33.75% was the age group of 30-40 and respondents of 41-51 age group includes 31.25% as shown in table.
| Age group | Frequency | Percentage |
|---|---|---|
| 20-30 Age Category | 5 | 6.25 |
| 31-40 Age Category | 27 | 33.75 |
| 41-50 Age Category | 25 | 31.25 |
| 51-60 Age Category | 7 | 8.75 |
| Above 60 Age Category | 16 | 20 |
| Total | 80 | 100 |
Table 2: Age Category of the respondent. Source: Field households survey (2014).
Marital statutes of the respondent
As it indicated in Table 3, it showed that 94% of the respondent was married, it is dominant over rest of the respondent and 3.5% was single respondent and 2.5% are divorced.
| S.No | Marital status | Frequency | Percentage |
|---|---|---|---|
| 1 | Married | 75 | 94 |
| 2 | Single | 3 | 3.5 |
| 3 | Divorced | 2 | 2.5 |
| 4 | Total | 80 | 100 |
Table 3: Marital statutes of the respondent. Source: Field households survey (2014).
Religion of the respondent
As it indicated in Table 4, it showed that 100% of the respondent was orthodox’s, it was dominant over others, Muslims and Protestants.
| S.No | Religion | Frequency | Percentage |
|---|---|---|---|
| 1 | Orthodox | 80 | 100 |
| 2 | Muslim | - | - |
| 3 | Protestant | - | - |
| 4 | Total | 80 | 100 |
Table 4: Religion of the respondent. Source: Field households survey (2014).
Nationality of the respondent
As it indicated in Table 5 from above table showed that the 97.75% of the respondent were Amhara respondents, who were dominant over the rest and 2.25% were included in nation of Tigerga.
| S.No | Nationality | Frequency | Percentages |
|---|---|---|---|
| 1 | Amhara | 78 | 97.75 |
| 2 | Oromo | - | - |
| 3 | Tiegra | 2 | 2.25 |
| 4 | Total | 80 | 100 |
Table 5: Nationality of the respondent. Source: Field households survey (2014).
Family size of the respondent
As it indicated in Table 6, it showed that 56.25% of the respondent were 4-7 family size and 25% of respondent were of 8-10 family size. And 15% the respondent is of 1-3 family size.
| S.No | Family size | Frequency | Percentages |
|---|---|---|---|
| 1 | 1-3 Family size | 12 | 15 |
| 2 | 4-7 Family size | 45 | 56.25 |
| 3 | 8-10 Family size | 20 | 25 |
| 4 | 11 and above Family size | 30 | 3.75 |
Table 6: Family size of the respondent. Source: Field households survey (2014).
In Gondar town according to statically data in Gondar town average birth rate 2.99% per year. In case of Azezo Tekle Haymanot Kebele average family size at a minim 4 up to maximum 7 family included in each of household. Family size refers to the total number of household members within the given household. The larger is the family size, the more labor is expected within that household. Accordingly, though family size is and negatively affects land use change.
The growing population or family size increase and increasing socio-economic necessities creates a pressure on land use. This pressure results in unplanned and uncontrolled changes in land-use change [11]. The land-use change alterations are generally caused by mismanagement of agricultural, urban, range and forest lands which lead to severe environmental problems such as landslides, floods etc.
Education status of the respondent
As it indicated in Table 7, based on the household survey results showed that education level of the respondent 62.5% was unable to read and write respondent, 18.75% respondent has informal education and 12.5% of respondent has study of grad 1-8. And grad 9-12 and Degree level were 5% and 1.25% respectively. As educational status of a household head increases, it is assumed to increase the transfer of relevant information among them and as a result increase farmer’s knowledge about the land use change.
| Age group | Frequency | Percentage |
|---|---|---|
| Unable to read and write | 50 | 62.5 |
| Informal education | 15 | 18.75 |
| grad 1-8 | 10 | 12.5 |
| Grad 9-12 | 4 | 5 |
| Diploma | - | - |
| Degree | 1 | 1.25 |
| Total | 10 | 100 |
Table 7: Education status of the respondent. Source: Field households survey (2014).
Source of income the respondent
As it is indicated in Table 8, it showed that 100% respondents were generating income from farming.
| S.No | Occupation | Frequency | Percentage |
|---|---|---|---|
| 1 | Farmer | 80 | 100 |
| 2 | Merchant | - | - |
| 3 | Civil servant | - | - |
| 4 | Jobless | - | - |
Table 8: Source of income of the respondent. Source: Field households survey (2014).
Respondent place of birth
As it is indicated in Table 9, it showed that all the respondents birth place is Azezo Tekle Haymanot Kebele.
| S.No | Birth place | Frequency | Percentage |
|---|---|---|---|
| 1 | Out of Kebela | - | - |
| 2 | Azezo T/Haymnot | 80 | 100 |
| 3 | Total | 80 | 100 |
Table 9: Respondent place of birth. Source: Field households survey (2014).
Landholding size respondent
As it is indicated in Table 10 showed that respondent 47.5% of respondent landholding size ranges from 0.5-1 ha it is majority of the land holding size and 32.5% land holding size respondent 1.5-2.5 ha. Farm size is the total area cropped by the household in hectares. This includes plots the household owns & rents in to grow its crops. The relationship between farm size and agricultural product is one of question. However; for this study, a negative relationship between farm size and agricultural product expected as the farmers can severely be risking for land use to change urban settlement.
| S.No | Size farm land (ha) | Frequency | Percentages |
|---|---|---|---|
| 1 | Below 0.5 ha | 7 | 8.75 |
| 2 | 0.5-1.5 ha | 38 | 47.5 |
| 3 | 1.5-2.5 ha | 25 | 32.5 |
| 4 | Above 2.5 ha | 2 | 2.5 |
Table 10: Landholding size of the respondent. Source: Field households survey (2014).
Land is the basic asset of farmers. The average landholding size of the sample households in the study area was 0.5-1.5 hectare. Generally, in according to Gondar town administration of agriculture’s offices document total farm land currently, 11869 hectares of land in rural Kebela. The farm land size within each household at approximately, 1.5 hectares. In case of our study areas Azezo Tekle Haymanot Kebele farm land average between 0.5-1.5 hectares of land. Farm sizes in Gondar town rural Kebela have been declining over time, and roughly a quarter of the agricultural households are virtually landless, controlling less than 0.1 ha per capita and indicated high population pressure induced land degradation and declining agricultural productivity.
Land-use change study area
As it is indicated in Table 11 showed that 98.88% of respondent was land use in change in Azezo Tekle Haymanot Kebele or in the study area. Land use change in Gondar town there have been almost observes changes in the overall amount area used for agriculture for about the last fifty years with increasing human and livestock population. Currently changes were observed only in the amount of cultivated land holding to changed urbanization over time.
| S.No | Land-use change | Frequency | Percentage |
|---|---|---|---|
| 1 | Yes | 79 | 98.88 |
| 2 | No | 1 | 1.2 |
| Total | 80 | 100 |
Table 11: Land-use change Study area. Source: Field households survey (2014).
Cause of land-use change study area
As it is indicated in Table 12 showed that 45% of respondent in Azezo Tekle Haymanot Kebele cause of land use change by infrastructure development and 41.25% of the respondent cause of land use change by urbanization or urban settlement expansion, 11.25% of the respondent cause of land use change come by building, infrastructure i.e. the complex networks designed to deliver to or remove from farm land to change other nodded like road, building, urban shelter or settlement and like such as education, hospital.
| S.No | Cause of Land usage change | Frequency | Percentages |
|---|---|---|---|
| 1 | Infrastructure development | 36 | 45 |
| 2 | Urbanization | 33 | 41.25 |
| 3 | Building | 9 | 11.25 |
| 4 | other | 2 | 2.5 |
Table 12: Cause of Land-use change. Source: Field households survey (2014).
Generally, in according to Gondar town administration of agricultural offices document total farm land in year 2002-2006 E.C decline 205 hectare of land infrastructure development, urban development like settlement expansion. Azezo Tekle Haymanot Kebele cause of land use change 2002-2006 E.C minimized farm land 912ha to 825 ha to reduce for the purpose of infrastructure development like hospital building, federal polices training center, road building ,dams, totally 88 ha of land will be lost 2002-2006 E.C. In the study area are cause of land used Azezo Tekle Haymanot Kebele, under time to time developed change land use cover type by urbanization, settlement expansion and building expansion this result reduced farm land to go result of declining agriculture productivity dramatically.
Urbanization is a process and cannot just understand only in terms of the number of rural urban migrants. It is a process that considers human, economic, social, which translates an area of rural or village, into a town or part of one or the further growth and expansion of already existing rural areas to change urban centers. The increase in the proportion of urban vs the rural population, the continuous life style changes we observe in every day, the adoption and consumption of new technologies, and innovations of various issues, all the phenomena where urbanization can be expanding. Therefore, urbanizations are a positive development factor, capable of enhancing access to adequate infrastructure development, shelter in a built.
Urban explanation is the increase in the proportion of people living in our settlement. Urban occurs because people towns and cities to move from rural areas because of no land in town in case of still developing. Urban areas are expanding rapidly with the current trend of urban expansion being exhibited in developing countries [11].
The effect of land-use changes in study area
As it is indicated in Table 13 showed that 97.5% of respondent in Azezo Tekle Haymanot Kebele effect of land use change by harmful and 2.5% of the respondent benefited. Generally, in according to Gondar town administration of agricultural offices document and PA, Key format of KebelE stakeholder total farm land on Azezo Tekle Haymanot Kebele 2014 data within 3.3% land use change. In the werda data 1.5% of land to building federal police trains center, 0.8% urban expansion and 0.7% of land rural settlement expansion and sold waste management and finally 0.3% land for dam construction used.
| S.No | Effect of land-use | Frequency | Percentages |
|---|---|---|---|
| 1 | Harmful | 78 | 97.5 |
| 2 | Benefited | 2 | 2.5 |
| 3 | Total | 80 | 100 |
Table 13: The effect of land-use changes in Study area. Source: Field households survey (2014).
Type of effect of land-use change in study area
As it is indicated in Table 14 showed that 65.7% of respondent in Azezo Tekle Haymanot Kebele effect of land use change decline cultivated land and 29.7 % of the respondent decline croup yield and finally 5.5% environmental degradation. The land use in Azezo Tekel Hymnot Kebele or in the study area are defined into different types land used namely farm land and settlements, forest land, vegetation, trees and plantation. Currently this land use dramatically area under time to time develop change land use to urbanization settlement and infrastructure development.
| S.No | Effect of land-use | Frequency | Percentages |
|---|---|---|---|
| 1 | Decline cultivated land | 51 | 65.7 |
| 2 | Decline croup yield | 23 | 29.7 |
| 3 | Environmental degradation | 4 | 5.5 |
| Total | 78 | 100 |
Table 14: Type of effect of land-use change. Source: Field households survey (2014).
Negative effect of land-use changes in study area
As it is indicated in Table 15 showed that 76.92% of respondent in Azezo Tekle Haymanot Kebele had effect of land use change which reduced croup yield and 19.24% of the respondent had soil erosion hazard and finally 3.84% of respondent faced environmental degradation.
| S.No | Effect of land-use | Frequency | Percentages |
|---|---|---|---|
| 1 | Reduced croup yield | 60 | 76.92 |
| 2 | Soil erosion hazard | 15 | 19.24 |
| 3 | Environmental degradation | 3 | 3.84 |
| Total | 78 | 100 |
Table 15: Negative effect of land-use change. Source: Field households survey (2014).
Most affect croup type by land-use change
As it is indicated in Table 16, it showed that 57.5% of respondent Azezo Tekle Haymanot Kebele most effect of wheat crop by land use change, 17.5% of maize crop affect and 15% of teffs crop affect by landuse change
| S.No | Crop type | Frequency | Percentage |
|---|---|---|---|
| 1 | Wheat | 46 | 57.5 |
| 2 | Maize | 14 | 17.5 |
| 3 | Teffe | 12 | 15 |
| 4 | Sorghum | 8 | 10 |
| 5 | total | 80 | 100 |
Table 16: Most affect croup land-use change. Source: Field households survey (2014).
As the table 16 show that 2002-2006 E.C field croup data indicated that area per hectare and yield productivity declines each year because of higher amount of land up to 88 ha of land 2002 up 2006 decline by using infrastructure development. Currently farm or cultivated land decreased it also decreased agricultural productivity compared last 4 years.
Perceptions about land-use change
It is indicated in Table 17, it showed that 72.50% of respondent in Azezo Tekle Haymanot Kebele medium perception about land use change and 3.75% of the respondent very lower peoples higher perception about land use change.
| S.No | Perceptions | Frequency | Percentages |
|---|---|---|---|
| 1 | Low | 19 | 23 |
| 2 | Medium | 58 | 72.5 |
| 3 | Higher | 3 | 3.75 |
| 4 | Total | 80 | 100 |
Table 17: Perceptions about land-use change. Source: Field households survey (2014).
Land-use change on croup yield
It is indicated in Table 18 showed that 74.50% of respondent in Azezo Tekle Haymanot Kebele the land-use change cultivated land to urban and 25.64% of the respondent land-use change to building.
| S.No | Land-use change | Frequency | Percentages |
|---|---|---|---|
| 1 | Cultivated land to grazing land | 2 | 2.3 |
| 2 | Cultivated land to urban | 58 | 74.5 |
| 3 | Building | 20 | 25.64 |
| 4 | Total | 80 | 100 |
Table 18: Land-use change on croup yield. Source: Field households survey (2014).
Land-site trend
It is indicated in Table 19 showed that land-site trend 85% of respondent in Azezo Tekle Haymanot Kebele the land site cultivated year to year decreased and 15% of respondent no change year to years. Land use change trends in Gondar town especially rural kebela are both extremely rapid and the direction of changes and rates are in flux. Land use changes are the primary source of declines land and minimized agricultural yield by altering ecosystem services, affect the ability of biological systems to support human needs.
| S.No | Land-site trend | Frequency | Percentages |
|---|---|---|---|
| 1 | Decreased | 68 | 85 |
| 2 | Increased | - | - |
| 3 | Similar to | 12 | 15 |
| 4 | Total | 80 | 100 |
Table 19: Land-site trend. Source: Field households survey (2014).
Both the urban conversion of agricultural land and GDP in the industrial sector are negatively affect with agricultural land use intensity. The case of urban expansion on agricultural land result in a decline in agricultural land use intensity. First, it is useful the rate of urbanization and the resulting transfer of farm labors have led to a decline of the agricultural land use intensity in these provinces [12].
Cause of land-use change decreased
Table 20 shows the land usage caused frequency and percentages. Urbanization accounts to 56.76 percentage, highest among all.
| S.No | Cause | Frequency | Percentages |
|---|---|---|---|
| 1 | Urbanization | 45 | 56.76 |
| 2 | Human population increase | 2 | 2.58 |
| 3 | Rural settlement | 24 | 29,99 |
| 4 | Megech irrigation dam | 8 | 10.2 |
Table 20: Cause of land-use change decreased. Source: Field households survey (2014).
Management option land-use change
It is indicated in Table 21 showed that 53.75% respondents said the land-usage changed to get compensation money and 15% of the respondents opted for Land Register and Certificate. 25% of the respondents asked for sustainable land use management policy. 6.25% went for Land redistribution.
| S.No | Management option | Frequency | Percentages |
|---|---|---|---|
| 1 | Sustainable land use management policy | 20 | 25 |
| 2 | Land register and certificate | 12 | 15 |
| 3 | Land redistributed | 5 | 6.25 |
| 4 | Compensation money | 43 | 53.75 |
Table 21: Management option land-use change. Source: Field households survey (2014).
Land requester and certificate or Land tenure describes the way rights in land are held. It is the relationship, whether legally or customarily defined, among people, as individuals or groups with respect to land. Ethiopian land tenure system was highly complex one with regional variations This complexity is a major reflection of the country’s geographical, ethnic and cultural diversity, and its historical background [13]. Land redistribution which was an important aspect of Ethiopia’s land reform had been conducted recurrently, on behalf of empowering the poor during the Derg era based on traditional system of records for the sake of the redistribution [14]. Even when the current government came to power, land redistribution was outlined again with the objective to balance the holding between elite groups and the poor [14].
The land use change in this study has enabled to reconcile according to data sources for land use change. This study has investigated the cause of land use change and effect of the crop yield in case of Azezo Tekle Haymanot Kebele. Total of data collected from 80 respondents selected with a simple random sample, applied data from Gondar agricultural office, Azezo Tekle Haymanot Kebele PA, DA, key formats constitute totality of data collected for the analysis.
The result shows that in majority 70.89% of in Azezo Tekle Haymanot Kebele, the cause of land use changed by infrastructure development and 13.92% of the cause of land use changed by urban settlement expansion, 11.66% of land use change came by building. In the study area cause of land used, under time to time only increased. It changed land use cover type by urbanization, settlement expansion and building expansion which decreased the farm land agricultural productivity dramatically. Today agricultural land intensification provides explanations about the pathways through which these factors to urban expansion affect the intensity of agricultural land use and other major factors contributing to intensification of land use. However, between urban expansion and agricultural land use change it effect on agricultural productivity of land scarcity or shortage and the community to give compensation money to change start off-farm opportunities.
• Compensation money to be given adequately and to give higher training for crated cooperative works like dairy farm, poultry.
• Increase awareness creation about land use change and its effect and hint for further research.