
Cell & Developmental Biology
Open Access
ISSN: 2168-9296

ISSN: 2168-9296
Research Article - (2024)Volume 13, Issue 6
Single-cell sequencing enables to reveal cellular heterogeneity and discover new cellular subpopulations. In terms of the strategy of single-cell sequencing, the main methods are based with combinatorial index, microwell and microfluidic. Due to the simplicity, methods based droplets are widely used for single-cell sequencing for multi-omics. Therefore, in order to facilitate researchers to choose a suitable platform to meet their application scenarios, we compared several commercial platforms: The Chromium X platform of 10x Genomics, the MobiNova-100 platform of MobiDrop, the SeekOne platform of SeekGene, and the C4 platform of BGI. Based the comprehensive assessment of the data analysis, the Chromium X platform shows an excellent performance, closely followed by MobiNova-100 platform.
MobiDrop; SeekGene; Chromium X; Single-cell RNA; MobiNova-100
Cells are the units of organisms and there is significant heterogeneity among cells [1]. When 30 analyzing large tissue samples consisting of millions of cells, it is difficult to distinguish heterogeneity between individual cells and identify cells that may play an important role in development and disease progression [2-5]. In order to enable the studies of cellular heterogeneity, single-cell sequencing technology was developed with 96-well plates in 2009 [6], but this strategy is escalated due to be laborious and complicated [7-9]. In 2015, droplet-based single-cell sequencing was developed, which easily captures cells with high throughput and the process is simple and convenient [10,11]. As many advantages appear to droplet-based single-cell RNA-sequencing technology, there are many excellent solutions successfully commercialized, such as the Chromium X series of 10x Genomics, the MobiNova-100 platform of MobiDrop, the SeekOne platform of SeekGene, and the C4 platform of BGI [12-15]. Since many solutions are available for single-cell sequencing, it is especially important for researchers to find a suitable solution [16-18].
In order to illustrate the performance of different platforms, we performed experiments and compared the results of captured cell number, captured gene number, cellular clustering, cell type annotation, differential gene expression and cell signal pathway on the four platforms above. The results show that the comprehensive performance Mobinova-100 platform is close to the 5 performance of Chromium X series. In terms of the significance of differential genes, the performance of MobiNova-100 is particularly excellent.
Cell preparation of Peripheral Blood Mononuclear Cells (PBMCs)
Frozen healthy human PBMCs were purchased from Ori Biotech Ltd. Frozen primary cells were thawed according to the manufacturer’s instructions.
Single-cell RNA-seq library preparation and sequencing (MobiDrop, MobiNova-100)
The PBMCs were loaded into microfluidic chip of chip A single cell kit v2.1 (MobiDrop (Zhejiang) Co. Ltd., Cat. No: S050100201) to generate droplets with MobiNova-100 (MobiDrop (Zhejiang) Co. Ltd., Cat. No: A1A40001). Each cell was involved into a droplet which contained a gel bead linked with up to millions of oligos with cell unique barcode. After encapsulation, droplets suffer light cut by MobiNovaSP-100 (MobiDrop (Zhejiang) Co. Ltd., Cat. No: A2A40001) while oligos diffuse into reaction mix.
The mRNAs were captured by cell barcodes with cDNA amplification in droplets. Following reverse transcription, complementary DNAs (cDNAs) with barcodes were amplified, and a library was constructed using the high throughput single cell 3’RNA-seq kit v2.0 (MobiDrop (Zhejiang) Co. Ltd., Cat. No: S050200201) and the 3' single index kit (MobiDrop (Zhejiang) Co. Ltd., Cat. No: S050300201). The resulting libraries were sequenced on an Illumina NovaSeq 6000 system.
Single-cell RNA-seq library preparation, sequencing (10x Genomics, Chromium X)
Single-cell 3’-RNA-Seq samples were prepared using single cell V3.1 reagent kit and loaded in the Chromium Controller according to standard manufacturer protocol (10x Genomics, 15 PN-120237) to capture cells. Briefly, PBMCs were encapsulated in nanodroplets Gel beads-in-Emulsion (GEMs) using a microfluidic device. These GEMs were generated combining barcoded single cell 3’V3.1 gel beads, a master mix that contains the Reverse Transcription (RT) reagents, the single cells, and partitioning oil onto the Chromium Next GEM chip. After cell lysis, RNAs were captured on the gel beads coated with oligos containing an oligo-dT, Unique Molecular Identifiers (UMIs) and a specific barcode. Incubation of the GEMs leads to the production of barcoded full-length cDNA from poly-A mRNA. After reverse transcription, GEMs were broken and cDNAs were purified with silane magnetic beads. Then, barcoded full-length cDNA was amplified by PCR to generate enough material for library construction. Amplified cDNA was purified again, and cDNA quality control was assessed by capillary electrophoresis (Bioanalyzer, Agilent) before the preparation of the libraries. Finally, libraries were prepared using a fixed proportion of the total cDNA. Enzymatic fragmentation and size selection were used to optimize the cDNA amplicon size. During the GEM incubation, the read 1 primer sequence was added to the molecules. At this step, P5, P7, a sample index, and the read 2 primer sequence were added via end repair, A-tailing, adaptor ligation and PCR. The final libraries that contain the P5 and P7 primers used in Illumina bridge amplification were sequenced on an Illumina NovaSeq 6000 system.
Single-cell RNA-seq library preparation and sequencing (BGI, C4)
Single-cell RNA-seq libraries were prepared using C4 scRNA-seq kit (BGI). Barcoded mRNA capture beads, droplet generation oil and the single-cell suspension were loaded into the corresponding reservoirs on chip for droplet generation. The droplets were gently removed to the collection vial and placed at room temperature for 20 minutes. Droplets were then broken and collected by the bead filter (BGI). The supernatant was removed, and the bead pellet was resuspended with 100 μl RT mix. The mixture was then thermal cycled as follows: 42°C for 90 minutes, 10 cycles of 50°C for 2 minutes, 42°C for 2 minutes. The bead pellet was then resuspended in 200 μl of exonuclease mix and incubated at 37°C for 45 minutes. Afterward the PCR master mix was added to the beads pellet and thermal cycled as follows: 95°C for 3 minutes, 13 cycles (for nuclei 19 cycles) of 98°C for 20 s, 58°C for 20 s, 72°C for 3 minutes, and finally 72°C for 5 minutes. Amplified cDNA was purified using 60 μl of AMPure XP beads. The cDNA was subsequently fragmented to 400-600bp with NEBNext dsDNA fragmentase (New England Biolabs) according to the manufacturer’s protocol.
Indexed sequencing libraries were constructed using the reagents in the C4 scRNA-seq kit following the steps:
(1) Post fragmentation size selection with AMPure XP beads; (2) End repair and A-tailing; (3) Adapter ligation; (4) Post ligation purification with AMPure XP beads; (5) Sample index PCR and size selection with AMPure XP beads. The barcode sequencing libraries were quantified by Qubit (Invitrogen). All libraries were further prepared based on BGISEQ-500 sequencing platform. The DNA Nanoballs (DNBs) were loaded into the patterned nano arrays and sequenced on the BGISEQ-500 sequencer using the following read length: 41 bp for read 1, 100 bp for read 2, and 10 bp for sample index.
Single-cell RNA-seq library preparation and sequencing (SeekGene, SeekOne)
The single-cell RNA-seq libraries were prepared using SeekOne digital droplet single cell library preparation kit (SeekGene). An appropriate number of PBMCs were combined with the reverse transcription reagent and subsequently introduced into the sample well within the SeekOne DD Chip S3 (Chip S3). Following this, Barcoded Hydrogel Beads (BHBs) and partitioning oil were separately dispensed into their corresponding wells within Chip S3. Once emulsion droplets were generated, reverse transcription was executed at a temperature of 42°C for a duration of 90 minutes, followed by inactivation at 85°C for 5 minutes. Subsequently, cDNA was extracted from the broken droplets and subjected to amplification through PCR reactions. The resulting amplified cDNA product underwent a series of steps including purification, fragmentation, end repair, A-tailing, and ligation to sequencing adaptors. Finally, indexed PCR was performed to amplify the DNA, which represented the 3’ poly-A region of expressing genes and also included the cell barcode and unique molecular index. The indexed sequencing libraries were subjected to purification using SPRI beads, followed by quantification using quantitative PCR. The libraries were then sequenced on an Illumina NovaSeq 6000 platform with PE150 read length.
Single-cell RNA-seq data processing
We implemented several quality control measures to eliminate subpar single-cell transcriptomes. Initially, we only kept single cells with expressed genes ranging from 500 to 5000, mitochondrial reads less than 5%, and genes that in more than three cells. Single cell data was normalized by sctransfrom function in Seurat. A principal component analysis was then carried out. After that, data sets from different platform were integrated using the first 20 PCs with harmony [19]. Resolution was set to 0.3 to identify clusters. Finally, Doublets were identified by DoubletFinder, and discarded [20].
The quality control of four platforms based droplets
The identification of distinct cell types through the clustering of scRNA-seq profiles stands out as a key application. The datasets from Peripheral Blood Mononuclear Cells (PBMCs) encompasses a variety of cell types, providing an opportunity to evaluate and contrast different methodologies for this particular scenario. We compared several commercial platforms with PBMCs.
Sensitivity is an important metric to evaluate scRNA-seq methods. It represents the ability of the technology to capture RNA molecules with a small amount of input. We used the UMI per cell and the number of genes captured per cell to evaluate the capture efficiency of the method. Overall, the 10x Genomics platform captured the most UMIs and number of genes per cell (median genes=2085, median UMIs=5532) of the four platforms. Among them, MobiDrop and SeekGene had close UMIs median and gene median with 10x Genomics platform (respectively 4365, 1747 for MobiDrop; respectively 5172, 1782 for Seekgene). The BGI platform had the fewest genes and UMIs per cell (Table 1).
| Platform | 10x Genomics | MobiDrop | SeekGene | BGI |
|---|---|---|---|---|
| Mapping rate | 92.2% | 94.71% | 96.11% | 94.11% |
| Cell number | 15417 | 17670 | 4949 | 5837 |
| Median gene number | 2085 | 1747 | 1782 | 661 |
| Median UMl | 5532.5 | 4365 | 5172 | 1049 |
| Exon ratio | 53.7% | 59.15% | 52.37% | 53.7% |
| Intron ratio | 30.2% | 28.05% | 31.30% | 28.1% |
| Total gene ratio | 83.9% | 87.2% | 83.67% | 81.8% |
Note: The median gene number and median UMl are filtered from four single-cell sequencing platforms with the same parameter.
Table 1: The comparison of data quality control.
As we analysis to integrate different data sets, we can comparison between different methods for estimation of doublets rate. We found the highest doublets rate for 10x Genomics, slightly 25 lower for Mobidrop, and comparable and low doublets rate for SeekGene and BGI. The higher doublets rate of 10x Genomics and Mobidrop can be attributed to the larger number of cells [19].
Clustering and annotation of total PBMCs
Sctransform normalization was used to normalize the data and harmony was used to integrate all the collected data [20,21]. PCA (Principal Component Analysis) and UMAP (Uniform Manifold Approximation and Projection) were performed to reduce dimension for the data visualization. The cell number of SeekGene and BGI platform is extremely low than 10x Genomics and MobiDrop platforms, especially not enough cells that falls into some specific clusters. Finally, cells were annotated into 6 cell types: B cells, CD4+ T cells, CD8+ T cells, Monocytes, NK cells and DCs, consistent with previous studies (Figure 1) [22].
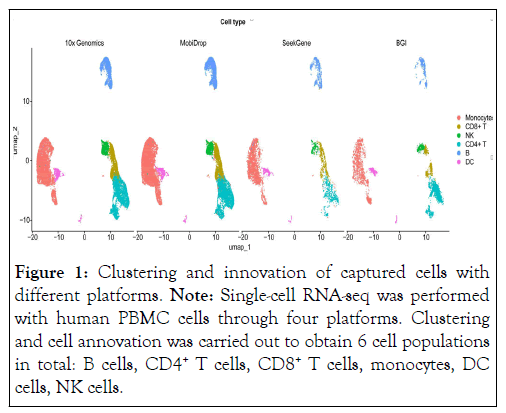
Figure 1: Clustering and innovation of captured cells with different platforms. Note: Single-cell RNA-seq was performed with human PBMC cells through four platforms. Clustering and cell annovation was carried out to obtain 6 cell populations in total: B cells, CD4+ T cells, CD8+ T cells, monocytes, DC cells, NK cells.
Based the analysis, it was observed that every cell type was identified with each respective 10 dataset. However, methods varied in the ability to distinguish cell types, in the proportion of cell types recovered. As expected, methods were more difficult to distinguish transcriptionally related cell types, such as CD4+ T cells, CD8+ T cells and natural killer cells. From the UMAP plot, we observed that for identifying CD8+ T cells, BGI performed slightly better, while the other three methods performed equally well. We also found that for most cell types, although MobiDrop, 10x Genomics and SeekGene were not the best, their performance was relatively consistent and robust. BGI is less effective at identifying individual cell types, such as monocytes. Since all libraries for each experiment were generated from the same sample, we evaluated the consistency of the different methods in terms of the proportion of cells assigned to each cell type in a single experiment. In summary, all methods recovered all cell types, but the proportion of different cell 20 types varied [23].
The data showed that MobiDrop had the most similar cell ratios to the 10x Genomics platform. The differences in the cell ratios of CD4+ T cells and monocytes captured by the SeekGene platform were poor compared to the other platforms and the differences in the B cells captured by the BGI platform were poor compared to the other platforms (Figure 2A). After de-batch 25 effect, those results were comparable to analyze the performance of clustering by Average Silhouette Width (ASW) (Figure 2B).
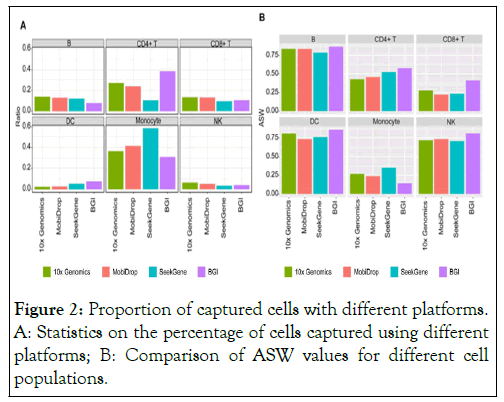
Figure 2: Proportion of captured cells with different platforms. A: Statistics on the percentage of cells captured using different platforms; B: Comparison of ASW values for different cell populations.
Comparison of marker gene’s expression and high variation genes
To emphasize the accuracy of the clustering, we analyzed the expression of marker genes of the captured cell by each platform. The results showed that the strong signals of cell marker genes appear to MobiDrop and SeekGene platforms, while the 10x platform was relatively weak to detect marker gene expression and the BGI platform captured no obvious signal of marker genes. Among them, the MobiDrop platform performed well in B cells and DC cells with the high percentage and strong expression of marker genes. However, when using the 10x platform, the captured signal of T-cell maker genes appeared to be weak (Figure 3A).
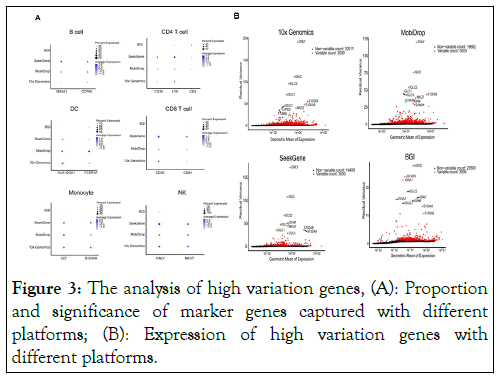
Figure 3: The analysis of high variation genes, (A): Proportion and significance of marker genes captured with different platforms; (B): Expression of high variation genes with different platforms.
At the same time, we did a count of barcode for the four platforms used in this study. Based on the comparison of the results, we can find that the top 10 highly variable genes of MobiDrop, 10X, and SeekGene are mostly overlapping, in the order of GNLY, IGKC, IGLC2, IGLC1, IGLC3, S100A9, and NKG7, whereas the top 10 highly variable genes of BGI are partially overlapping, in the order of IGKC, IGLC2, GNLY, IGLC3, S100A9 (Figure 3B).
The data above suggests that the performance of MobiDrop, 10x Genomics and SeekGene platforms are comparable with the estimation of marker gene expression and high variation genes.
The capture of signal pathways in PBMCs
The importance of signaling pathways in Peripheral Blood Mononuclear Cells (PBMCs) lies in their critical role in regulating immune responses. PBMCs, which include lymphocytes (T cells, B cells, and NK cells) and monocytes, are key components of the immune system. The signaling pathways within these cells control their activation, differentiation, and function in response to various stimuli, such as infections, inflammation, and autoimmune reactions. Understanding these pathways is essential for elucidating the mechanisms of immune responses and disease pathogenesis.
We did enrichment analyses of the signaling pathways for each cell type in response to the data quality of the different platforms (Figure 4). The results showed that the MobiDrop, 10x Genomics and SeekGene platforms captured stronger signals, and the BGI platform was the least effective. Meanwhile, for CD4+ T cells, the performance of SeekGeneplatform was not stable enough.
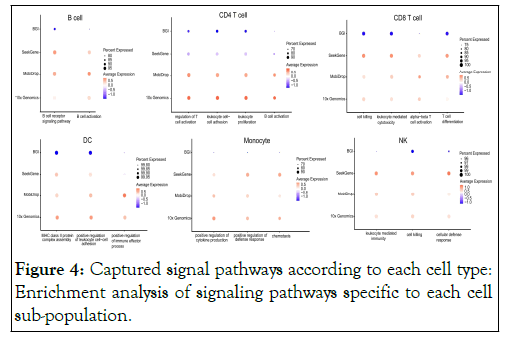
Figure 4: Captured signal pathways according to each cell type: Enrichment analysis of signaling pathways specific to each cell sub-population.
There are also low-throughput scRNA-seq methods that sort cells or use a mouth pipette to pick off cells into a single well of a 96-well plate. However, these methods can only analyze tens to hundreds of single-cell transcriptomes at a time. In the field of single-cell transcriptome sequencing, there are more microfluidic-based methods that simplify the operation and show great advantages.
In this study, we systematically compare four high-throughput single-cell sequencing 25 platforms via droplet-based methods, including the Chromium X platform of 10x Genomics, the MobiNova-100 platform of MobiDrop, the SeekOne platform of SeekGene, and the C4 platform of BGI. As far as captured gene number is concerned, the 10x Genomics platform has the best performance, while MobiDrop has the best performance in terms of captured cell number and gene mapping rate. The performance of 10x Genomics and MobiDrop is comparable in terms of the effect of cell clustering and cell type ratio. In terms of the significance of marker genes and differential genes, MobiDrop and SeekGene show the best performance. As droplet-based single-cell sequencing platforms, Chromium X and MobiNova-100 reveal comparable data quality. By comparing the different platforms in this study, we are able to choose the method that is suitable to our research scenario. For the detection of a rare subpopulation, choose a low-throughput method to load pre-purified cells. We can also load more cells in a high-throughput platform to obtain more information for all loaded cell subpopulations. Of course, cost should also be taken into account.
When the number of cells is less than 100, a low-throughput method may be a better choice, otherwise, a high-throughput platform will perform better. In addition, the platform should be versatile that can be used to integrate with multi-omics to analyze gene expression and gene regulation through different dimensions.
The evaluation of various single-cell RNA sequencing platforms highlights the trade-offs between low-throughput and high-throughput methods. Low-throughput techniques, while limited in scale, are advantageous for analyzing rare cell populations through meticulous cell selection. Conversely, high-throughput platforms, such as the Chromium X and MobiNova-100, excel in capturing a larger number of cells and genes, thereby providing comprehensive insights into cellular diversity. MobiDrop stands out for its superior cell capture and gene mapping rate, while SeekGene and MobiDrop excel in identifying significant marker genes. Ultimately, the choice of platform should be guided by specific research objectives—whether focusing on rare subpopulations or broader cellular landscapes—as well as considerations of cost and compatibility with multi-omics approaches. This systematic comparison empowers researchers to make informed decisions that align with their experimental needs, paving the way for advancements in single-cell transcriptomics.
Yu X and Zhong YF were supported by the Microfluidic Bioassay Technology Venture Team 220 Program of China (2022R02005). We thank Linyan Wang for critical comments on this manuscript.
Yu X conceived and designed the study. Zhong Y designed and performed all experiments, the computational analyses. Yu X wrote the paper with provided support from Zhong Y. All authors participated in data discussion and interpretation.
The authors declare no conflict of interest.
[Crossref] [Google Scholar] [PubMed]
[Crossref] [Google Scholar] [PubMed]
[Crossref] [Google Scholar] [PubMed]
[Crossref] [Google Scholar] [PubMed]
[Crossref] [Google Scholar] [PubMed]
[Crossref] [Google Scholar] [PubMed]
[Crossref] [Google Scholar] [PubMed]
[Crossref] [Google Scholar] [PubMed]
[Crossref] [Google Scholar] [PubMed]
[Google Scholar] [PubMed]
[Google Scholar] [PubMed]
[Google Scholar] [PubMed]
[Crossref] [Google Scholar] [PubMed]
[Crossref] [Google Scholar] [PubMed]
[Crossref] [Google Scholar] [PubMed]
[Google Scholar] [PubMed]
[Crossref] [Google Scholar] [PubMed]
[Google Scholar] [PubMed]
[Crossref] [Google Scholar] [PubMed]
[Crossref] [Google Scholar] [PubMed]
[Crossref] [Google Scholar] [PubMed]
[Crossref] [Google Scholar] [PubMed]
[Google Scholar] [PubMed]
Citation: Zhong Y, Wang L, Yu X (2024). The Comparison of Single-Cell RNA Sequencing Platforms Based Droplets. Cell Dev Biol. 13:371.
Received: 11-Sep-2024, Manuscript No. CDB-24-33966; Editor assigned: 13-Sep-2024, Pre QC No. CDB-24-33966 (PQ); Reviewed: 27-Sep-2024, QC No. CDB-24-33966; Revised: 04-Oct-2024, Manuscript No. CDB-24-33966 (R); Published: 11-Oct-2024 , DOI: 10.35248/2168-9296.24.13.371
Copyright: © 2024 Zhong Y. This is an open-access article distributed under the terms of the Creative Commons Attribution License, which permits unrestricted use, distribution and reproduction in any medium, provided the original author and source are credited.