
Immunotherapy: Open Access
Open Access
ISSN: 2471-9552

ISSN: 2471-9552
Research Article - (2022)Volume 8, Issue 3
Introduction: With the development of the sequencing technology, RNA-seq is becoming more and more popular. The method of using RNA-seq technology to analyze the immune repertoire has the advantages of low sample demand, simple operation, and comprehensive information.
Methods: RNA-sequencing data were downloaded from SRA in NCBI, including 79 pairs of cancerous and adjacent noncancerous tissues samples of four representative cancer types, based on the literature, CutAdapt software was adopted to remove adapters, barcode bases, and low-quality bases. MiXCR software package was employed to extract immune repertoire receptor sequences.
Results: The RNA-seq data from public database were used to analyze and compare the TCR and BCR sequences of cancer and normal tissues in four types of cancers, including colon adenocarcinoma, lung adenocarcinoma, pancreatic adenocarcinoma and stomach adenocarcinoma. It was found that the clonal diversity of TCR among various types of cancer is different, and the variety of BCR between cancer tissues and healthy tissues is obvious. Based on the analysis of non-shared CDR3 sequences, the degree of the heterogeneity of TRB is different cancer types, different individuals with same cancer, cancer tissues and para-cancerous tissues of the same individual. Also, the correlation between the expression levels of the five main immune checkpoints genes and the count of TCR clones displayed various among different types of cancers.
Conclusion: Through the analysis of the immune repertoires in cancer tissues and adjacent non-cancer tissues of COAD, LUAD, PAAD and STAD, there were no significant differences found in TCR count and Shannon entropies within the same cancer type. But there are significant differences in TCR numbers and Shannon entropies among different cancer types. The results verify the advantage of RNA-seq analyzing in acquiring individual immune repertoire.
Immune repertoire; Pancarcinoma; Immune checkpoints; Hetero-geneity
The adaptive immune system is an essential part of the vertebrate immune system. It is a necessary system to produce specific antibodies against antigen invasion and has a memory function [1]. The system includes T-cells and B-cells, which provide different antibodies based on different antigenic structures to prevent pathogens and antigens from entering basal cells. The recognition of an antigen depends on the receptors on the surface of the immune cells, i.e., T-cell Receptors (TCR) or B-cell Receptors (BCR) [2].
When the antigen is recognized, T-cells will clone in large numbers and promote B cells to secrete the specific antibodies to neutralize the antigen molecules.
TCR is a heterodimer composed of two chains TRA and TRB [3,4]. Depending on the diversity caused by the different constituent chains of TCR, T-cells can be divided into αβ T-cells and γδ T-cells [5]. Among them, αβ T-cells mainly involve in cellular immunity [6]. γδ T-cells mainly distribute in the mucosa and skin immune system, which can directly recognize specific antigens and kill target cells [7]. Here we only discuss the TCR produced by αβ T-cells. BCR, which is distributed on the surface of B cell membrane, is a tetramer with two heavy chains (H chain) and two light chains (L chain) connected by two disulfide bonds [8]. The epitope on the surface of the antigen molecule can be accurately recognized by and bound explicitly to BCR.
The structures of TCR and BCR chains include V, J and CDR3 regions. The V region is the most diverse species relative to other regions and is one of the primary sources of receptor diversity. It including two complete complementarity-determining areas (CDR1 and CDR2) and a portion of CDR3, is variable in TCR and BCR [9]. The J region is a junction region in TCR and BCR. The type of J region is also an essential factor in the variety of TCR and BCR. The CDR3 area is the region connecting the V gene and the J gene. CDR3 integrates all nucleotide insertions or deletions during gene recombination and is the region with the most mutations. Therefore, analyzing the sequence of the CDR3 region is very important for studying the characteristics of TCR and BCR.
The more types of TCR and BCR clones and the higher diversity of T-cells and B-cells, the more active the immune system becomes [10]. The diversity mainly stems from four mechanisms [11,12]: combinations of different VDJ gene fragments; the random insertion and deletion of different gene segments; combinations of different heavy and light chains; and unique random highfrequency mutations to the receptor of B cells. It has been estimated that these mechanisms could cause thousands of different B-cell and T-cell receptors [13]. The diversity of TCR and BCR can be stimulated by different antigens and has specificity for antigen. For a particular infection or disease, T-cells and B-cells in the immune system respond and produce specific TCR and BCR sequences for the antigen [14]. Thus a particular receptor sequence has the potential to be a marker of a specific virus, bacterium, or fungus [15,16].
Common methods for detecting receptor sequences include flow cytometry [17], PCR [18,19] and immune repertoires sequencing [20,21]. In recent years, RNA-seq analysis gradually becomes a new technology to avoid the limitations of these methods. RNA-seq technology can provide important biological informations so as to reveal biomarkers for the diagnosis, monitoring, and treatment of diseases [22,23].In recent years, the studies on the diversity of TCR and the use of TCR-modified T-cells for immunotherapy based on RNA-seq technology continue rising. The association of TCR diversity with MHC class II expression in tumour tissue and the public T-cells enrichment in the tumour environment has been examined in the literature [24]. Some studies also reported the relationships between the diversity and clonality of TCR and certain diseases, such as DCI [25] and some cancer types [26], and proposed several identification methods based on TCR specific analysis [27]. In addition, the use of TCR to treat diseases has also made great progress. Jakobsen used high-affinity TCR modified T-cells to treat patients with melanoma, in which 55% patients showed clinical responses [28]. Therefore, discussing the TCR and BCR sequences in pan-cancer in a more comprehensive manner is meaningful for developing tumour immunotherapy. Based on the aforementioned advantages of RNA-seq technology and the importance of TCR and BCR diversity, we collected the RNA-seq data of four types of cancers and fully described their immune repertoires, including the clone diversity and the sequences features, in order to find out the TCR and BCR characters with tumour specificity [29-32].
Data collection and preprocessing
RNA-sequencing data were downloaded from SRA in NCBI, including 79 pairs of cancerous and adjacent noncancerous tissues samples of four representative cancer types, based on the literature [33-35] (Table 1). CutAdapt [36] software was adopted to remove adapters, barcode bases, and low-quality bases.
| Accession code | Cancer type | Pairs of samples |
|---|---|---|
| PRJDB4239 | COAD | 3 |
| PRJNA288518 | COAD | 5 |
| PRJNA344450 | LUAD | 27 |
| PRJNA435914 | STAD | 34 |
| PRJNA490335 | PAAD | 10 |
Table 1: Basic information of the sample.
Extraction of immune repertoire
The MiXCR [37] software package was employed to extract immune repertoire receptor sequences. In the process of extracting TCR or BCR by MiXCR, to obtain more assembled reads containing full CDR3 sequence, two iterations of reads assembling and one germline sequences extend step were added to avoid the false positives, which may be caused by the randomly interruption of RNA reads during the subsequent comparison analysis.
Gene expression analysis
The HISTA2 [38] software was used to map the reads to the human reference genome hg38 to obtain the SAM files. Samtools software [39] was used to convert the SAM file into a BAM file and sort reads according to the location of the chromosome. Finally, String Tie [38] software was used to process the upstream data to get the FPKM values of gene expression.
Statistical analysis and visualization
After using MiXCR to obtain the TCR and BCR sequences, VDJTools [40] and tcR were used to analyze the sequences. To eliminate the batch effect caused by the depth of sequencing, the number of clones were measured in each 10 million reads. Subsequently, VDJ Tools software package was adopted to analyze and count the obtained clones. The tcR [40] software package was used to count the number of shared TRB sequences among the samples in the group and calculate the Shannon entropies. The pheatmap package was used to draw heat maps. The ggpubr package was used to draw a box plot with rank-sum tests and to perform the correlation analysis.
Diversity and heterogeneity of TCR in different cancer types
Diversity of TCR: The number of TCR clones, clone types, and CDR3 sequences in normal and tumour tissues of different cancers were found out and displayed in Table 2. Because the γδ T-cells only account for 1%-5% of T-cells, our analysis of TCR mainly considers αβ T-cells. As presented in Figures 1a-1d, individuals with different cancers are not consistent. For most of COAD individuals, the numbers of clones in normal samples is relatively higher than that in cancer tissues. But no consistent phenomenon can be observed in the other three cancers. For the overall comparison between the cancer and the adjacent non-cancer samples, only the number of TRB in the cancer tissue of COAD is significantly lower than that of healthy tissue (P=0.038). For different types of tumour tissues, the numbers of TRA and TRB clones of STAD and PAAD are relatively higher than those of the other two types of cancers (Figures 1e-1f).
| Sample type | Count | Average*g | Diversity* | Average | CDR3 | Average | |
|---|---|---|---|---|---|---|---|
| Normal | COAD | 820 | 103 | 549 | 69 | 544 | 68 |
| LUAD | 4929 | 183 | 3816 | 141 | 3775 | 140 | |
| PAAD | 3702 | 370 | 2684 | 268 | 2654 | 265 | |
| STAD | 21291 | 626 | 10600 | 312 | 10405 | 306 | |
| Tumour | COAD | 393 | 49 | 313 | 39 | 310 | 39 |
| LUAD | 5067 | 188 | 4257 | 158 | 4219 | 156 | |
| PAAD | 2515 | 252 | 1944 | 194 | 1928 | 193 | |
| STAD | 17441 | 513 | 9151 | 269 | 8991 | 264 | |
Table 2: Diversity: The diversity of clone types average: the number of counts or diversity or CDR3/the number of samples of each type. The numbers of TRA and TRB clones were measured in each 10 million reads showed as follows.
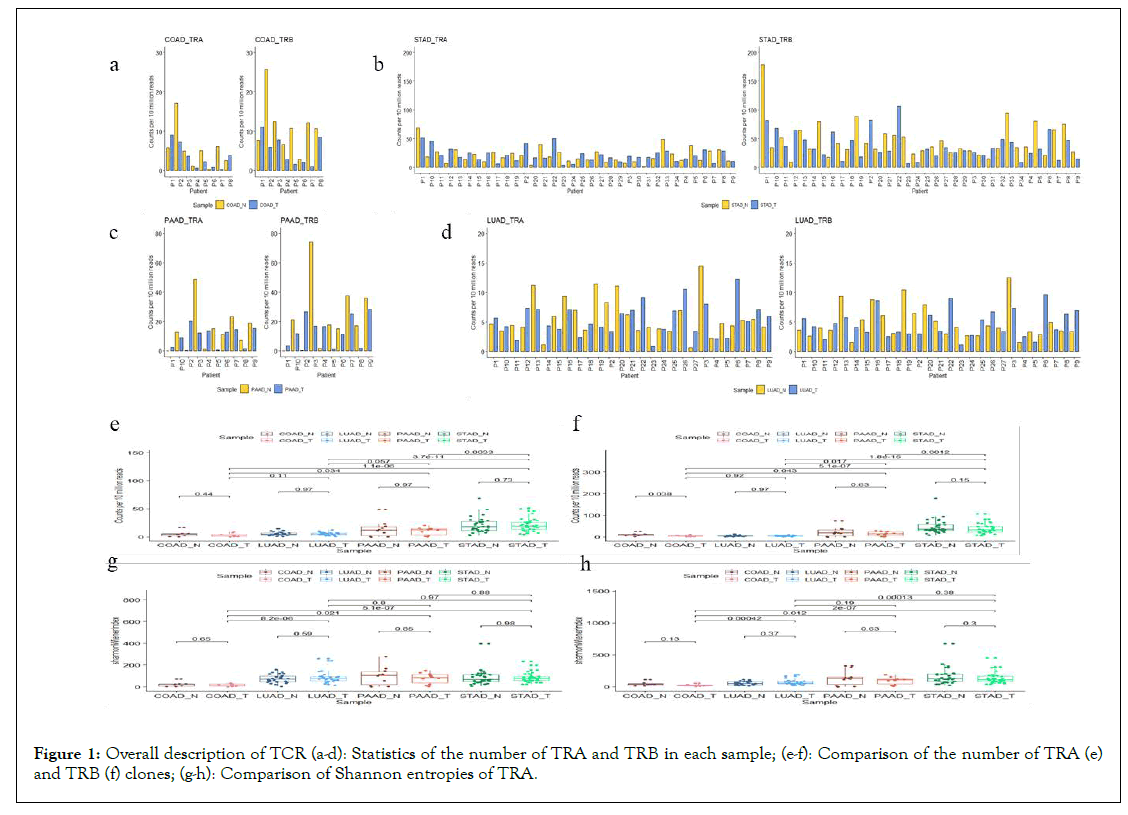
Figure 1: Overall description of TCR (a-d): Statistics of the number of TRA and TRB in each sample; (e-f): Comparison of the number of TRA (e) and TRB (f) clones; (g-h): Comparison of Shannon entropies of TRA.
The TCR diversities between tumour tissues and normal tissues were compared in each type of cancers and across four types of tumour tissues. Shannon entropies were adopted to represent the TCR clonal diversity (Figures 1g-1h). There was no significant difference in Shannon entropies between tumour-normal samples for the four types of cancers (P>0.05). The diversity of TCR in COAD and LUAD did not reach the conclusion of the significant difference reported in the previous literatures [29,30]. The reason is probably that the sample size of COAD is too small. But the Shannon entropies of TRA and TRB in COAD were significantly lower than those of the other three types of cancers (P<0.05). Interestingly, the significant differences in TCR diversity were mainly concentrated in different cancer types, rather than cancer and adjacent non-cancers. It may be due to various immune responses in different organs.
Heterogeneity of TCR: The shared TRB CDR3 sequences were analyzed among all the samples to look into the heterogeneities of TCR for each cancer type. The share sequences of CDR3 are mainly concentrated between the cancer tissue and healthy tissue of the same person (Figure 2A). At the same time, for the totality of all the individuals of the four cancers, it can also be found that there were few TRB shared between different cancer tissues (Figure 2B). Taking STAD as an example, the number of shared sequences between the cancer tissue and adjacent cancer tissue shown in Figure 2C is greater than that of the cancer tissue of STAD and the other three cancers in Figure 2B. In a word, the TCR heterogeneity between different tumour types is very high, and the TCR heterogeneity of different individuals with the same cancer is higher than that of cancer and adjacent cancers in the same individual. This conclusion supported the ideas of differentiation of various tumours based on the TCR sequences.
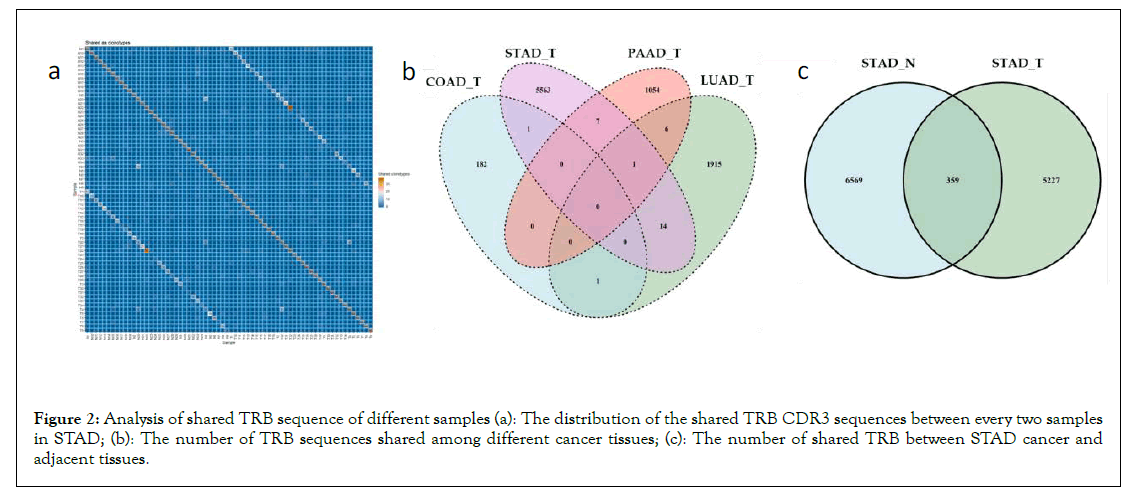
Figure 2: Analysis of shared TRB sequence of different samples (a): The distribution of the shared TRB CDR3 sequences between every two samples in STAD; (b): The number of TRB sequences shared among different cancer tissues; (c): The number of shared TRB between STAD cancer and adjacent tissues.
The diversity of BCR in carcinoma and adjacent noncancerous tissues
Meanwhile, B cell receptor sequences (IGH, IGK, IGL) of all the samples were also analyzed. The number of BCR clones and BCR CDR3 sequences found in carcinoma and adjacent noncancerous tissues of each cancer type were shown in Table 3. The figures showed the number of BCR clones in four types of cancers (Figures 3a-3d). For individuals in the four types of cancers, patients with LUAD and PAAD had more BCR clones in tumor tissues, but patients with STAD and COAD had more BCR clones in normal tissues. The differences in BCR clone numbers across the sample groups were demonstrated in Figures 3e-3g. The number of BCR clones in LUAD cancer samples was significantly higher than that in adjacent noncancerous samples (P<0.05). In comparison, the number of BCR clones in STAD cancer samples was considerably lower than that in noncancerous samples (P<0.05). Besides, the number of BCR clones in STAD samples was significantly higher than those of the other three cancers (P<0.05).
| Sample type | Count | Average | Diversity | Average | CDR3 | Average | |
|---|---|---|---|---|---|---|---|
| Normal | COAD | 315988 | 39499 | 103184 | 12898 | 83208 | 10401 |
| LUAD | 289424 | 10719 | 88937 | 3294 | 69408 | 2571 | |
| PAAD | 351798 | 35179 | 74372 | 7437 | 62808 | 6281 | |
| STAD | 13732779 | 403905 | 1358124 | 39945 | 1038997 | 30559 | |
| Tumor | COAD | 82500 | 10313 | 24713 | 3089 | 22002 | 2750 |
| LUAD | 1562443 | 57868 | 283427 | 10497 | 208906 | 7737 | |
| PAAD | 701283 | 70128 | 94940 | 9494 | 79637 | 7964 | |
| STAD | 4867153 | 143152 | 638065 | 18767 | 508122 | 149445 | |
Table 3: Statistics of BCR clones.
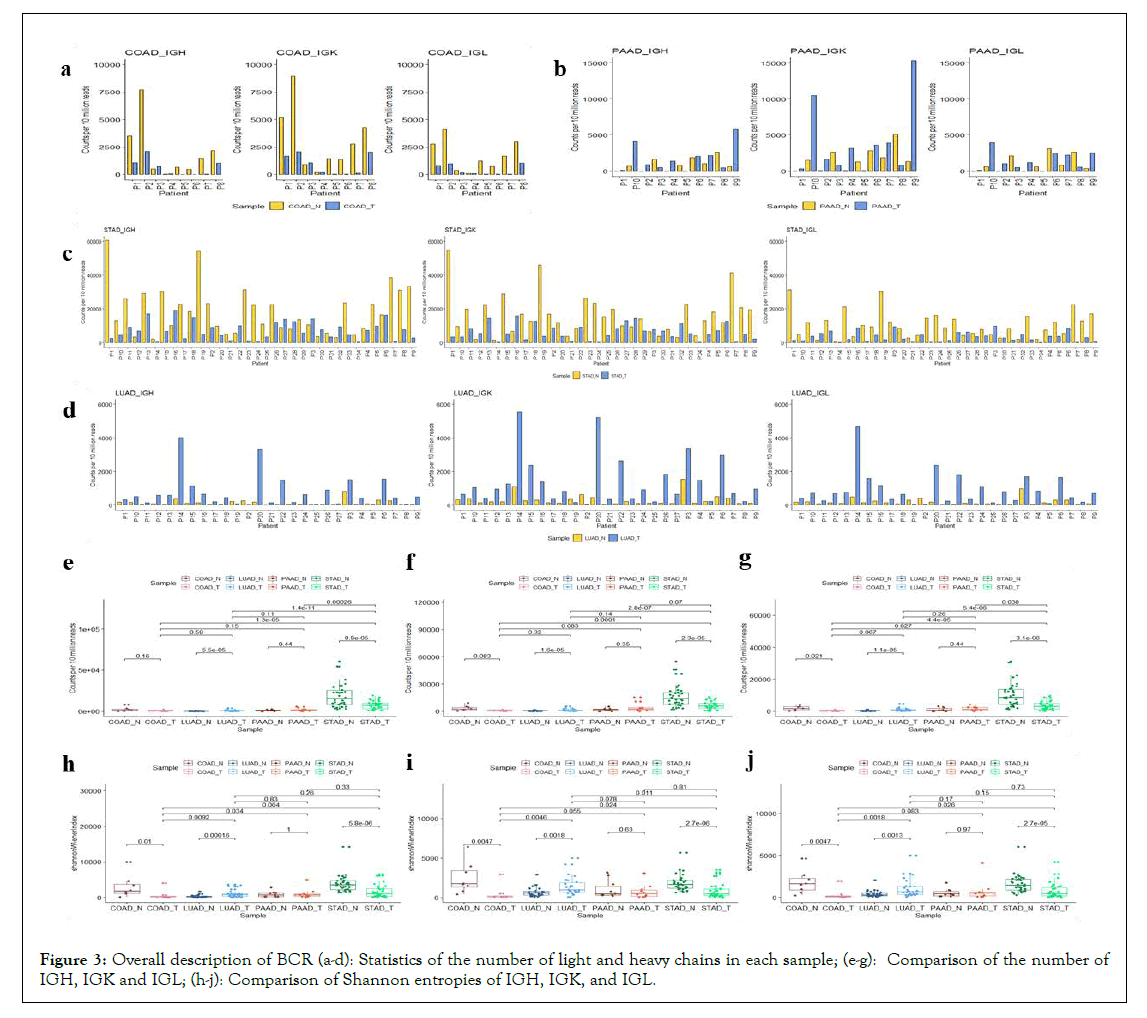
Figure 3: Overall description of BCR (a-d): Statistics of the number of light and heavy chains in each sample; (e-g): Comparison of the number of IGH, IGK and IGL; (h-j): Comparison of Shannon entropies of IGH, IGK, and IGL.
Consistent with the analysis of TCR, we calculated the Shannon entropies of BCR in different samples (Figures 3h-3j). In the comparison between tumour and normal tissues of the same cancer, Shannon entropies of BCR( IGH, IGK and IGL) in COAD and STAD cancer samples were significantly lower than their adjacent noncancerous samples (p<0.05). In contrast, BCR Shannon entropies of LUAD cancer samples was substantially higher than their adjacent noncancerous samples. Unlike TCR, the diversity of BCR between cancer and adjacent noncancerous cancers within the same cancer type was very significant (p<0.05), except in PAAD. Furthermore, the BCR diversity between tumour and adjacent noncancerous tissues of the same cancer type was more significant than that among different cancers.
The frequency distribution of V and J genes in different sample groups
The frequencies of the V genes and the J genes in TCR and BCR were also presented in Figure 4. Based on the preferences expressed by the height of the bars, the frequency distribution of the V genes were similar in tumour and normal samples in each cancer type except for COAD, and so the frequency distributions of the J genes. This preference was only observed in COAD samples, probably because the number of COAD samples is less than one-third of STAD and LUAD, which makes the statistical results deviate the real world.
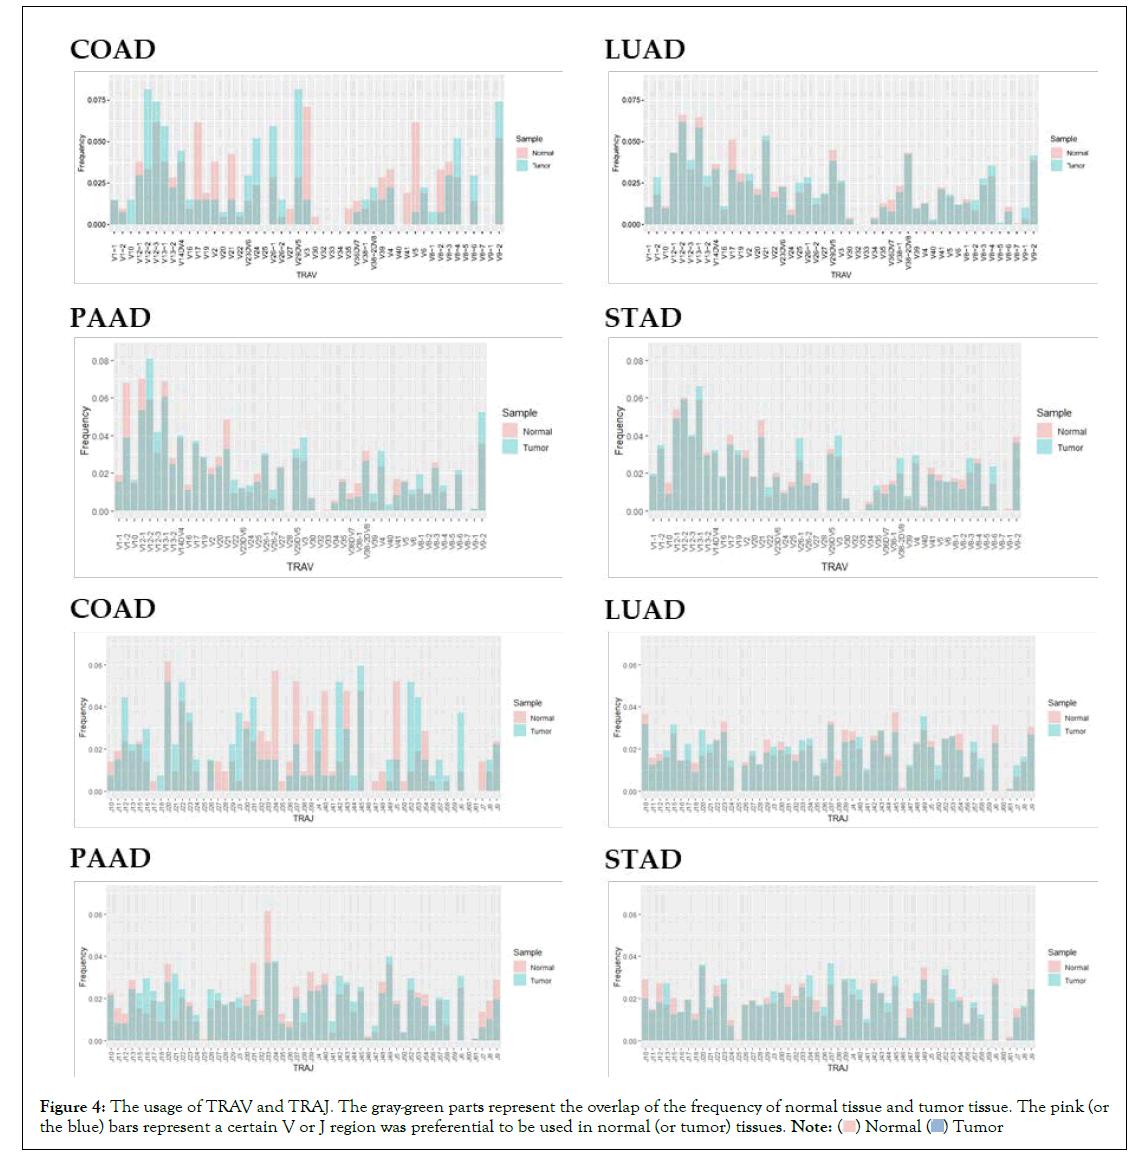
Figure 4: The usage of TRAV and TRAJ. The gray-green parts represent the overlap of the frequency of normal tissue and tumor tissue. The pink (or
the blue) bars represent a certain V or J region was preferential to be used in normal (or tumor) tissues. .
.
PDCD1 expression positively correlated with TCR counts
The immunotherapy targeting to many immune checkpoint inhibitors such as PD-L1 have been widely used. However, antiimmunotherapy for tumours was not always effective. The anti- PD-1 antibody had a therapeutic effect in approximately one in four to one in five patients with non-small-cell lung cancer, melanoma, or renal-cell cancers [31]. Therefore, novel prognostic markers are needed to predict which patients would respond. A study has demonstrated the potential for TCR repertoire profiling to serve as a biomarker of clinical response in pancreatic cancer patients receiving immunotherapy [32]. That study also provides the rationale to consider anti-CTLA-4 as an initial therapy for T-cell priming and anti-PD-1 as a requirement for T-cell expansion and maintenance. On the basis of the article, we introduced the associations between more immune checkpoints and TCR clones. The correlation between the expression levels (FPKM) of the immune checkpoint related genes, such as PDCD1, TIM-3, LAG3, BTLA and 4-1BB, and the number of TCR and BCR clones were displayed in Figures 5a-5e. The results showed that the TCR counts were correlated to the expression levels of different immune checkpoint genes in different types of cancers. For example, the number of TCR clones was correlated with the expression of PDCD1 and BTLA in LUAD, while the number of TCR clones is related to the expression of PDCD1 and TIM-3 in PAAD. Commonly, the TCR expression was positively correlated with the expression level of the PDCD1 gene in all the four cancer types.
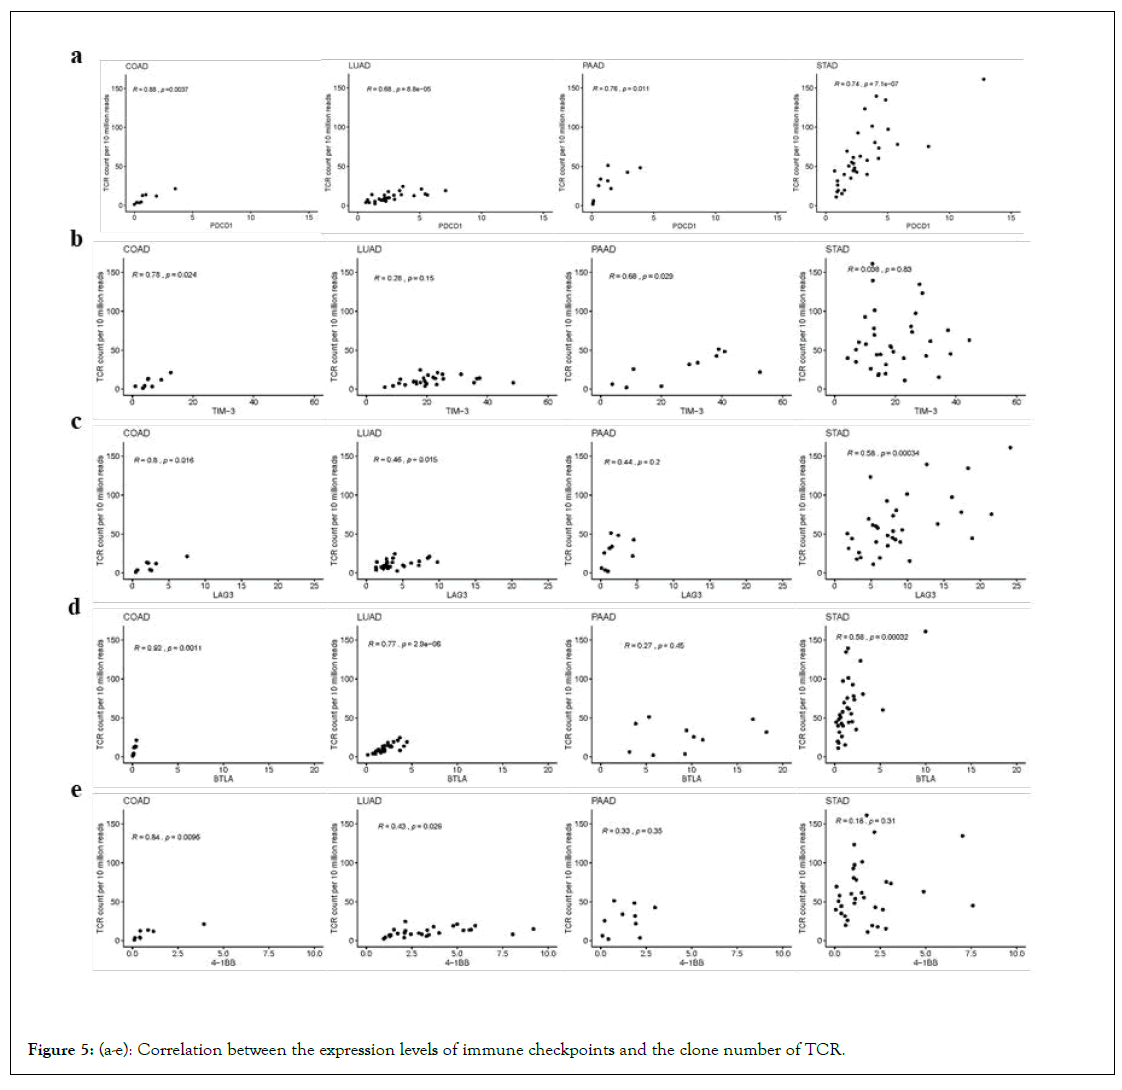
Figure 5: (a-e): Correlation between the expression levels of immune checkpoints and the clone number of TCR.
Through the analysis of the immune repertoires in cancer tissues and adjacent non-cancer tissues of COAD, LUAD, PAAD and STAD, there were no significant differences found in TCR count and Shannon entropies within the same cancer type. But there are significant differences in TCR numbers and Shannon entropies among different cancer types. Based on the analysis results of non-shared CDR3 sequences, TRB heterogeneity between various cancers>heterogeneity between different individuals of the same disease>heterogeneity of cancer tissues and healthy tissues of the same individual. Our results show the diversity and heterogeneity of TCR among different cancers. In addition to the same TRB sequence as that in normal tissues, the TRB sequence unique to the cancer types predicts the presence of specific antigens for the disease and may be a molecular target for disease prediction and immunotherapy.
For BCR, the Shannon entropies of cancer tissues and adjacent tissues in COAD, LUAD, STAD are significantly different. It shows that the diversity of B-cells infiltrated inside the tumours of these three cancers has changed significantly compared with that in healthy tissues. Compared with the other three cancers, the diversity of BCR in cancer and non-cancer tissue of PAAD is not very obvious. It can be inferred that the degree of B cell infiltration of different cancers is also different. The diversity of BCR may become an indicator of cancerous, and provide new ways for clinical monitoring of diseases.
Through analyzing of the usage of the V genes and J genes of TCR and BCR sequence, it seems that the usage preference and frequency distribution has no obvious differences between normal and tumour tissues in LUAD, PAAD and STAD. The different frequency distribution of TRAV and TRAJ genes in COAD standard samples and cancer samples may be due to the small samples size. Besides, similar to the TCR genes, the frequency distribution of the V and J genes of the BCR heavy and light chains are also identical.
Immune checkpoints are important factors for suppressing the function of T-lymphocytes in the body, thus triggering the immune escape of tumour cell antigens. We selected five immune checkpoints PDCD1, TIM-3, LAG3, BTLA, and 4-1BB, and analyzed the correlation between their expression levels and the number of TCR clones. It is found that the number of TCR clones related to the expression number of different immune checkpoints for different cancer types. Therefore, based on the number of TCR clones, the therapeutic effect of the immune checkpoint inhibitor can be inferred.
In conclusion, our results suggest possible complementary methods or companion diagnostic methods of tumour immunotherapy. At present, the impacts of only using TCR to modify T-cells or using anti-immune checkpoint drugs are not very satisfactory. Based on the heterogeneity of TCR in different cancers and the diversity of BCR in tumour and adjacent tissues, the strategy of tumour immunotherapy can be probably more precise. Through the analysis of the immune repertoires in cancer tissues and adjacent non-cancer tissues of COAD, LUAD, PAAD and STAD, there were no significant differences found in TCR count and Shannon entropies within the same cancer type. But there are significant differences in TCR numbers and Shannon entropies among different cancer types. The results verify the advantage of RNA-seq analyzing in acquiring individual immune repertoire. Moreover, the heterogeneity of TCR in different cancers and the diversity of BCR in tumour and adjacent tissues shown in the results and they provide hints at developing the strategies of tumour immunotherapy.
[Crossref] [Google Scholar] [PubMed].
[Crossref] [Google Scholar] [PubMed].
[Crossref] [Google Scholar] [PubMed].
[Crossref] [Google Scholar] [PubMed].
[Crossref] [Google Scholar] [PubMed].
[Crossref] [Google Scholar] [PubMed].
[Crossref] [Google Scholar] [PubMed].
[Crossref] [Google Scholar] [PubMed].
[Crossref] [Google Scholar] [PubMed].
[Crossref] [Google Scholar] [PubMed].
[Crossref] [Google Scholar] [PubMed].
[Crossref] [Google Scholar] [PubMed].
[Crossref] [Google Scholar] [PubMed].
[Crossref] [Google Scholar] [PubMed].
[Crossref] [Google Scholar] [PubMed].
[Crossref] [Google Scholar] [PubMed].
[Crossref] [Google Scholar] [PubMed].
[Crossref] [Google Scholar] [PubMed].
[Crossref] [Google Scholar] [PubMed].
[Crossref] [Google Scholar] [PubMed].
[Crossref] [Google Scholar] [PubMed].
[Crossref] [Google Scholar] [PubMed].
[Crossref] [Google Scholar] [PubMed].
[Crossref] [Google Scholar] [PubMed].
[Crossref] [Google Scholar] [PubMed].
[Crossref] [Google Scholar] [PubMed].
[Crossref] [Google Scholar] [PubMed].
[Crossref] [Google Scholar] [PubMed].
[Crossref] [Google Scholar] [PubMed].
[Crossref] [Google Scholar] [PubMed].
[Crossref] [Google Scholar] [PubMed].
[Crossref] [Google Scholar] [PubMed].
[Crossref] [Google Scholar] [PubMed].
[Crossref] [Google Scholar] [PubMed].
[Crossref] [Google Scholar] [PubMed].
[Crossref] [Google Scholar] [PubMed].
[Crossref] [Google Scholar] [PubMed].
[Crossref] [Google Scholar] [PubMed].
[Crossref] [Google Scholar] [PubMed].
[Crossref] [Google Scholar] [PubMed].
Citation: Chen YB, Li B, Hu WX, Xu LD, Tang HX, Zhang J, et al. (2022) The Diversity and Heterogeneity of TCR and BCR in Pan-Cancer. Immunotherapy (Los Angel). 08:193.
Received: 02-May-2022, Manuscript No. IMT-22-16464; Editor assigned: 04-May-2022, Pre QC No. IMT-22-16464 (PQ); Reviewed: 19-May-2022, QC No. IMT-22-16464; Revised: 26-May-2022, Manuscript No. IMT-22-16464 (R); Published: 06-Jun-2022 , DOI: https://doie.org/10.0313/IMT.2023640551
Copyright: © 2022 Chen YB, et al. This is an open-access article distributed under the terms of the Creative Commons Attribution License, which permits unrestricted use, distribution, and reproduction in any medium, provided the original author and source are credited.