Journal of Hematology & Thromboembolic Diseases
Open Access
ISSN: 2329-8790
ISSN: 2329-8790
Research Article - (2014) Volume 2, Issue 4
Blood and bone features in JAK2V617F mutated prefibrotic essential thrombocythemia (ET) and polycythemia vera (PV) are overlapping in terms of increased cellularity due to increased erythropoiesis and pleomorphic megakaryocytes indicating the need to measure red cell mass (RCM) according to PVSG and WHO criteria. The JAK2V617F mutated myeloproliferative neoplasms (MPN) appeared to be a broad biological continuum of normocellular ET, ET with features of polycythemia vera (prodromal PV), classical PV, advanced PV, Inapparent PV (IPV) with splenomegly, masked PV or hypercellular ET due to megakaryocytic granulocytic myeloproliferation (ET.MGM) when the 2013 WHO and European Clinical, Molecular and Pathological (WHO-CMP) criteria are applied. The megakaryocytes morphology may change from pleomorphic to dysmorphic in advanced PV, in IPV and in masked PV (ET.MGM) as bone marrow cellularity, the degree myelofibrosis and the JAK2V617F mutation load increase during long-term follow-up. Erythrocytes above the upper limit of normal (5.8×10¹²/L), but not hemoglobin and hematocrit is clearly correlated with increased red cell mass (RCM) above (30) ml/kg) and therefore diagnostic for PV and idiopathic erythrocythemia (IE) on top of pathognomonic MPN bone marrow histology in newly diagnosed PV patients with normal mean cell volume (MCV) of erythrocytes and no or minor of splenomegaly. Erythrocyte count remain above the upper limit of normal in PV and IE in complete hematological remission by phlebotomy alone as the consequence of iron deficiency induced microcytic erythrocytes that correct the blood volume (RCM), hemoglobin and hematocrit to normal. The combination of increased RCM, increased plasma volume, and normal or low erythrocyte counts is characteristic for IPV with significant splenomegaly as the only cause of increased blood volume without symptoms of hypervolumemia.
Keywords: Myeloproliferative disorders; Myeloproliferative neoplasm; Essential thrombocythemia; Polycythemia vera; Reticulin fibrosis; JAK2V617F Mutation; Bone marrow histopatology; Red cell mass; Erythrocyte count; Inapparent polycythemia vera
According to Dameshek & Henthel a definite diagnosis of polycythemia vera (PV) can be made by the combined occurrence of plethoric appearance, splenomegaly, elevated erythrocyte count above 6×10¹²/L, elevated platelet count, and elevated hematocrit [1]. The bone marrow is diagnostic showing a panmyelosis (increased trilinear hematopoiesis) and large megakaryocytes in smears of aspirated bone marrow from the iliac crest or sternum [1,2]. In a doubtful case, the procedure of blood volume estimation may be helpful [1,2]. Between 1975 and 1980 we discovered a causal relationship between platelet-mediated erythromelalgia and microvascular cerebral transient ischemic attacks as the presenting symptoms in early stage essential thrombocythemia (ET) and PV. Consequently, we were able to prospectively document the prefibrotic stages of ET and PV in 30 cases by the combined use of the Rotterdam clinical and pathological (RCP) features for ET and PV (Table 1) [3,4]. Between 1997 and 2013 we prospectively studied the presenting blood and bone marrow features during long-term follow-up in 10 cases of JAK2V617F mutated myeloproliferative neoplasms (MPN, 6 ET and 4 PV patients) and could demonstrate the existence of sequential stages of JAK2V617F mutated MPN patients including normocellular ET, ET with PV features (prodromal PV), classical PV and hypercellular ET associated with megakaryocytic granulocytic myeloproliferation (ET.MGM) when the integrated WHO and European Clinical, Molecular and Pathological (WHO-CMP) criteria are applied (Tables 2 and 3). ET.MGM is clearly in between normocellular ET and post-ET myelofibrosis 5-13. The 2013 WHO- CMP classification of the MPNs encompasses a wider scale of specific clinical, molecular and bone marrow histology features of JAK2V617F positive ET and PV, thereby making early diagnosis, proper staging, and timely initiation of targeted treatment options possible.
| Major criteria | ||
| A1 A2 |
Persistent platelet count in excess of 400×109/L. Increase and clustering of large megakaryocytes in bone marrow biopsy |
|
| Confirmative criteria | ||
| B1 B2 B3 B4 |
Presence of large platelets in a peripheral blood smear thrombocytosis and normal ESR. Absence of any underlying disease for reactive No or slight splenomegaly on palpation or scan (<15 cm) Increase of LAP-score and no signs of fever or inflammation |
|
| Exclusion criterion | ||
| Ph+ chromosome and any other cytogenetic abnormality in blood or bone marrow cells | ||
| B. The 1980 RCP major (A) and minor (B) criteria for prefibrotic PV | ||
| A1 A2 A3 |
Raised red cell mass. Male >36 ml/kg, female >32 ml/kg: Increased erythrocyte count above 6×10¹²/L: Dameshek1. Increase in bone marrow biopsy of clustered, large pleomorphic megakaryocytes with hyperlobulated nuclei and increased cellularity due to increased megakaryopoiesis erythropoiesis or typically trilinear mega-erythro-granulopoiesis. typical PV bone marrow excludes erythrocytosis [6,18,19]. |
|
| B1 B2 B3 B4 |
Thrombocythemia, persistant increase of platelet >400×109/Lsedimentation rate. Leukocytosis, leucocyte count >109/L and low erythrocyte. Raised leukocyte alkaline phosphatase (LAP) score >100, absence of infection. Splenomegaly on palpation or on isotope/ultrasound scanning. |
|
| A1or A2 plus A3 and none of B establishes erythrocythemic PV A1 or A2 plus A3 plus one of B establishes PV and excludes erythrocytosis |
||
| Grading of bone marrow cellularity according to Ellis et al. PVSG 01 study 1975 [13]. | ||
| N : normal cellularity (<50-60%): ET histology + : increased cellularity as judged by decease fat cells (cellularity 60-80%): PV histology ++ : hypercellular with absence of fat cells (80-100%). Trilinear PV histology |
||
| Grading RF | Grading RF | Description of reticulin fibers (RF) in PV13 |
| Normal RF-0 |
N | No reticulin fibers, occasional individual fibers or focal areas with tiny amount of reticulin fiber network |
| Slight increase RF 1 |
+ | Fine reticulin fiber network throughout much of section and no course reticukin fibers |
| Moderate RF 2 |
+ + | Diffuse fine reticuline network with focal collections of thick course reticulin fibers and no collagenisation (RCF, Masson stain) |
| Marked RF 3=RCF |
+++ RF and collagen fibrosis: RCF | Diffuse and dense increase in reticulin with extensive intersections, and presence of collagen fibers (Masson stain) and no or minor osteosclerosis (RCF, Masson stain) |
| Masson stain | RCF | Presence of collagen fibers according Masson stain for collagen |
Table 1: The Rotterdam Clinical and pathological (1980 RCP) criteria of essential thrombocythemia (ET) defined and used between 1975-1980, Grading of reticulin fibrosis (RF) according to Ellis et al. PVSG 01 study 1975)
Between 1975 and 1980 we discovered and elucidated the causal relation between erythromelalgia and thrombocythemia in ET and PV patients and could prospectively document since 1975 the very early stage of ET by the use of the Rotterdam Clinical and Pathological (RCP) criteria for ET and PV (Table 1). Platelets in excess of 400×109/L, and an increase of clustered enlarged megakaryocytes in a bone marrow biopsy material is diagnostic for thrombocythemia in ET and PV (Table 1) [3,4]. The RCP criteria of ET and PV were delineated by careful prospective documentation of peripheral blood and bone marrow smears and bone marrow biopsy material. Platelets in excess of 400×109/L, and an increase of clustered enlarged megakaryocytes in a bone marrow biopsy material was found to be diagnostic for ET and excluded reactive thrombocytosis (Table 1). In 1975 the minimum criterion for the diagnosis according to the PVSG was 1000×109/L [5], which was reduced to 600×109/L in 1986 [6] as the consequence of two evidence-based studies by Michiels et al. [3] and Van De Pette et al. [7]. Between 1975 and 1980 we applied the 1975 PVSG criteria for the diagnosis of polycythemia vera [6]. Erythrocyte volume (red cell mass RCM) was measured using Cr51 (natriumchromate) labeled autologous erythrocyte [8]. In 1979 Pearson & Wetherley-Mein described idiopathic erythrocytosis (IE) with increased RCM not meeting the A major and B minor PVSG criteria [9] (normal platelet and leukocyte count, no splenomegaly) and absence of any cause for secondary erythrocytosis by good clinical and laboratory practice. Pearson & Wetherley-mein did not use bone marrow biopsy for the diagnostic differentiation between PV and idiopathic erythrocythemia (IE) versus all variants of primary or secondary erythrocytoses (PE and SE) with a specificity and sensitivity of near to 100% [10]. The 1975 PVSG criteria for PV overlook by definition stage 1 PV or idiopathic erythrocythemia (IE) [8]. The frequency of IE is about 10% to 15% at time of PV presentation. In 1979 Pearson and Wetherley-Mein [9] studied 30 IE cases (25 man, 5 women, age 36-77, mean 58 years). All had documented increased RCM, with venous hematocrit from 0.51 to 0.74, platelets from 110-442 (mean 228)×109/L. Two had slight thrombocytosis in excess of 400×109/L, but leukocyte count and leukocyte alkaline phosphatase (LAP) scores were normal (<100). MPD minor criteria for PV according to PVSG criteria did appear in 6 and 4 patients during follow-up within 1 and 2 years and in additional 3 patients within 3,4 and 5 years after diagnosis of IE [7]. Survival related cerebrovascular accidents were responsible for death at hematocrits between 0.52 and 0.57 in 3 untreated IE patients (12%) within 3 and 4 years follow-up. We recognized in 1979 the huge importance to detect the erythrocythemic stage of PV (IE) with increased RCM by the combined use of and bone marrow histology and increased erythrocyte count above 6×10¹²/L [1,2] obviating the need to measure RCM. The RCP modifications in 1980 of the 1975 PVSG criteria for PV include 4 main changes (Table 1) [1,2]. First, the major criterion O2-saturation of >92% is deleted since a bone biopsy differentiates between PV and erythrocytosis. Second; splenomegaly is replaced by bone marrow histology as a major criterion (A3). Third, the RCP diagnostic set used splenomegaly as a minor criterion (Table 1). Fourth, we skipped raised B12 (>900 ng/L) or raised B12 binding capacity (>2200 ng/L) as completely irrelevant for the diagnosis of early and overt stage PV (Table 1). In the second prospective study between 2001 and 2013 we applied the 2008 WHO [11,12], and the 2013 WHO-CMP [13] criteria for the diagnosis and staging of ET and PV (Tables 2 and 3). On top of JAK2V617F mutation screening using the PCR test according to Baxter et al. [14], the diagnostic work-up of ET and PV patients included bone marrow histology for megakaryocyte morphology, serum erythropoietin (EPO) levels, endogenous erythroid colony formation (EEC), red cell mass (RCM) measurement and spleen size on echogram. Bone marrow biopsies from the iliac crest were stained with hematoxylin and eosin for histopathology evaluation. Silver impregnation for the detection of reticulin fibers, and the staining of Masson for objective detection of collagenisation of reticulin fibers were used for grading reticulin fibrosis (RF) [15,16] and for grading of myelofibrosis (MF) [17-19]. Philadelphia chromosome or BCR-ABL fusion protein was excluded in all patients.
| Clinical and molecular criteria ET | Pathological criteria ET |
| Platelet count of >350×109/L Normal hematocrit; male <0.60, female <0.56. Erythrocytes less than 5.8×10¹²/L Presence of JAK2V617F mutation Increased LAP score Low serum EPO level Spontaneous EEC. No or minor splenemegaly on echogram No preceding or allied CML, PV, RARS-T or MDS . ET: presence of JAK2V617F mutation and one or more of all above Clinical ET stage ET.MGM (masked PV) or Iapparent PV (IPV): Borderline or mild anemia Borderline or increased LDH Moderate splenemegaly Post-ET myelofibrosis Massive splenomegaly Anemia, increased CD34+ cells |
Normocellular ET histology Predominant proliferation of enlarged mature megakaryocytes with hyperlobulated nuclei and mature cytoplasm, lacking conspicuous morphological abnormalities. No increase of cellularity, or immaturity of erythropoiesis . Hypercellular ET ET with features of PV: prodromal PV Increased cellularity (60-80%)with due to increased erytropoiesis or trilineage myeloproliferation (75-100% cellularity). Proliferation and clustering of small to giant (pleomorphic) megakaryocytes with hyperlobulated nuclei. ET.MGM histology (PMF histology12) ET with increased cellularity (70-100%) due to chronic megakaryocytic and granulocytic myeloproliferation (MGM) and reduced erythroid precursors (masked PV). Loose to dense clustering of pronounced pleiomorphic megakaryocytes with hyperploid or clumpsy nuclei (not or some cloud-like). Grading of reticulin fibrosis (RF), Reticulin collagen fibrosis (RCF, PVSG13) and myelofibrosis (MF, Thiele et al. [14]) Prefibrotic: RF-0/1=MF-0 Early fibrotic: RF-2=MF-1 Fibrotic: RCF 3=MF-2 Sclerotic: RF 4=MF-3 |
Table 2: Diagnosis and classification of prefibrotic JAK2V617F positive ET according to WHO and European Clinical, Molecular Pathological (WHO-CMP) criteria [1,8,13].
In the period of January 1975 to December 31, 1980, we prospectively studied 30 consecutive early prefibrotic stage MPD patients mean age 56.7 years (range 33-960), 14 ET and 16 PV patients (Table 4) [3]. The clinical features of erythromelalgia caused by platelet-mediated arteriolar inflammation and thrombosis in thrombocythemia of the ET and PTV cases A1 to A24 in Table 3 have been reported in great detail in the Annals of Internal Medicine, 1985 [4]. Spleen size on scan was only slightly increased in 5 of 14 ET and in 11 of 15 evaluable PV patients (Table 4). Leukocyte count counts was increased (>10×109/L) in 3 out of 14 ET patients and in 14 of 16 PV patients. LAP score was increased (>100) in 10 out of 14 ET and in all PV patients. Increase of clustered medium to large (pleomorphic) megakaryocytes was uniformly present in bone marrow smears and biopsies of all 14 ET and 16 PV patients (Figure 1). Bone marrow iron stain was negative in all PV patients (N=16) and in 4 out of 12 evaluable ET patients. A normocellular ET bone marrow histology with increase of clustered pleomorphic megakaryocytes and no increase of cellularity (Figure 1) was seen in 7 of 14 ET and in one of 16 PV patients (Figure 2). A moderate increase of cellularity (1+=60-80%, Table 3) in the bone marrow due to increased erythropoiesis leading to a PV histology was seen in 3 ET and 4 PV patients (Figure 2). A hypercellular PV bone marrow picture with pronounced increase of cellularity (2+=80-100%, Table 3) due to increased erythropoiesis or trilinear hypercellular hematopoiesis (megakaryo/erythro/granulocytic: panmyelosis) [12-14] was seen in 2 of 14 ET patients and in 10 of 16 PV (Figures 1 and 2). These results demonstrate that bone marrow histopathology on its own is not reliable to differentiate between ET and PV. Bone marrow histology clearly differentiates ET and PV from all variants of primary or secondary erythrocytosis and reactive thrombocytosis (in iron deficiency, malignancy, chronic myeloid leukemia and myelodysplastic syndromes) with 100% sensitivity and specificity [8,9]. The morphology of medium to large pleomorphic megakarocytes were not different in ET and PV patients who showed various degrees of increased erythropoiesis (Figures 1 and 2). Two ET patients (A1 and A11, Table 4) with an ET or prodromal PV hypercellular bone marrow picture had borderline to increased RCM (Table 3), which was associated with erythrocytes above 6×10¹²/L, increased LAP score, and a negative bone marrow iron stain (Table 4). Both cases A1 andA11 in Table 3 should be reclassified as PV. The ET case (A6) with an ET bone marrow picture, erythrocyte count of 5.8×10¹²/L, positive bone marrow iron stain and increased LAP score developed PV within 2 years.
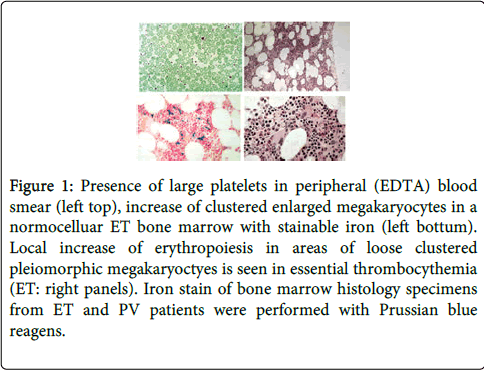
Figure 1: Presence of large platelets in peripheral (EDTA) blood smear (left top), increase of clustered enlarged megakaryocytes in a normocelluar ET bone marrow with stainable iron (left bottum). Local increase of erythropoiesis in areas of loose clustered pleiomorphic megakaryoctyes is seen in essential thrombocythemia (ET: right panels). Iron stain of bone marrow histology specimens from ET and PV patients were performed with Prussian blue reagens.
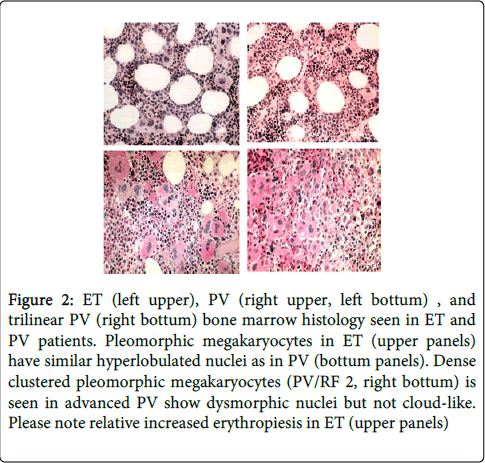
Figure 2: ET (left upper), PV (right upper, left bottum) , and trilinear PV (right bottum) bone marrow histology seen in ET and PV patients. Pleomorphic megakaryocytes in ET (upper panels) have similar hyperlobulated nuclei as in PV (bottum panels). Dense clustered pleomorphic megakaryocytes (PV/RF 2, right bottum) is seen in advanced PV show dysmorphic nuclei but not cloud-like. Please note relative increased erythropiesis in ET (upper panels)
| Clinical and molecular criteria PV | Pathological criteria (WHO) PV |
| Major A 1. Hemoglobin above 18.5 g/dL in men and above 16.5 in women. Hematocrit >0.60 vs >0.56 in male vs female Erythrocytes >5.8×10¹²/L A 2. Presence of JAK2V617F or JAK2 exon 12 mutation, mandatory A 3. Low serum EPO level Minor B 1. Persistent increase of platelet count: grade I: 400-1500, grade II: >1500. B 2. Granulocytes >10×109/l or Leukocytes >12×109/l and/or raised LAP-score in the absence of fever or infection B 3. Splenomegaly on palpation or on ultrasound echogram (>12 cm length in diameter). B 4. Spontaneous endogenous erythroid colony (EEC) formation (optional) |
PV. Bone marrow pathology: increased cellularity (60-80%) due to increased erythropoiesis and megakaryopoiesis or trilinear hypercellular (75-100%) hematopoiesis and clustering of medium to giant (pleomorph) megakaryocytes with hyperlobulated nuclei. Absence of stainable iron. No inflammatory reaction (plasmacytosis, cellular debris) Erythrocytosis. Selective increase of normoblastic erythropoiesis, normal granulopoiesis and megakaryocytes of normal size, morphology of megakaryocytes and no clustering of megakaryocytes in primary or secondary erythrocytosis. Grading of reticulin fibrosis (RF), Reticulin collagen fibrosis (RCF, PVSG [13]) and myelofibrosis (MF, Thiele et al. [14]) Prefibrotic: RF-0/ =MF-0 Early fibrotic: RF-2=MF-1 Fibrotic: RCF 3=MF-2 Post-PV MF: RF 4=MF-3 |
Table 3: WHO and European clinical, molecular and pathological (WHO-CMP) Criteria for the Diagnosis of Polycythemia Vera (PV) and congenital or acquired erythrocytosis [1,8,13].
| Number | Diagnosis | Gender | Spleen | Spleen | Platelets | Hb | Ht | Erythroc | BM iron |
| Age yrs | scan cm | 109/L | mmol/l | 1012/L | stain | ||||
| A1 | ET | F 60 | np | 10.6 | 792 | 10.4 | 0.49 | 6.7 | neg |
| A2 | ET | M 39 | np | 9.8 | 887 | 10 | 0.51 | 6 | pos |
| A3 | ET | F 42 | . | 5 | 911 | 8.9 | 0.47 | 5.4 | pos |
| A4 | ET | M 47 | p | 13.5 | 614 | 8 | 0.39 | 4.5 | - |
| A5 | ET | M 46 | np | 10.5 | 939 | 8.3 | 0.4 | 4.4 | pos |
| A6 | ET | M33 | p | 14.3 | 742 | 9.8 | 0.49 | 5.8 | pos |
| A7 | ET | M 45 | np | 11.2 | 567 | 9.5 | 0.46 | 5.2 | pos |
| A8 | ET | M39 | np | 10.8 | 875 | 8.8 | 0.43 | 4.9 | pos |
| A9 | ET | M51 | np | 11.2 | 690 | 8.8 | 0.45 | 5.5 | pos |
| A10 | ET | M40 | p | 14.4 | 1440 | 8.6 | 0.43 | 4.7 | pos |
| A11 | ET | F 72 | p | 14.8 | 1435 | 9.4 | 0.46 | 6.1 | neg |
| A12 | PTV | M 63 | np | 8 | 1932 | 11.1 | 0.56 | 6.5 | neg |
| A13 | PTV | F 75 | np | . | 1800 | 12.1 | 0.62 | 7.6 | neg |
| A14 | PTVb | M 61 | . | 5 | 952 | 8.3 | 0.45 | 5.6 | neg |
| A15 | PTVb | M 53 | p | 13.1 | 636 | 7.7 | 0.39 | 5.4 | neg |
| A16 | PTV | F 60 | p | 14.5 | 1065 | 13.4 | 0.68 | 7.9 | neg |
| A17 | PTV | F 49 | p | 15.8 | 728 | 10.9 | 0.57 | 7.5 | neg |
| A18 | PTV | M 66 | p | 15.9 | 1035 | 12.2 | 0.64 | 7.1 | neg |
| A19 | PTV | M 71 | p | 15.3 | 1320 | 13.3 | 0.7 | 6.4 | neg |
| A20 | PTV | M 65 | p | 14.9 | 1300 | 11.9 | 0.65 | 7.6 | neg |
| A21 | PTV | F 55 | p | 14.1 | 1085 | 12.1 | 0.61 | 7.1 | neg |
| A22 | PTV | F 59 | p | 12.5 | 708 | 11 | 0.59 | 7.5 | neg |
| A23 | PTV | F 74 | p | 14.4 | 959 | 13.1 | 0.72 | 9.1 | neg |
| A24 | PTV | M 71 | p | 16.6 | 609 | 12.5 | 0.66 | 9.9 | neg |
| B1 | PV/HT | M 50 | p | 2316 | 10.2 | 0.52 | 6.3 | neg | |
| B2 | PV/HT | F 86 | p | 19 | 2975 | 5.3 | 0.32 | 4.4 | neg |
| B3 | ET/HT | M 72 | np | 11.4 | 1503 | 6.3 | 0.31 | 3.5 | pos |
| B4 | ET/HT | F 45 | np | 13.8 | 1074 | 8.1 | 0.41 | 4.6 | neg |
| B5 | ET/HT | M 51 | np | 10.1 | 1080 | 8.3 | 0.42 | 4.9 | - |
| B6 | PV/HT | M 61 | np | 11.4 | 737 | 9.9 | 0.49 | 5.1 | neg |
Table 4A: Clinical and peripheral blood data in 14 ET and 16 PTV patients (Source Michiels Thesis 19811): A1/24 complicated by erythromelalgia and B1/6 hemorrhagic thrombocythemia (HT)
| Number | Leukoc | LAF | RCM Ery | ESR | BM | BM | BM | BM M/E | BM iron |
| 109/L | score | volume | megakar | cellularity | reticuline | ratio | stain | ||
| A1 ET | 10 | 183 | 31 | 2 | 1+ | N | N | 2.1 | neg |
| A2 ET | 9 | 155 | - | 0 | 1+ | N | N | 2.9 | pos |
| A3 ET | 8 | 109 | - | 1 | 2+ | 2+ | 1+ | 3.3 | pos |
| A4 ET | 9 | 101 | - | 4 | - | - | - | ||
| A5 ET | 16 | 128 | 26 | 2 | 1+ | N | N | 3 | pos |
| A6 ET | 7 | 139 | - | 6 | 1+ | N | N | 3.1 | pos |
| A7 ET | 8 | 127 | - | 3 | 1+ | N | N | 2.9 | pos |
| A8 ET | 10 | 38 | - | 3 | 2+ | 1+ | 1+ | pos | |
| A9 ET | 10 | 103 | - | 52 | 1+ | 1+ | 1+ | 3.2 | pos |
| A10 ET | 11 | 60 | - | 5 | 1+ | N | N | 4 | pos |
| A11 ET | 13 | 113 | 32 | 3 | 2+ | 1+ | 2+ | 1.9 | neg |
| A12 PV | 10 | 207 | 59 | 75 | 1+ | 2+ | 1+ | 1.1 | neg |
| A13 PV | 28 | 193 | - | 2 | 2+ | 2+ | N | 1.7 | neg |
| A14 PV | 13 | 236 | - | 4 | 2+ | 2+ | 2+ | 1.1 | neg |
| A15 PV | 11 | 103 | - | 63 | 2+ | 1+ | 1+ | 1.6 | neg |
| A16 PV | 17 | 243 | 45 | 3 | 2+ | 2+ | 1+ | 1.2 | neg |
| A17 PV | 8 | 186 | 60 | 1 | 1+ | 1+ | 1+ | 0.6 | neg |
| A18 PV | 14 | 184 | 63 | 2 | 2+ | 1+ | 1+ | 2.2 | neg |
| A19 PV | 16 | 219 | 50 | 1 | 2+ | 2+ | 1+ | 3.3 | neg |
| A20 PV | 18 | 128 | 38 | 3 | 2+ | 1+ | 1+ | 1.2 | neg |
| A21 PV | 13 | 170 | 43 | 1 | 2+ | 2+ | 2+ | 2.1 | neg |
| A22 PV | 17 | 168 | 42 | 0 | 2+ | 2+ | 2+ | 1.3 | neg |
| A23 PV | 9 | 219 | 54 | 2 | 2+ | 2+ | 1+ | 0.5 | neg |
| A24 PV | 18 | 215 | 82 | 0 | 2+ | 2+ | 1+ | 1.3 | neg |
| B1 HT | 46 | - | - | 0 | 2+ | 2+ | 2+ | neg | |
| B2 HT | 24 | 235 | 38 | 1 | 2+ | 2+ | 2+ | 0.6 | neg |
| B3 HT | 8 | 49 | - | 4 | 2+ | N | 1+ | 2.2 | pos |
| B4 HT | 7 | 105 | - | 7 | 1+ | N | N | 2.5 | neg |
| B5 HT | 10 | 47 | - | 2 | 2+ | 2+ | 2+ | - | |
| B6 HT | 8 | 121 | - | 36 | 1+ | N | 1+ | 1.8 | neg |
Table 4B: Peripheral blood and bone marrow data in 14 ET and 16 PV patients A1/24 complicated by erythromelalgia, and B1/6 hemorrhagic thrombocythemia (HT)
Diagnosis of JAK2V617F positive ET and PV without bone marrow histology
The ages of 10 patients with JAK2V617F mutated MPN in the second prospective study at time of the very first presenting symptoms of migraine-like cerebral ischemic attacks (MIAs) and/or erythromelalgia ranged from 23 to 56 years for ET (n=6) and from 37 to 49 years for PV (n=4). The 6 ET patients had normal values for haemoglobin, haematocrit, red cell mass, and red cell counts below 6×10¹²/L. The four PV patients had increased red cell mass (RCM) and red blood cell counts in excess of 6×10¹²/L (Table 5). One PV and all ET revealed a heterozygous JAK2V617F mutation of less than 40% at time of presentation. The percentage of mutated alleles in two PV cases increased from 25% to 65% in case 8 and from 38% to 71% in case 9 within 5 years follow-up. PV case 10 presented with a homozygous mutation load (75% mutated alleles). The clinical PVSG or WHO diagnoses without the use of bone marrow histology were ET in 6 and PV in 4 patients (Table 5A).
| Case | 1 | 2 | 3 | 4 | 5 | 6 | 7 | 8 | 9 | 10 |
| Age (years) and sex ( F/M) |
56/M | 60/M | 66/F | 47/F | 40/F | 31/F | 50/M | 43/F | 47/F | 38/M |
| Platelets | 575 | 814 | 544 | 553 | 425 | 576 | 397 | 405 | 924 | 384 |
| JAK2V617F * | +/- | +/- | +/- | +/- | +/- | +/- | +/-à+/+ | +/- | +/-à+/+ | ++ |
| Serum EPO | Normal | zero | decreased | decreasd. | nt. | decreased. | zero | decreased | zero | zero |
| Leukocytes x109/l | 6.7 | 5.3 | 12.9 | 8.2 | 6.1 | 6.2 | 7.3 | 14.3 | 13.1 | 8 |
| LAP score (N=<100) | 9nt | 160 | 197 | N | N | 186 | 163 | 263 | 232 | 284 |
| Hemoglobin g/dl | 13.6 | 15.5 | 14.2 | 14.4 | 13.4 | 14 | 18.6 | 17.3 | 16.3 | 17.8 |
| Hematocrit | 0.4 | 0.45 | 0.44 | 0.44 | 0.4 | 0.41 | 0.63 | 0.52 | 0.53 | 0.6 |
| Erythrocytes x1012/L | 4.5 | 5.3 | 4.7 | 4.8 | 4.6 | 4.9 | 6.3. | 6.1 | 7.4 | 6.7 |
| EEC | + | + | + | nt. | nt. | +. | + | + | + | + |
| Red cell mass | 26.7 | 27.1 | NT | 28.1 | NT | 24,9 | 35.7 | 32.0 | 37.5. | 39.7 |
| Spleen, echogram cm | - | 13 | 16 | 13 | 16.5 | 11.8 | 13.7 | 13 | 14.3 | 16 |
| Clinical diagnosis | ET | ET | ET | ET | ET | ET | PV | PV | PV | PV |
| No use of BM |
Table 5A: Clinical and molecular features of 6 ET, and 4 PV patients
| Case | 1 | 2 | 3 | 4 | 5 | 6 | 7 | 8 | 9 | 10 |
| Cellularity | 60% | 70% | 90% | 75% | 80% | 75% | 80% | 65% | 80% | 80% |
| M:E ratio | 1 | 1 | 1 | 0,5 | 4 | 0,7 | 0,7 | 1 | 1.5 | - |
| Myelopoiesis | N | N | ↑ | N | ↑ | N | N | N | ↑ | ↑ |
| Erythropoiesis | ↑ | ↑ | ↑ | ↑ | N | ↑ | ↑ | ↑ | ↑ | ↑ |
| Iron stain | Stainable | Stainable | US | US | US | US | US | US | US | US |
| Fibrosis | MF-0 | MF-1 | MF-0 | MF-0 | MF-0 | MF-0 | MF-0 | MF-0 | MF-1 | MF-0 |
| 2008 WHO diagnosis | ET | ET | ET | ET | MPNuc | ET | PV | PV | PV | PV |
| 2013 WHO-CMP diagnosis | ET1 | ET1 | Pro-PV | Pro-PV | ET.MGM | Pro-PV | PV | PV | PV | PV |
| Follow-up in 2008 | 4 yrs | 12 yrs | 10 yrs | 11 yrs | 15 yrs | 8 yrs | 4 yrs | 1 yr | 5 yrs | 1 yr |
| Diagnosis in 2012 | ET | ET | CHR | PV | EMGM | PV | PV | PV | PV | PV |
| Treatment 2012 | aspirin | aspirin | IFN | HU | no | IFN | Phleb | Phleb | HU | HU |
Table 5B: Bone marrow features of JAK2V617F positive ET in 6 and PV in 4 cases
Diagnosis of JAK2V617F+ ET and PV by bone marrow histology alone
All 10 prefibrotic JAK2V617F mutated MPN patients showed an increase of pleomorphic enlarged megakaryocytes. The morphology of medium to large pleomorphic megakarocytes were not different in the ET and PV patients (Figure 3). Bone marrow cellularity ranged from 60% to 90% with an increased erythropoiesis in 8 and increased myelopoiesis in 3 patients. Seven JAK2V617F mutated MPN patients (Table 5B, 3 ET and 4 PV according to PVSG) fulfilled the histological WHO bone marrow features for PV [11] (Figures 3 and 4). There was no increase of reticulin fibers (Table 4B). Myelofibrosis (MF) was graded as MF 0 in 8 and MF 1 in 2 (Table 5). Based on bone marrow histology alone blindly judged by three expert hematopathologists, the diagnosis in 10 JAK2V617F positive MPN was consistent with ET in 2, ET.MGM in 1, and PV in 7 cases (Table 5B) [13]. The morphology of clustered large pleomorphic megakaryocytes was similar for ET and PV in all 10 JAK2V617F mutated MPN patients and exclude erythrocytosis, reactive thrombocytosis, myelodysplastic syndrome (MDS) and chronic myeloid leukemia (CML) [11-13]. The bone marrow histology in view of the WHO-CMP criteria [13] (Table 4A) was normocellular or slightly hypercellular (<65%) in 2 ET, hypercellular (>75%) due to increased erythropoiesis in 2 prodromal PV, hypercellular due to increased erythopoiesis and granulopoiesis (trilinear) in 1 prodromal PV, and increased granulopoiesis with relatively reduced erythropoiesis in the ET.MGM patient (Figure 3 and Table 5B). The bone marrow was hypercellular (>75%) in 4 PV patients due to increased erythropoiesis in 2 and increased erythropoiesis and granulopoiesis (trilinear PV) in 2 (Table 5B and Figure 3).
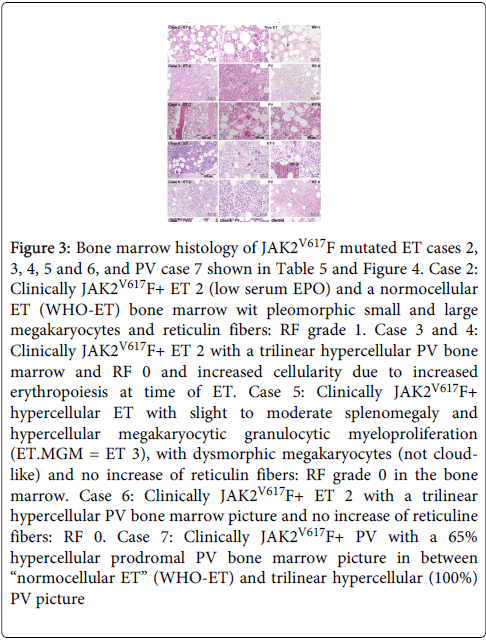
Figure 3: Bone marrow histology of JAK2V617F mutated ET cases 2, 3, 4, 5 and 6, and PV case 7 shown in Table 5 and Figure 4. Case 2: Clinically JAK2V617F+ ET 2 (low serum EPO) and a normocellular ET (WHO-ET) bone marrow wit pleomorphic small and large megakaryocytes and reticulin fibers: RF grade 1. Case 3 and 4: Clinically JAK2V617F+ ET 2 with a trilinear hypercellular PV bone marrow and RF 0 and increased cellularity due to increased erythropoiesis at time of ET. Case 5: Clinically JAK2V617F+ hypercellular ET with slight to moderate splenomegaly and hypercellular megakaryocytic granulocytic myeloproliferation (ET.MGM = ET 3), with dysmorphic megakaryocytes (not cloudlike) and no increase of reticulin fibers: RF grade 0 in the bone marrow. Case 6: Clinically JAK2V617F+ ET 2 with a trilinear hypercellular PV bone marrow picture and no increase of reticuline fibers: RF 0. Case 7: Clinically JAK2V617F+ PV with a 65% hypercellular prodromal PV bone marrow picture in between “normocellular ET” (WHO-ET) and trilinear hypercellular (100%) PV picture
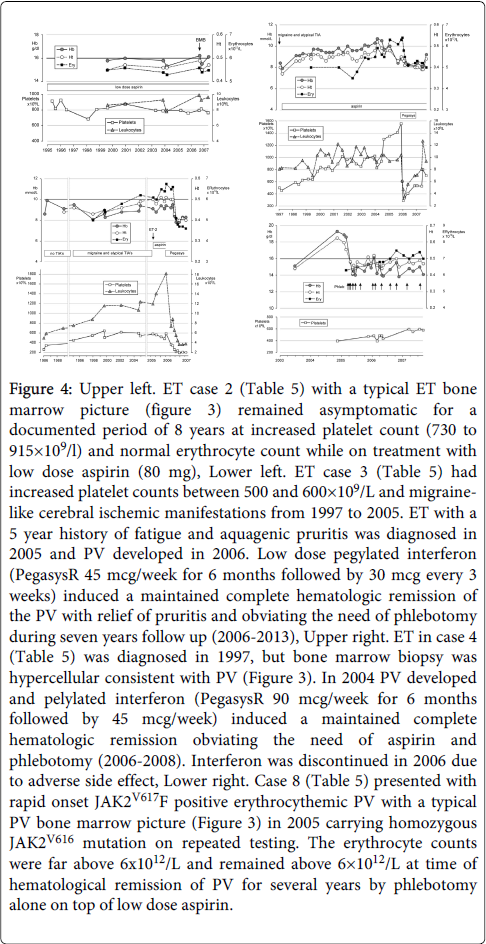
Figure 4: Upper left. ET case 2 (Table 5) with a typical ET bone marrow picture (figure 3) remained asymptomatic for a documented period of 8 years at increased platelet count (730 to 915×109/l) and normal erythrocyte count while on treatment with low dose aspirin (80 mg), Lower left. ET case 3 (Table 5) had increased platelet counts between 500 and 600×109/L and migrainelike cerebral ischemic manifestations from 1997 to 2005. ET with a 5 year history of fatigue and aquagenic pruritis was diagnosed in 2005 and PV developed in 2006. Low dose pegylated interferon (PegasysR 45 mcg/week for 6 months followed by 30 mcg every 3 weeks) induced a maintained complete hematologic remission of the PV with relief of pruritis and obviating the need of phlebotomy during seven years follow up (2006-2013), Upper right. ET in case 4 (Table 5) was diagnosed in 1997, but bone marrow biopsy was hypercellular consistent with PV (Figure 3). In 2004 PV developed and pelylated interferon (PegasysR 90 mcg/week for 6 months followed by 45 mcg/week) induced a maintained complete hematologic remission obviating the need of aspirin and phlebotomy (2006-2008). Interferon was discontinued in 2006 due to adverse side effect, Lower right. Case 8 (Table 5) presented with rapid onset JAK2V617F positive erythrocythemic PV with a typical PV bone marrow picture (Figure 3) in 2005 carrying homozygous JAK2V616 mutation on repeated testing. The erythrocyte counts were far above 6x10¹²/L and remained above 6×10¹²/L at time of hematological remission of PV for several years by phlebotomy alone on top of low dose aspirin.
WHO-CMP diagnoses of JAK2V617 mutated MPNs
The diagnoses according to 2008 WHO criteria12 were ET in 5, MPN unclassifiable in 1, and PV in 4 patients (Table 5B). The diagnoses in 6 JAK2V617F mutated ET according to WHO-CMP10-13 criteria were normocellular ET (WHO-ET) in 2; prodromal PV in 3, and ET.MGM in 1. Prodromal PV is featured by atypical PV bone marrow picture, low serum EPO, the presence of EEC, normal values for hemoglobin, hematocrit, erythrocyte count (<6.0×10¹²/L) and normal red cell mass (Table 5A). In prodromal PV case 3 at time of PV in 2005 the values were hemoglobin 10.6 mmol/L, hematocrit 0.54, erythrocytes 6.4×10¹²/L and RCM 32.7 ml/kg. In prodromal case 4 at time of PV in 2004 the values were hemoglobin 10.5 mmol/L, hematocrit 0.49, erythrocytes 5.8×10¹²/L, and RCM 32 ml/kg. JAK2V617F mutated hypercellular ET patient in case 6 is featured by megakaryocytic-granulocytic myeloproliferation (ET.MGM13) of the bone marrow showed relatively reduced erythropoiesis, reticulin grade zero, and moderate splenomegaly (spleen size on echogram 16 cm, 4 cm below the costal margin). ET.MGM13 is consistent with JAK2V617F positive prefibrotic primary myelofibrosis pPMF-012.
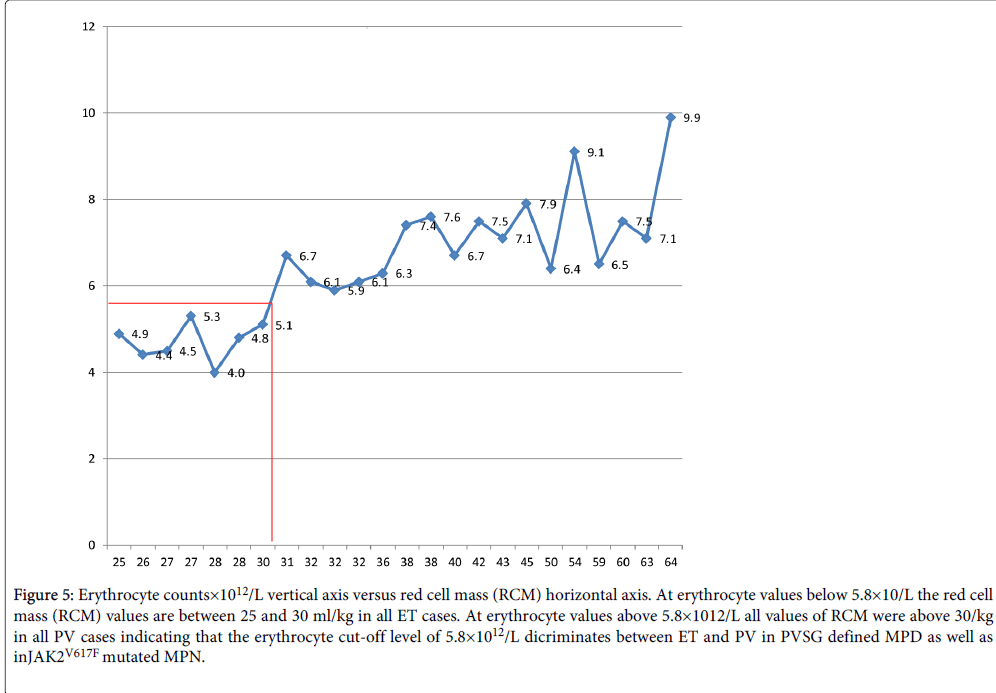
Figure 5: Erythrocyte counts×1012/L vertical axis versus red cell mass (RCM) horizontal axis. At erythrocyte values below 5.8×10/L the red cell mass (RCM) values are between 25 and 30 ml/kg in all ET cases. At erythrocyte values above 5.8×10¹²/L all values of RCM were above 30/kg in all PV cases indicating that the erythrocyte cut-off level of 5.8×10¹²/L dicriminates between ET and PV in PVSG defined MPD as well as in JAK2V617F mutated MPN.
RCM, and red cell counts on top of bone marrow histology discriminates JAK2V617F mutated ET and PV
We assessed the relation between RCM, erythrocyte count and bone marrow histology findings at time of diagnosis (Tables 4 and 5) in 12 ET and 14 PV cases with no or minor splenomegaly at time of PV as compared to the 2008 WHO cut-of levels of hemoglobin (Hb) and hematocrit (Ht) for PV: Hb >18.5 g/dl and Ht >0.60 in men and Hb>16.5 and Ht >0.56 in women for the diagnosis of PV (Table 6) [12,20-24]. At RCM above 30 ml/kg the erythrocytes are above 5.8×10¹²/L in 3 of 10 ET and all 16 PV patients. Of the 10 ET cases, 4 had a typical WHO normocellular bone marrow histology (WHO-ET) and 6 had hypercellular (60-80%) prodromal PV bone marrow histology due to increased erythropoiesis and megakaryopoiesis. Seven ET patients had normal RCM at erythrocyte counts between 4.4 to 5.3×10¹²/L of whom 4 had ET and 3 PV bone marrow histology (Table 6). The morphology of clustered medium to large megakaryocytes in bone marrow smears and biopsies were not different and uniformly present in all 10 ET and 16 PV patients. Bone marrow iron stain was negative in all PV and in 6 out of 10 ET patients (table 6). A normocellular (<60%) WHO-ET bone marrow histology with increased clustered pleomorphic megakaryocytes was seen in 4 of 10 ET patients (Table 6). A PV bone marrow histology with increased cellularity (60-80%) due to increased erythropoiesis was seen in 6 of 10 ET and all 16 PV patients (Table 6). The correlation curves between erythrocyte count, hemoglobin (Hb) or hematocrit (Ht) versus RCM showed the best correlation between erythrocyte counts and RCM (Figure 5).
| ET PV | Age M/F | Hb mmol/L | Ht | Ery×109/L | RCM ml/kg | Hb g/dL | Plt×109/L | WBC×109/L | BM Iron | BM histology |
| 1 ET | 56 M | 8.5 | 0.4 | 4.5 | 27 | 13.6 | 575 | 7 | Pos | ET |
| 2 ET | 46 M | 8.3 | 0.4 | 4.4 | 26 | 13.2 | 939 | 16 | Pos | ET |
| 3 ET | 60 F | 9.7 | 0.45 | 5.3 | 27 | 15.5 | 814 | 7 | Pos | ET |
| 4 ET | 37 M | 8.4 | 0.42 | 4 | 28 | 13.4 | 699 | 18 | pos | ET |
| 5 ET | 58 M | 10 | 0.45 | 5.1 | 30 | 16 | 810 | 10 | neg | PV |
| 6 ET | 47 F | 8.9 | 0.44 | 4.8 | 28 | 16.3 | 553 | 8 | neg | PV |
| 7 ET | 31 F | 8.6 | 0.41 | 4.9 | 25 | 17.8 | 576 | 6 | neg | PV |
| 8 ET | 60 F | 10.4 | 0.49 | 6.7 | 31 | 16.6 | 792 | 10 | neg | PV |
| 9 ET | 72 F | 9.4 | 0.46 | 6.1 | 32 | 15 | 1436 | 13 | neg | PV |
| 10 ET | 44 F | 10.5 | 0.49 | 5.9 | 32 | 16.8 | 1304 | 14 | neg | PV |
| 1 PV | 43 F | 10.8 | 0.52 | 6.1 | 32 | 17.2 | 405 | 14 | neg | PV |
| 2 PV | 50 M | 11.6 | 0.63 | 6.3 | 36 | 18.5 | 397 | 7 | neg | PV |
| 3 PV | 47 F | 10.2 | 0.53 | 7.4 | 38 | 16.3 | 924 | 13 | neg | PV |
| 4 PV | 38 M | 11.1 | 0.6 | 6.7 | 40 | 17.8 | 384 | 8 | neg | PV |
| 5 PV | 63 M | 11.1 | 0.56 | 6.5 | 59 | 17.8 | 1932 | 10 | neg | PV |
| 6 PV | 60 F | 13.4 | 0.68 | 7.9 | 45 | 21.4 | 1065 | 17 | neg | PV |
| 7 PV | 49 F | 10.9 | 0.57 | 7.5 | 60 | 17.4 | 728 | 8 | neg | PV |
| 8 PV | 66 M | 12.2 | 0.64 | 7.1 | 63 | 19.5 | 1035 | 14 | neg | PV |
| 9 PV | 71 M | 13.3 | 0.7 | 6.4 | 50 | 21.2 | 1320 | 16 | neg | PV |
| 10 PV | 65 M | 11.9 | 0.65 | 7.6 | 38 | 19 | 1300 | 18 | neg | PV |
| 11 PV | 55 F | 12.1 | 0.61 | 7.1 | 43 | 19.3 | 1085 | 13 | neg | PV |
| 12 PV | 59 F | 11 | 0.59 | 7.5 | 42 | 17.6 | 708 | 17 | neg | PV |
| 13 PV | 74 F | 13.1 | 0.72 | 9.1 | 54 | 20.9 | 959 | 9 | neg | PV |
| 14 PV | 71 M | 12.5 | 0.66 | 9.9 | 64 | 20 | 609 | 18 | neg | PV |
| 15 ET,PV | 66 F | 9.5 | 0.51 | 6.7 | 33 | 15.2 | 646 | 18 | neg | PV |
| 16 ET,PV | 44 F | 10.5 | 0.49 | 5.9 | 32 | 16.8 | 1302 | 14.5 | neg | PV |
| At RCM above 30 ml/kg (Red) the erythrocytes are above 5.8×10¹²/L (Red). | ||||||||||
| Of 10 ET cases 4 had ET and 6 had PV bone marrow histology (Bold) | ||||||||||
| At erythrocytes above 5..8 × 1012/L Hb ranges from 15.0 to 20.9 and are below WHO criteria in 3 females and 2 males (Blue) | ||||||||||
| At erythrocytes above 5.8×10¹²/L the Ht ranges from 0.46 to 0.72 and are below WHO criteria in 7 females and 1 male (Blue) | ||||||||||
Table 6: The relation between RCM, erythrocyte count and bone marrow histology findings at time of diagnosis (Tables 3 and 4) in 10 ET and 14 PV and in 2 ET cases at transformation into PV as compared to the 2008 WHO cut-of levels of hemoglobin (Hb) and hematocrit (Ht) for PV: Hb >18.5 g/dl and Ht >0.60 in men and Hb>16.5 and Ht >0.56 in women for the diagnosis of PV12
ET and PV patients in the two prospective studies do present similar (typical) ET or PV bone marrow histology pictures pathognomonic for MPN. The megakaryocyte pleomorphic morphology were identical in appearance in symptomatic ET and PV patients. ET versus PV cannot be distinguished on histological grounds from bone marrow biopsies alone indicating the need by the PVSG [8,9,15,16] and WHO [12] investigators to measure red cell mass (RCM) to differentiate between ET and PV8. The two prospective studies demonstrate that increased erythrocyte count at a cutoff level of 5.8×10¹²/L on top of bone marrow histology is the most relevant objective criterion to differentiate ET from PV obviating the need to measure red cell mass (RCM vs red cell counts in Table 5 and Figures 5 and 6) in patients with a proven MPN bone marrow histology (Figures 1-3) with no or minor splenomegaly. The two prospective studies document that histology of pleomorphic megakarocytes and bone marrow cellularity were not different in PVSG?RCP defined ET and PV (Figures 1 and 2) and in JAK2V617F positive WHO-CMP defined normocellular ET, prodromal PV and classical PV patients (Figure 3) [13]. ET with PV features in the bone marrow (prodromal PV) [13] may precede slow onset PV for about 10 years (ET type 2, Figure 3, prodromal PV, Table 5). Slow onset PV differs from acute onset JAK2V617F homozygous PV with a short MPN history (cases 7-10, Table 4, Figures 3, case 8) since 3 of the 4 acute onset PV patients in Table 5 were homozygous for the JAK2V617F as defined by a JAK2V617F allele burden above 50%.
The authors of 2008 WHO criteria for PV stated that the measured RCM could be replaced by a surrogate marker of a hemoglobin (Hb) value above 18.5 g/dL in men and above 16.5 g/dL in women [12]. Four studies showed that WHO defined elevated hemoglobin concentration cannot be used as a surrogate marker for absolute erythrocytosis in PV patients indicating the need by the PVSG and WHO investigators that RCM is mandatory for patients who do not meet the WHO defined crude hemoglobin and hematocrit values [20-23]. In a series of 77 consecutive patients (31 males and 46 females) with PV in the study of Johansson et al., only 35% of male and 63% of female PV patients had Hb values above 18.5 and 16.5 g/dL respectively [20]. The laboratory features at diagnosis of PVSG defined PV and ET patients from a nation-wide survey of 647 patients with MPN disease in Japan are shown in Table 7 [23]. In this study of 266 PV patients with increased red cell mass, erythrocytes counts were in the range of 5.6 to 7.6×10¹²/L (mean 6.61×10¹²/L). All PV patients had increased erythrocytes above the normal value (5.5×10¹²/L) in 100%, whereas hemoglobin was above 18 gm/dL in 50%, hematocrit above 0.55 in 46%, and decreased serum EPO (<3.3µ/mL) in 94% [23]. The corresponding values in 381 PVSG defined ET patients were completely normal for erythrocytes counts 4.74 + 0.79x10¹²/L (range 3.9-5.3×10¹²/L), hemoglobin and hematocrit. It is the degree of erythrocytosis with erythrocyte counts above the normal value (5.5×10¹²/L) that distinguishes PV from ET within the JAK2V617F mutated MPN. The negative iron reserve in PV leads to an insufficient amount of iron for the synthesis of haemoglobin, which result in decreased mean cell volume (MCV) of erythrocytes from above 80 to less than 70 fl and correction of blood volume, but the microcytic red cell counts remained increased PV patients in haematological remission by phlebotomy alone. The PVSG and WHO investigators have overlooked the observations of Dameshek in 1950 and of Michiels in the present study that iron deficiency in PV on treatment with phlebotomy results in small microcytic erythrocytes and correction of blood volume with haemoglobin and hematocrit levels in the normal ranges but the erythrocyte numbers remained increased (above 6.0×10¹²/L, Figure 4). As the mean corpuscular volume of red cells becomes reduced to levels of 70 cubic micron or even less due to the chronic iron deficiency state, the discrepancy between the high red cell count far above 6×10¹²/L and low hemoglobin level becomes increasingly more striking in classical PV (Figure 4) [2,24]. Treatment of PV by phlebotomy alone not only corrects blood volume, hemoglobin and hematocrit values (Figure 4), but also decreases the incidence of major thrombotic complications, and relieves hypervolumemic complaints [9,25,26] with persistence of the coumarin-resistent erythromelalgic microvascular syndrome of associated thrombocythemia [4] indicating the need of low dose aspirin [27,28]. Bone marrow histology alone cannot distinguish JAK2V617F mutated ET, prodromal PV and PV (Figures 2 and 3). Bone marrow histology in JAK2V617F mutated MPN patients in ET and 4 PV patients are featured by clustered pleomorphic large megakaryocytes and the cellularity is increased (60% to 90%) due to dual increased erythropoiesis and granulopoiesis is seen in overt and advanced stages of both ET and PV. A typical PV bone marrow histology with clustered pleiomorphic large megakaryocytes and increased cellularity (60-80%) due to increased erythropoiesis has been observed by Thiele et al. in cases of so-called initial (latent) PV mimicking ET at platelet counts between 600×109/L and 1260×109/L (Table 7) [29]. The laboratory data of 23 cases diagnosed as initial (latent) PV mimicking ET did not meet the PVSG and WHO defined levels of hemoglobin and hematocrit required for diagnosis of PV12, but did meet the WHO-CMP criterion [30] for PV of increased erythrocyte counts above 5.8×10¹²/L in men and above 5.6×10¹²/L in females (Table 3). The present two prospective studies clearly demonstrate that erythrocyte count at a cutoff level of 5.8×10¹²/L in males and 5.6×10¹²/L in females differentiates ET and prodromal PV (Table 2) from classical PV (Table 5, Figure 5) with no or minor splenomegaly obviating the need to measure RCM in JAK2V617F and exon 12 mutated patients. RCM measurement in advanced PV with significant splenomegaly and normal erythrocyte counts, hemogblobin and hematocrit is problematic. Alvarez-Larran et al. measured RCM in 179 JAK2V617F mutated MPN patients with the presumptive diagnosis of PV in whom RCM was increased in 114 and normal in 65 [21]. Red cell count of 6.8×10¹²/L in PV with increased RCM was significantly higher as compared to 5.2×10¹²/L in patients with normal RCM indicative for Inapparent PV (IPV) at the bone marrow level. There was a minor overlap of erythrocyte counts around 5.6-5.8×10¹²/L, but the authors did not perform a sub-analysis whether the iron status and degree of splenomegaly indicative for IPV as the main determinant for increased RCM results, normal erythrocytes and absence of hypervolumenic symptoms in the study of Lamy et al. [31]. Alvarez-Larran did not correct for iron deficiency (phlebotomy) induced microcytosis of erythrocytes that does correct the increased RCM, but the erythrocyte counts remain elevated to values far above 6×10¹²/L (Figure 4). From 1988 to 1994, Lamy et al. measured increased RCM in 103 consecutive PV patients (Table 8) seen in a single center diagnosed as PVSG defined PV in 85 patients with increased hemoglobin (Hb) and hematocrit (Ht) defined, respectively, by Hb >18 g/dL, Ht >0.52 in males and Hb >16 g/dL, Ht >0.47 in females and as Inapparent PV (IPV) in 18 patients (Table 8) [31]. IPV in Table 8 was defined by a normal Hb and Ht value at diagnosis. In the IPV group, the reasons to perform RCM were as follows: splenomegaly associated with increased platelets and/or leucocytes counts (n=8), portal vein thrombosis (n=5), increased platelets or leucocytes counts without splenomegaly (n=3), and isolated splenomegaly (n=2). The two groups were balanced in terms of age, sex, leucocyte, serum iron, and platelet level. Hemoglobin, Ht levels, red cell counts, and plasma volumes were significantly different between the two groups (Table 12). Red cell mass (RCM) was increased in the two groups due to hypervolumemia in PV, but caused by splenomegaly in cases with IPV, who did have normal erythrocyte counts. The combination of increased RCM increased plasma volume, normal erythrocyte count and splenomgaly is typical for Inapparent PV (IPV) as a disease stage in between advanced PV-MF and spent phase PV. In the study of Lamy et al. advanced stage PV was documented in bone marrow biopsies by the presence pronounced erythro/granulo/magakaryocytic hyperplasia with dysmegakaryopiesis, no iron storage and the presence of marrow fibrosis [31]. In our extended experiences since 1975, IPV patients anno 2014 cannot become candidates for phlebotomy because of normal erythrocyte counts and absence of hypervolumemic symptoms, and treatment will hydroxyurea carry the great danger of inducing relative anemia and acceleration of post-PV myelofibrosis indicating the “first line” option of JAK2 inhibitors in IPV.
| A. Laboratory features at diagnosis of PV and ET patients from a nationwide survey of 647 patients with myeloproliferative disease in Japan PVSG diagnosis according to Pearson et al. | |||||
| Number of patients266 | PV | ET | |||
| 266 | 381 | ||||
| Erythrocytes x1012/L | 6.61 + 1.03 (5.6-7.6) | 4.74 + 0.79 (3.9-5.3) | |||
| Hemoglobin g/dL | 18.0 + 2.3 | 13.6 + 1.9 | |||
| Hematocrit % | 55.6 + 6.4 | 41.8 + 5.6 | |||
| Platelets × 109/L | 531 + 332 | 1063 + 434 | |||
| White blood cells × 109/L | 13.5 + 7.3 | 11.3 + 4.2 | |||
| B. Laboratory features of initial PV who did not meet WHO criteria with clustered distribution of pleiomorphic enlarged megakaryocytes in a bone marrow with increased cellualarity (60-80%) diagnosed by Thiele et al. as ET mimicking PV in 23 patients. In retrospect, the erythrocyte counts were above 6×10¹²/L in males and above 5.5 in the majority of females consistent with the diagnosis of prefibrotic PV with no or minor splenomegaly when WHO-CMP criteria are applied ( Table 3) | |||||
| Gender | Initial PV | Normal values | |||
| Erythrocytes × 1012/L | Males Females |
7.2 (6.1–8.6) 6.5 (5.2–7.6) |
4.5 – 5.9 4.0 - 5.5 |
||
| Hemoglobin g/dL | Males Females |
17.8 (17.0–18.3) 15.6 (15.0–16.4) |
13.2-16.4 11.6-15.0 |
||
| Hematocrit, % | Males Females |
53.4 (50.3–60.4) 50.0 (43.0–58.0) |
0.40-0.50 0.35-0.45 |
||
| Leukocytes×109/L Thrombocytes×109/L LAP Spleen palpation cm below costal margin |
14.2 (6.0–17.3) 780 (608–1,260) 193 (85–391) 2.0 (0–3.9) |
4.0-10.0 140-360 10-80 not palpable |
|||
Table 7: Labaratory Features of PV
| Clinical and biological characteristics of the 103 patients | |||||||||||||
| Group A (n=85) | Group B (n=18) | P value | |||||||||||
| Age (yr)* | 61 (27-83) | 52(28-82) | ns | ||||||||||
| Sex | |||||||||||||
| M | 48(56%) | 7(39%) | ns | ||||||||||
| F | 37(42%) | 11(61%) | ns | ||||||||||
| Splenomegaly | 44(52%) | 15(83%) | <0.005 | ||||||||||
| Portal vein thrombosis or Bud-Chiari syndrome | 10(12%) | 6(33%) | <0.02 | ||||||||||
| Number of patients with | |||||||||||||
| Leucocytes > 12×109/L | 31(36%) | 5(28%) | ns | ||||||||||
| Platelets > 500×109/L | 40(47%) | 10(56%) | ns | ||||||||||
| Red blood cell count 109/L | |||||||||||||
| M | 6.2(4.9-7.4) | 5.2(4.7-5.9) | <0.0002 | ||||||||||
| F | 6(4.2-7.35) | 4.7(3.7-5.5) | <0.003 | ||||||||||
| Hemoglobin g/dL* | |||||||||||||
| M | 19.1(17-23.9) | 15.1(13.8-15.7) | <0.01 | ||||||||||
| F | 16.7(15.5-23.9) | 13.7(11.2-15.9) | <0.01 | ||||||||||
| Hematocrit* | |||||||||||||
| M | 0.58(0.52-0.74) | 0.44(0.40-0.49) | <0.0001 | ||||||||||
| F | 0.52(0.47-0.67) | 0.41(0.31-0.46) | <0.001 | ||||||||||
| Red cell mass mL/Kg* | ns | ||||||||||||
| M | 48.2(36.5-60.5) | 43.3(41.1-60.8) | ns | ||||||||||
| F | 40.1(32-59) | 37.3(34-46) | ns | ||||||||||
| Increase/Theoretical norm (%) | +53( ± 26.6) | +51.5( ± 19) | |||||||||||
| plasma volume* | |||||||||||||
| Increase/Theoretical norm | +9.5(-11,+6) | +36.3(+20,+98) | <0.00001 | ||||||||||
| (%) serum iron (µ mol/L)* | 13.2(5-25) | 12.3(4-30) | ns | ||||||||||
Clinical and Biological Characterstics of Group B patients with lnapparent polycythemia vera |
|||||||||||||
| Splenomegaly | PVT | RBC × 109/L | Hb g/dl | HT | RCM ml/kg | WBC × 109 /L | Platelets×109 /L | ECA* | EPO iu/L | LAP Score | |||
| Y | - | 4.39 | 12.5 | 0.37 | 34.2 | 17.3 | 891 | - | 3 | 120 | |||
| Y | Y | 4.94 | 14 | 0.42 | 33.3 | 8.2 | 498 | - | - | 114 | |||
| Y | - | 4.70 | 15 | 0.44 | 35.6 | 9.9 | 692 | - | - | 120 | |||
| Y | Y | 3.90 | 12.1 | 0.36 | 3804 | 6.4 | 442 | 6% | - | 127 | |||
| Y | - | 5.40 | 15.9 | 0.45 | 34 | 8.2 | 920 | - | - | 109 | |||
| Y | Y | 5.50 | 13.7 | 0.40 | 40.5 | 8.9 | 630 | 34% | - | 80 | |||
| Y | - | 4.10 | 11.2 | 0.34 | 43.2 | 11.3 | 940 | - | - | 30 | |||
| Y | Y | 4.90 | 13.3 | 0.40 | 47.3 | 12.1 | 451 | 10% | 7 | 150 | |||
| N | - | 5.20 | 15.2 | 0.45 | 40.2 | 11.2 | 546 | 21% | 5 | 110 | |||
| Y | - | 4.70 | 14 | 0.46 | 46 | 9.1 | 284 | 5% | 4 | 155 | |||
| N | - | 4.63 | 13.7 | 0.41 | 34 | 8.7 | 581 | - | 5 | - | |||
| Y | Y | 5.50 | 14.9 | 0.45 | 50 | 8.3 | 200 | 10% | 5 | 30 | |||
| Y | Y | 5.37 | 15.5 | 0.46 | 43.3 | 5 | 168 | 8% | 5 | 112 | |||
| N | - | 5.20 | 15.1 | 0.44 | 43 | 12.7 | 1400 | - | 5 | - | |||
| Y | - | 4.80 | 13.8 | 0.40 | 42.1 | 7.8 | 879 | - | - | 110 | |||
| Y | - | 5.20 | 15 | 0.44 | 45.9 | 14.1 | 207 | - | - | - | |||
| Y | - | 4.70 | 14.2 | 0.41 | 41.1 | 2.3 | 530 | 9% | 16 | - | |||
| Y | - | 5.90 | 15.7 | 0.49 | 60.8 | 34 | 496 | - | 5 | - | |||
Table 8: Comparion of clinical and laboratory features between PVSG defined PV(Group A) and inapparent PV (IPV, Group B) in the study of Lamy et al. [31]. Splenomegaly on palpation. PVT=portal vein thrombosis, RCM=red cell mass, ECA=erythroid colony assay. In retrospect there are 2 cases with splenomegaly and low LAP score and therefore likely of JAK2 wild type. Three cases with borderline low or decreased Hb (<12.5 g/dL) and Ht (<0.37) with splenomegaly had increased RCM