Journal of Geology & Geophysics
Open Access
ISSN: 2381-8719
ISSN: 2381-8719
Research Article - (2024)Volume 13, Issue 4
The study area is underlain by sedimentary basin of Ondo State, which underlain by the Coastal Alluvium, Coastal Plain sands, Imo Shale group, Upper Coal measures and Nkporo Shale, geophysical investigation was carried out at Irele in Ondo south in Irele local government to determine the structural competence of the subsurface geological strata for building construction and other foundation purposes, using Vertical Electrical Sounding (VES) survey technique of the electrical resistivity method. With a view to investigations the image of the subsurface geology, to characterize the soils in terms of their engineering geological properties in view of determining their suitability for building the foundation and assessing the two methods in determine building foundation requirements in the study areas. Twenty Vertical Electrical Soundings (VES) were quantitatively interpreted using the partial curve matching technique and computer assisted 1-D forward modeling were conducted for the geophysical survey using electrical resistivity method. From the result of the survey, four or five major layers have been established within the study area for building construction purposes and have been recommended for bungalows and other forms of low rising buildings. The cracks on walls of the buildings within them campus have been attributed to either the inability of the engineers to dig the foundation to the required depth or the construction of heavier structures on very weak subsurface layers which triggered off movement.
Geoelectrical; Evaluation; Subsurface; Building foundation; Consideration
Investigation and consideration of proposed site(s) for foundation purposes by geophysicists, engineering and geologists provides subsurface information that assists the building professionals in the choice and design of civil engineering structures. A building construction at a site without proper investigation and consideration of the underground geological strata or its load bearing capacity may settle excessively or differentially, which causes development of cracks in the building which may ultimately leads to foundation failure and collapse of the building. Subsurface geological features such as fractures, voids and nearness of water table to the surface are among the inconveniences which have been identified to pose considerable constraints to building foundation constructions especially to their foundation. A number of geophysical techniques are available which enables an insight in obtaining a rapid nature of the underground strata or its load bearing capacity. Although these methods do not serve as a substitute for geotechnical investigations of the subsurface or geochemical investigation, they render quick and cheap preliminary approach to harnessing information about the subsurface layers [1].
Among the known geophysical techniques, the electrical resistivity method has found favour in the sight of many authors for application in engineering studies, environmental assessment and hydro-geological investigation. Electrical resistivity method is based on the response of the result or output of the earth to the flow of electrical current. Artificially generated electric currents are introduced into the ground and the resulting potential differences are measured at the surface [2].
All materials, including soil and rocks, have an intrinsic property resistivity that governs the relation between the current density and the gradient of the electrical potential.
Beside architectural factors, foundation cracks on building commonly occur due to resultant differential movements in the subsurface. Building foundation design is crucial for structural stability and longevity. In sedimentary regions like Ondo State, understanding the geotechnical properties of the subsoil is essential due to the potential variability in soil composition and characteristics.
Geoelectrical methods, particularly VES, offer a noninvasive approach to evaluate these properties. Some buildings within the United Grammar School (UGS) have their walls cracked already only few years after construction (Figures 1 and 2) [3].
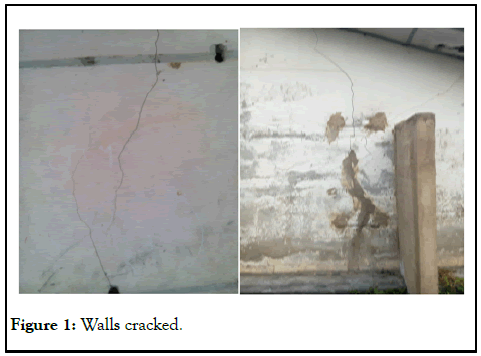
Figure 1: Walls cracked.
Development of the site started without any form of subsurface investigation (whether geotechnical or geophysical), hence, the remote cause of the cracks could not be inferred. In order to ascertain the causes of such structural failure, a geophysical investigation was carried out with the aim of determining depth to stable geoelectrical layers which are geotechnically suitable for foundation purposes (Figure 2) [4].
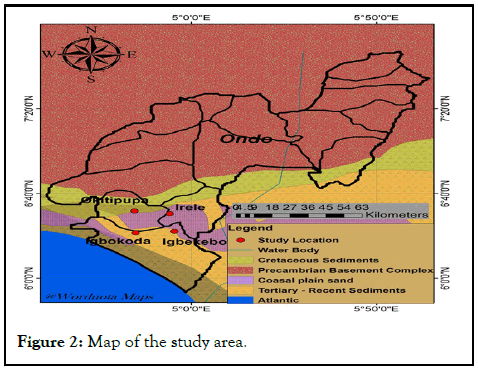
Figure 2: Map of the study area.
Study area
The research covers various sedimentary areas in Ondo state, known for diverse soil compositions ranging from sandy to clayey materials [5].
Geophysical survey
Vertical Electrical Sounding (VES) known as employing Schlumberger array configuration, VES surveys were conducted at multiple sites to measure subsurface resistivity variations. Equipment involves resistivity meter, electrodes and cables.
Data collection
Systematic VES surveys with electrode spacings ranging from 1 to 100 meters. Data were collected and recorded for different depths to construct resistivity profiles.
Data interpretation
Inversion of VES data to generate resistivity models. Correlation of resistivity values with soil types and geological formations. Identification of key geoelectrical layers relevant for foundation design, such as topsoil, weathered layer, and bedrock [6].
Vertical Electrical Sounding (VES) were conducted for the geophysical survey using electrical resistivity carried out along ten traverses in each location and a total of twenty traverses were carried out in the locations. Twenty vertical electrical sounding stations were acquired at different points along the ten traverses, on each traverse two vertical electrical sounding was carried out. The geodetic system of coordinates was obtained using the Garmin 12 global positioning system. The Schlumberger current electrode separation (AB) was varied from a minimum of 2.0 m to a maximum ranging from about 160 m to 220 m at the VES locations. The direction of the electrode spread of the VES points is in the North-South and West-East direction. The VES was interpreted manually and systematically using WinRes software with a maximum RMS error of 1.3-2.6. Their curve types are between QH, KH, KQ, QHK, KQH and HKH having four to five layers [7].
Some typical resistivity curves from the locations are shown in Figures 3-5. A summary of the interpreted VES results with inferred lithology from the locations is presented as Table 1.
Foundation design implications: Recommendations for shallow foundations in high resistivity areas. Consideration of pile foundations or soil stabilization methods in low resistivity regions [8].
Geotechnical correlation: Comparison with standard geotechnical tests (e.g., SPT, CPT) to validate geoelectrical findings. Integration of geoelectrical data with traditional soil mechanics to enhance foundation design accuracy.
Resistivity profiles: Identification of multiple subsurface layers with varying resistivity values. Typical resistivity ranges for sandy soils (100 Ωm-300 Ωm), clayey soils (10 Ωm-100 Ωm) and bedrock (>300 Ωm).
Soil competence: High resistivity areas indicating potential zones of competent subsoil for shallow foundations. Low resistivity zones suggesting the presence of clay or water-saturated soils, necessitating deeper foundations or soil improvement techniques [9].
Geoelectrical sections: Construction of geoelectrical sections along various profiles showing the spatial distribution of subsoil layers. Correlation with known geological formations and existing bore-hole data for validation (Figures 3-5 and Table 1).
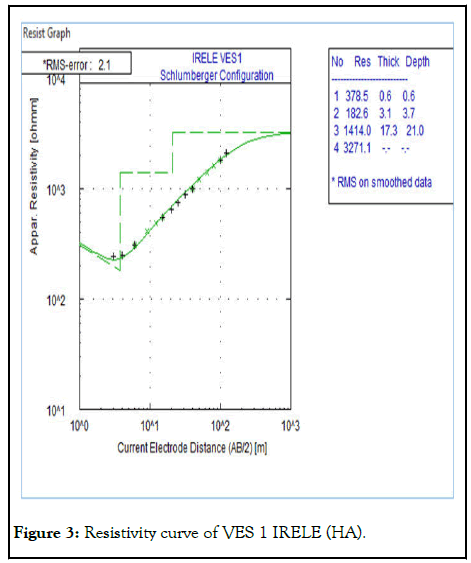
Figure 3: Resistivity curve of VES 1 IRELE (HA).
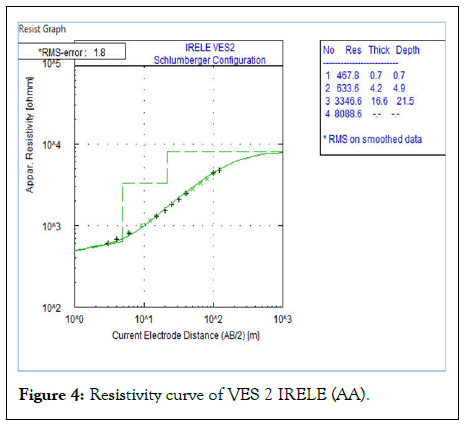
Figure 4: Resistivity curve of VES 2 IRELE (AA).
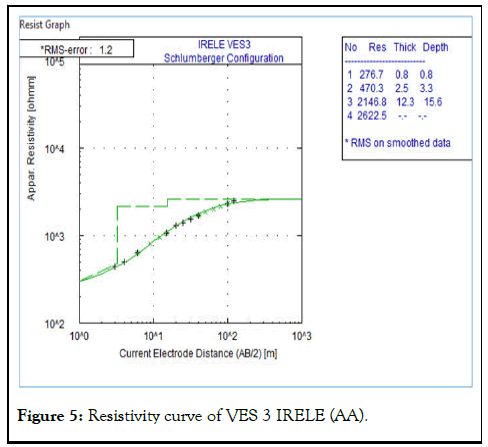
Figure 5: Resistivity curve of VES 3 IRELE (AA).
| Ves no. | Layers | Resistivity (Ωm) | Thickness (m) | Depth (m) | Curve type | Lithology |
|---|---|---|---|---|---|---|
| IRELE | ||||||
| 1 | 1 | 378.5 | 0.6 | 0.6 | HA ρ1<ρ2<ρ3<ρ4 |
Topsoil |
| 2 | 182.6 | 3.1 | 3.7 | Clay | ||
| 3 | 1414 | 17.3 | 21 | Clayey sand | ||
| 4 | 3271.1 | - | - | Sand/Sandstone | ||
| 2 | 1 | 467.8 | 0.7 | 0.7 | AA ρ1<ρ2<ρ3<ρ4 |
Topsoil |
| 2 | 633.8 | 4.2 | 4.9 | Sandy clay | ||
| 3 | 3346.6 | 16.6 | 21.5 | Clayey sand | ||
| 4 | 8088.6 | - | - | Sand/Sandstone | ||
| 3 | 1 | 276.7 | 0.8 | 0.8 | AA ρ1<ρ2<ρ3<ρ4 |
Topsoil |
| 2 | 470.3 | 2.5 | 3.3 | Sandy clay | ||
| 3 | 2146.8 | 12.3 | 15.6 | Clayey sand | ||
| 4 | 2622.5 | - | - | Sand/Sandstone | ||
| 4 | 1 | 531.2 | 0.6 | 0.6 | HK ρ1>ρ2<ρ3>ρ4 |
Topsoil |
| 2 | 509.2 | 2.1 | 2.7 | Sandy clay | ||
| 3 | 5368.1 | 38.4 | 41.1 | Sand/Sandstone | ||
| 4 | 165.2 | - | - | Clay | ||
| 5 | 1 | 328.8 | 0.6 | 0.6 | AAK ρ1<ρ2<ρ3<ρ4>ρ5 |
Topsoil |
| 2 | 351.6 | 2.2 | 2.9 | Clay | ||
| 3 | 1406.3 | 7.9 | 10.8 | Sandy clay | ||
| 4 | 3662.7 | 29.7 | 40.4 | Sand/Sandstone | ||
| 5 | 736 | - | - | Clayey sand | ||
| 6 | 1 | 352 | 0.8 | 0.8 | AAK ρ1<ρ2<ρ3<ρ4>ρ5 |
Topsoil |
| 2 | 974.1 | 4 | 4.8 | Sand | ||
| 3 | 2128.8 | 7.4 | 12.2 | Sandy clay | ||
| 4 | 2944 | 35.2 | 47.4 | Clay sand | ||
| 5 | 1033.6 | - | - | Sand | ||
| 7 | 1 | 557.6 | 0.8 | 0.8 | AA ρ1<ρ2<ρ3<ρ4 |
Topsoil |
| 2 | 1512.2 | 3.4 | 4.2 | Sandy clay | ||
| 3 | 1769 | 18.8 | 23 | Clayey sand | ||
| 4 | 2301.6 | - | - | Sand | ||
| 8 | 1 | 541.6 | 0.7 | 0.7 | AA ρ1<ρ2<ρ3<ρ4 |
Topsoil |
| 2 | 763.2 | 3.7 | 4.4 | Clay | ||
| 3 | 1756.9 | 14.4 | 18.8 | Clayey sand | ||
| 4 | 4721.6 | - | - | Sand/Sandstone | ||
| 9 | 1 | 139.5 | 0.7 | 0.7 | AA ρ1<ρ2<ρ3<ρ4 |
Topsoil |
| 2 | 663 | 3.8 | 4.5 | Clay | ||
| 3 | 1483.9 | 14.3 | 18.8 | Clayey sand | ||
| 4 | 4068 | - | - | Sand/Sandstone | ||
| 10 | 1 | 160.5 | 0.6 | 0.6 | AAK ρ1<ρ2<ρ3<ρ4>ρ5 |
Topsoil |
| 2 | 458.2 | 2.7 | 3.3 | Clay | ||
| 3 | 1235.6 | 8.2 | 11.6 | Clayey sand | ||
| 4 | 3127.2 | 45.6 | 57.6 | Sand/Sandstone | ||
| 5 | 577.1 | - | - | Clay | ||
| 11 | 1 | 143.6 | 0.7 | 0.7 | AA ρ1<ρ2<ρ3<ρ4 |
Topsoil |
| 2 | 520.5 | 4.1 | 4.8 | Clay | ||
| 3 | 837.9 | 16.2 | 21.1 | Clayey sand | ||
| 4 | 2339.1 | - | - | Sand/Sandstone | ||
| 12 | 1 | 561.9 | 0.7 | 0.7 | AAK ρ1<ρ2<ρ3<ρ4>ρ5 |
Topsoil |
| 2 | 444.2 | 1.9 | 2.5 | Clay | ||
| 3 | 939.5 | 16.4 | 19 | Clayey sand | ||
| 4 | 3952.8 | 36 | 54.9 | Sand/Sandstone | ||
| 5 | 413.4 | - | - | Clay | ||
| 13 | 1 | 181.3 | 0.8 | 0.8 | AA ρ1<ρ2<ρ3<ρ4 |
Topsoil |
| 2 | 500 | 3.9 | 4.7 | Clay | ||
| 3 | 1179.8 | 18.1 | 22.8 | Clayey sand | ||
| 4 | 2168.6 | - | - | Sand/Sandstone | ||
| 14 | 1 | 628.7 | 0.5 | 0.5 | HKH ρ1>ρ2<ρ3>ρ4<ρ5 |
Topsoil |
| 2 | 323.1 | 2.4 | 2.9 | Clay | ||
| 3 | 1145.7 | 19.8 | 22.7 | Clayey sand | ||
| 4 | 282.3 | 19.8 | 42.5 | Clay | ||
| 5 | 5189 | - | - | Sand/Sandstone | ||
| 15 | 1 | 367 | 0.7 | 0.7 | AA ρ1<ρ2<ρ3<ρ4 |
Topsoil |
| 2 | 760.3 | 4.1 | 4.8 | Clay | ||
| 3 | 2433.7 | 13.8 | 18.5 | Clayey sand | ||
| 4 | 5941.7 | - | - | Sand/Sandstone | ||
| 16 | 1 | 415.5 | 0.8 | 0.8 | AA ρ1<ρ2<ρ3<ρ4 |
Topsoil |
| 2 | 1546.6 | 3.8 | 4.6 | Sandy clay | ||
| 3 | 3023.9 | 12.7 | 17.3 | Clayey sand | ||
| 4 | 7015.2 | - | - | Sand/Sandstone | ||
| 17 | 1 | 383.9 | 0.6 | 0.6 | HA ρ1>ρ2<ρ3<ρ4 |
Topsoil |
| 2 | 169.4 | 1 | 1.6 | Clay | ||
| 3 | 969.3 | 15.7 | 17.3 | Sandy clay | ||
| 4 | 5709.8 | - | - | Clayey sand | ||
| 18 | 1 | 414.4 | 0.7 | 0.7 | AKH ρ1<ρ2<ρ3>ρ4<ρ5 |
Topsoil |
| 2 | 1493.5 | 5.3 | 6 | Sandy clay | ||
| 3 | 2739.4 | 11 | 17.1 | Clayey sand | ||
| 4 | 1201.7 | 35.8 | 52.9 | Sandy clay | ||
| 5 | 10022.4 | - | - | Sand/Sandstone | ||
| 19 | 1 | 298.8 | 0.6 | 0.6 | AA ρ1<ρ2<ρ3<ρ4 |
Topsoil |
| 2 | 325 | 2.2 | 2.8 | Clay | ||
| 3 | 1348.2 | 16 | 18.8 | Sandy clay | ||
| 4 | 5016.1 | - | - | Sand/Sandstone | ||
| 20 | 1 | 545.4 | 0.7 | 0.7 | AA ρ1<ρ2<ρ3<ρ4 |
Topsoil |
| 2 | 1419.2 | 4.9 | 5.6 | Sandy clay | ||
| 3 | 2516.5 | 11.5 | 17.1 | Clayey sand | ||
| 4 | 3850.3 | - | - | Sand/Sandstone | ||
Table 1: Summary of interpreted VES results.
Geoelectric section along AA' (IRELE)
Figure 6 consists of VES (1 and 2). The section reveals four subsurface layers namely top soil, clay, clayey sand, sandy clay and sand/sandstone. The topsoil is characterized by resistivity values ranging from 378.5 Ωm to 467.8 Ωm and layer thickness of 0.6 m to 0.7 m. The second layer in VES 1 denotes clay with resistivity value of 182.6 Ωm and layer thickness of 3.1 m while the clay is replaced with sandy clay in VES 2 having resistivity and layer thickness value of 633.8 Ωm and 4.2 m respectively [10]. The third stratum depicts clayey sand with resistivity values ranging from 1414.0 Ωm to 3346.6 Ωm with a layer thickness of 16.6 m to 17.3 m. The fourth horizon is symptomatic of sand/ sandstone with resistivity values ranging from 3271.1 Ωm to 8088.6 Ωm but their layer thickness could not be determined due to current terminated at this region. The clay, clayey sand and sandy clay represent bad material that cannot withstand engineering structures or building while that of sand/sandstone is a good engineering material for engineering structures or building (Figure 6) [11].
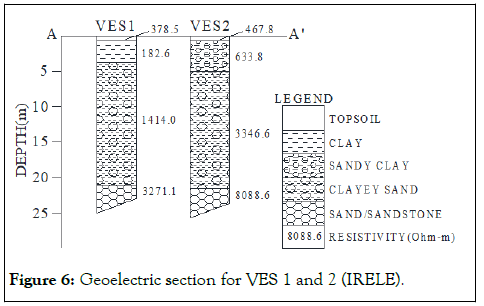
Figure 6: Geoelectric section for VES 1 and 2 (IRELE).
Geoelectric section along BB' (IRELE)
Figure 7 consists of VES (3 and 4). The section reveals four subsurface layers namely top soil, clay, clayey sand, sandy clay and sand/sandstone.
The topsoil is characterized by resistivity values ranging from 276.7 Ωm to 531.2 Ωm and layer thickness of 0.6 to 0.8 m. The second layer connotes sandy clay with resistivity values ranging from 470.3 Ωm to 509.2 Ωm and layer thickness of 2.1 m to 2.5 m [12]. The third substratum layer in VES 3 depicts clayey sand with resistivity value of 2146.8 Ωm with a layer thickness of 12.3 m while the clayey sand is replaced with sand/sandstone in VES 4 having resistivity and layer thickness value of 5368.1 Ωm and 38.4 m respectively. The fourth horizon in VES 3 is representative of sand/sandstone with resistivity value 2622.5 Ωm but the layer thickness could not be determined due to current terminated at this region. While the sand/sandstone is replaced with clay in VES 4 having a resistivity value of 165.2 Ωm but the layer thickness could not be determined due to current terminated in this zone. The clay, clayey sand and sandy clay represent bad material that cannot withstand engineering structures or building while that of sand/sandstone is a good engineering material for engineering structures or building (Figure 7) [13].
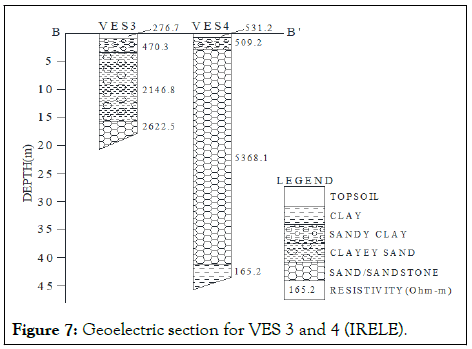
Figure 7: Geoelectric section for VES 3 and 4 (IRELE).
Geophysical and geotechnical studies were integrated to characterize the subsoil within the proposed residential buildings located at Irele, Igbekebo, Igbokoda and Okitipupa, Ondo State, Southwestern Nigeria. A total of eighty (80) VES data were acquired, processed and interpreted from the four (4) study areas with twenty (20) VES from each location to reveal the vertical subsurface characterizations in terms of the geoelectric parameters. Ten (10) traverses were occupied in each of the four (4) study locations to produce the 2D resistivity structures which reveal the spatial distributions of subsurface resistivity of the geologic materials respectively. The VES reveal four to five geoelectric layers or subsurface zones in Irele area, which are indicative of topsoil, clay, clayey sand, sandy clay, sand and sand/sandstone.
At Irele area, the resistivity and thickness of the topsoil vary from 139.5-628.7 Ωm and 0.5-0.8 respectively, clayey sand (736.0 Ωm-5709.8 Ωm and 8.2 m-35.2 m), clay (165.2 Ωm-944.8 Ωm and 1.0 m-19.8 m), sandy clay (470.3 Ωm-2128.8 Ωm and 2.1 m-35.8 m), sand in VES 6 (974.1 Ωm and 4.0 m) while the sand in VES 6 and VES 7 (1033.6 Ωm-2301.6 Ωm) the thickness of the sand could not be determined because the probing current terminated in that zone and sand/sandstone in VES 1, 2, 3, 5, 8, 9, 11, 13-20 (2168.6 Ωm-10022.4 Ωm). In Irele, the thickness of the sand/sandstone zone could not be determined because the probing current terminated in that region. The geoelectrical evaluation provides a comprehensive understanding of the subsoil properties in the sedimentary areas of Ondo State, crucial for informed foundation design. High resistivity zones are suitable for shallow foundations, while areas with lower resistivity require additional geotechnical considerations.
[Crossref] [Google Scholar] [PubMed]
Citation: Ezomo FO (2024) The Geoelectrical Evaluation of Subsoil for Building Foundation Design Considerations in Sedimenyary of Ondo State. J Geol Geophys. 13:1180.
Received: 18-Nov-2019, Manuscript No. JGG-23-2723; Editor assigned: 21-Nov-2019, Pre QC No. JGG-23-2723 (PQ); Reviewed: 05-Dec-2019, QC No. JGG-23-2723; Revised: 22-May-2024, Manuscript No. JGG-23-2723 (R); Published: 19-Jun-2024 , DOI: 10.35248/2381-8719.24.13.1180
Copyright: © 2024 Ezomo FO. This is an open-access article distributed under the terms of the Creative Commons Attribution License, which permits unrestricted use, distribution, and reproduction in any medium, provided the original author and source are credited.