Anatomy & Physiology: Current Research
Open Access
ISSN: 2161-0940
+44 1300 500008
ISSN: 2161-0940
+44 1300 500008
Research Article - (2019)Volume 9, Issue 3
The cardiovascular systems of terrestrial and aquatic snakes cannot accommodate gravitational gradients, while blood flow in arboreal snakes is not disrupted by tilting. Alligators have a very dynamic cardiovascular system, with multiple means of active regulation; however, the response of alligators to gravitational gradients has never been documented. Gravitational gradients were induced by rotating sub-adult specimens of the American alligator (Alligator mississippiensis) between 45° head-up to 45° head-down in 15° increments. Intracranial pressure was assayed by quantifying the diameter of the optic nerve sheath using ocular ultrasonography; each increment of head-up rotation produced a significant decrease in nerve sheath diameter, while head-down rotations resulted in corresponding significant increases in nerve sheath diameter. Vascular ultrasonography revealed a consistent pattern. Head-down rotation resulted in vasodilation of the carotid artery and jugular vein, and head-up rotation resulted in a decrease in the luminal area of these vessels. In contrast to these manifestations of orthostatic pressure gradients, instantaneous heart rate (determined by EKG) revealed no evidence for a barostatic reflex in A. mississippiensis. This is the first report from a non-mammalian vertebrate of how intracranial pressure varies under gravitational gradients. The alligator has a unique response to gravitational gradients, characterized by the lack of a barostatic reflex.
Alligator; Cranial fluids; Snakes; Baroreflex; Cardiac physiology; Bradycardia
The cranial fluids of vertebrate animals include the arterial blood, venous blood, and the cerebrospinal fluid. The dynamic balance between these three fluids is well known. Arterial blood pressure in the choroid plexus generates cerebrospinal fluid [1], and intracranial pressure leads to fluid loss from the cerebrospinal fluid to the cerebral venous plexus [2]. In humans and other mammals, the cranial balance among these three fluids can be altered by orthostatic pressures; head-down postures can elevate arterial blood pressure, venous blood pressure, and intracranial pressure and elevation of the head can reduce arterial perfusion, venous blood pressure, and intracranial pressure [3,4]. Orthostatic transitions can also produce marked changes in the venous luminal area, best known in the “collapse” of the jugular veins during head elevation [5]. The same basic pattern of orthostatic response likely occurs in all terrestrial vertebrates [6]; however, relatively little experimental work has been done on non-mammalian vertebrates.
Their elongated limbless body makes snakes good subjects for studies of orthostatic tolerance [7,8]. Arboreal snakes exhibit little cardiovascular response to gravitational gradients. In terrestrial snakes, however, gravitational gradients produce marked changes in arterial pressure and even in the direction of arterial blood flow [9-11]. Aquatic snakes have an orthostatic response similar to that of terrestrial snakes [12]. Gravitational gradients also influence heart rate in snakes; head-up posturing induces tachycardia [13,14]. Unlike most vertebrates, snakes do not exhibit bradycardia during diving [15]. The orthostatic vascular response in snakes has been well documented; however, the underlying physiology (i.e., the baroreflex) remains poorly known [16].
The cardiac physiology of crocodilians such as the American alligator (A. miississippiensis), includes active regulation capable of producing different blood flow patterns through the heart and arteriole trunks [17-19]. Alligators are truly amphibious and thus would likely exhibit a response to gravitational gradients that is similar to that of aquatic and terrestrial snakes, rather than to the specialized arboreal serpents. In contrast to the physiological studies of the crocodilian heart, attempts to document the heart rate of crocodilians have yielded few clear results. Differing levels of bradycardia (and absent bradycardia) have been reported in studies of crocodilians during voluntary and forced dives [20,21]. One complicating factor underlying this variation seems to be changed in the subject’s heart rate due to the relative proximity of the investigator [22]. This response is also not well understood, as both tachycardia and bradycardia have been attributed to investigator influences [23]. Bradycardia has been reported during both tonic immobility in A. mississippiensis and death-feigning in the Eastern hognose snake (Heterodon platyrhinos). In both species, the cessation of the behavior is immediately preceded by a period of tachycardia [24,25]. There is chemical evidence for a barostatic response in alligators [26], but the full basis of the baroreflex remains unclear [27].
Intracranial pressure can be measured using direct (invasive) and indirect (non-invasive) methods [28]; among the latter, optic nerve sheath diameter assessment using ultrasonography combines a superior ability to detect elevated intracranial pressure with ease of use [29]. The relatively large size (among reptiles) of the alligator eye affords the potential to apply ocular ultrasonography to measure intracranial pressure. The present study was undertaken to quantify the influence of gravitational gradients on intracranial pressure, heart rate, and the vascular luminal area of A. mississippiensis.
Live animals
Five live sub-adult (165-183 cm total length) American alligators (Alligator mississippiensis) were obtained from the Louisiana Department of Wildlife and Fisheries. The animals were housed communally in a 29 m2 facility that featured three submerging ponds, natural light, and artificial lights on a 12:12 cycle. The facility was maintained at 30-33°C, warm water rain showers were provided every 20 minutes, which helped maintain the facility at >75% relative humidity. The alligators were maintained on a diet of previously frozen adult rats. When the Individual animals were removed from the enclosure, they were caught by noosing, their jaws were taped shut using vinyl tape, and their forelimbs and hindlimbs were taped in a retracted position. The husbandry and use of the live alligators followed all applicable federal guidelines, and methods were approved by the IACUC of A.T. Still University (Protocol #209, approved 21 March 2018).
Gravitational gradients
Each specimen, un-anesthetized and bound as described above, was placed on a stiff board (244 × 28 × 3.8 cm thick) that exceeded the maximum width and length of the alligators used for this study. Six 2.5-cm-wide heavy-duty straps (Northwest Tarp and Canvas, Bellingham, WA) were used to secure the alligator to the board. The straps were tight enough to minimize the movement of the animal but not tight enough to impede ventilation or circulation. The board was anchored to a rotating spindle machined to have, in addition to a stable horizontal stop, fixed “stops” at 15°, 30°, and 45° above and below the horizon.
EKG recordings
Two silver chloride surface cup electrodes (019-477200, GRASS, Natus Medical, Pleasanton, CA), coated with a layer of conducting gel (Signagel, Parker Laboratories, Fairfield, NJ) were placed on the ventral surface of the animal, on either side of the heart. The electrodes were connected to a preamplifier (P511, GRASS) and the EKG signal was recorded (at 1.0 kHz) using a MiDAS (Xcitex Inc., Woburn, MA) data acquisition system.
To document longer responses to gravitational gradients, fourminute trials were conducted. Each trial consisted of 30 s in the horizontal position, 120 s in the rotated position, then 90 s in the horizontal position. The direction and magnitude of the rotated position were determined by the roll of a die. The alligator was held in the horizontal position for a minimum of 3 minutes between trials. To document shorter responses to gravitational gradients, and particularly to document evidence of a barostatic reflex, 90 s trials were performed with each trial divided into equal initial horizontal, rotated, and final horizontal positions. As with the longer trials, the sequence of rotations was randomized and the animals were given a minimum of 180 s between trials.
For this study, only the durations between successive QRS waves were quantified (Figure 1) and used to determine the instantaneous heart rate. For the longer trails, a linear regression was used to fit a line to the instantaneous heart rates recorded during the rotation periods. MANOVA, with Tukey’s HSD posthoc test was used to compare the slopes of the linear regression lines. For the shorter trials, a single best fit linear regression line was determined using the instantaneous heart rates from the initial and final horizontal periods as well as the rotation period. The barostatic reflexes, if any, were identified as significant outliers from the linear regression line.
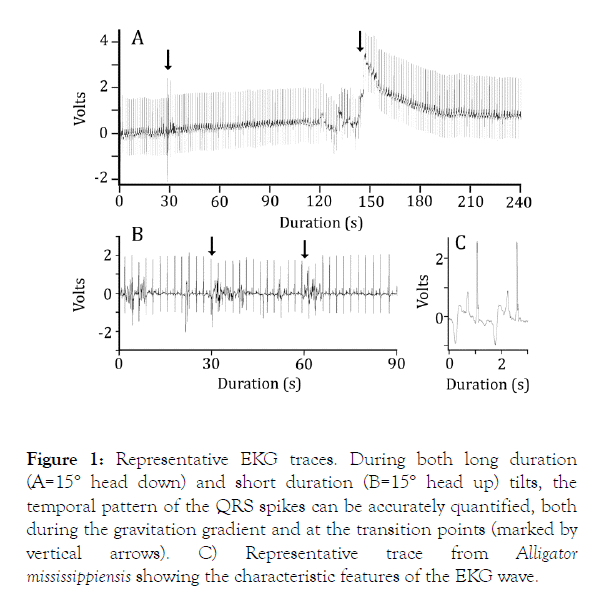
Figure 1. Representative EKG traces. During both long duration (A=15° head down) and short duration (B=15° head up) tilts, the temporal pattern of the QRS spikes can be accurately quantified, both during the gravitation gradient and at the transition points (marked by vertical arrows). C) Representative trace from Alligator mississippiensis showing the characteristic features of the EKG wave.
Ocular ultrasonography
The ocular ultrasonography was performed using a portable ultrasound machine (Shenzhen Mindray-M7, Bio-Medical Electronics Co.). The optic nerve was imaged using a linear array probe (L12-4s; Shenzhen Mindray Bio-Medical Electronics Co.) placed directly against the cornea or eyelid using ultrasound gel. The meningeal sheath around the brain extends laterally along the optic nerve, providing continuity for the CSF (Figure 2). Images were taken during 120 s duration rotations, randomized in direction and magnitude as above. The ultrasonography images were imported into ImageJ (NIH) and the diameter of the optic nerve was quantified; measurements were centered 4 mm proximal to the outer surface of the eye. Linear regression was used to document the change in optic nerve diameter during the duration of the rotation; MANOVA (with Tukey’s HSD post-hoc test) was used to compare the slopes of the regression lines.
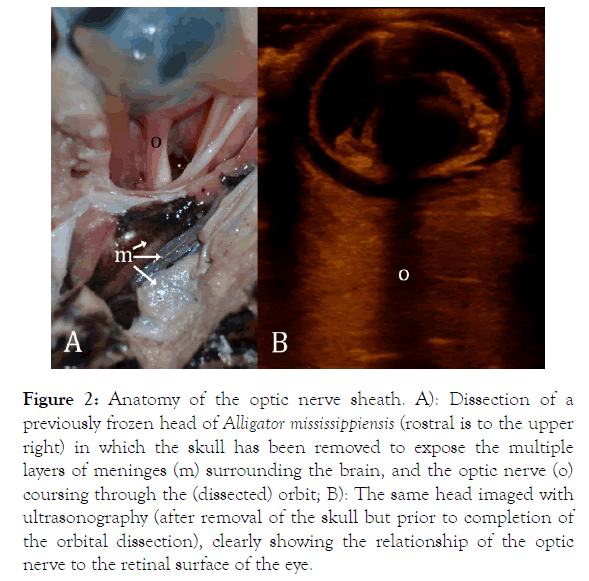
Figure 2. Anatomy of the optic nerve sheath. A): Dissection of a previously frozen head of Alligator mississippiensis (rostral is to the upper right) in which the skull has been removed to expose the multiple layers of meninges (m) surrounding the brain, and the optic nerve (o) coursing through the (dissected) orbit; B): The same head imaged with ultrasonography (after removal of the skull but prior to completion of the orbital dissection), clearly showing the relationship of the optic nerve to the retinal surface of the eye.
Vascular ultrasonography
An imaging window was cut in the tilting board, which allowed a linear array probe (L12-4s; Shenzhen Mindray Bio-Medical Electronics Co.) to be placed directly (using ultrasound gel) against the ventral scalation of the alligator’s throat. The ultrasound images obtained using a portable ultrasound machine (Shenzhen Mindray M7, Bio-Medical Electronics Co.) clearly revealed the trachea, which was used as the reference landmark in all the vascular images (Figure 3). The vascular ultrasonography was performed during 120 s duration rotations, randomized in direction and magnitude as above. The ultrasound images were imported into Image J (NIH), which was used to determine the cross-sectional area of the jugular vein and carotid artery. Linear regression was used to document the change in the vascular cross-sectional area during the duration of the rotation; MANOVA (with Tukey’s HSD post-hoc test) was used to compare the slopes of the regression lines.
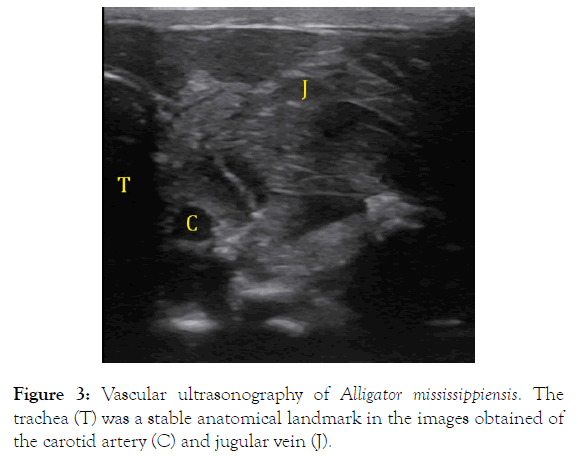
Figure 3. Vascular ultrasonography of Alligator mississippiensis. The trachea (T) was a stable anatomical landmark in the images obtained of the carotid artery (C) and jugular vein (J).
Ocular ultrasonography
The mean diameters of the optic nerve (recorded while the animals were calm, horizontal, and prior to any rotations) ranged from 2.0-2.4 mm (pooled mean=2.3, s.d.=0.2). There were significant differences in resting optic nerve diameter among the five specimens (repeated measure ANOVA F=57.11, p<0.00001, df=4), reflecting the positive regression relationship between animal size and resting optic nerve diameter (Figure 4).
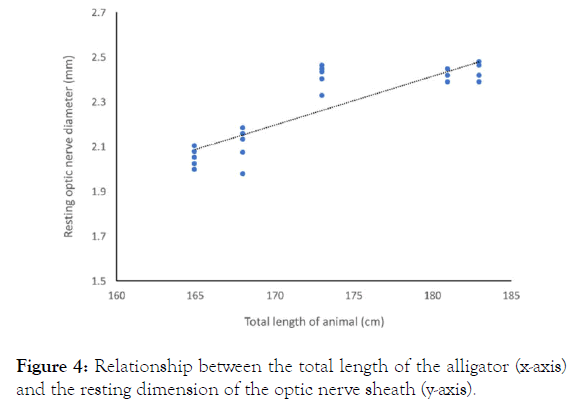
Figure 4. Relationship between the total length of the alligator (x-axis) and the resting dimension of the optic nerve sheath (y-axis).
All of the head-up rotations, in every specimen, produced a decrease in optic nerve diameter. The 15° head-up rotations produced regression coefficients ranging from -0.0019 to -0.0068 (mm/s) with a mean value of -0.0053 mm/s (s.d.=0.0019, n=5). For the 30° and 45° head-up rotations, the individual changes in optic nerve diameter were as follows: 30° range=-0.00365 to All of the head-up rotations, in every specimen, produced a decrease in optic nerve diameter. The 15° head-up rotations produced regression coefficients ranging from -0.0019 to -0.0068 (mm/s) with a mean value of -0.0053 mm/s (s.d.=0.0019, n=5). For the 30° and 45° head-up rotations, the individual changes in optic nerve diameter were as follows: 30° range=-0.00365 to
The data were then pooled and the ultrasonography measurements adjusted to eliminate the differences observed in resting optic nerve diameter (Figure 4). The pooled data set revealed increasingly negative regression coefficients with increasing degrees of rotation (Figure 5A). All of the regression coefficients were significantly different from 0: 15° b=-0.00419, t=-6.4919 (df=61), p<0.000001; 30° b=-0.00485, t=-16.21203 (df=55), p <0.000001; 45° b=-0.00602, t=-11.3133 (df=65), p<0.000001. The regression coefficients for the 15° and 30° head-up rotations were significantly different (t=6.28, df=116, p<0.000001), and both were significantly different from the regression coefficient for 45° head up rotations (t=17.26, df=126, p<0.000001 and t=15.19, df=120, p<0.000001, respectively).
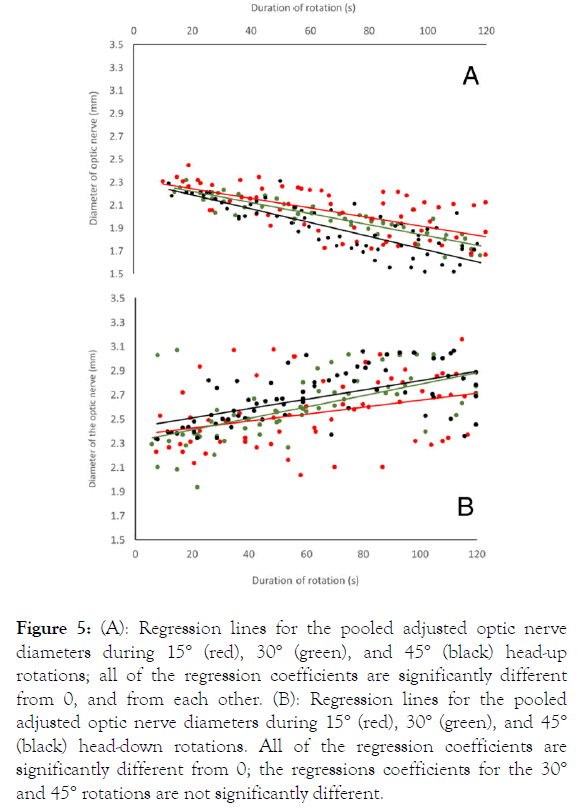
Figure 5. (A): Regression lines for the pooled adjusted optic nerve diameters during 15° (red), 30° (green), and 45° (black) head-up rotations; all of the regression coefficients are significantly different from 0, and from each other. (B): Regression lines for the pooled adjusted optic nerve diameters during 15° (red), 30° (green), and 45° (black) head-down rotations. All of the regression coefficients are significantly different from 0; the regressions coefficients for the 30° and 45° rotations are not significantly different.
Every head-down rotation, in every specimen, regardless of the magnitude of rotation, produced a positive regression coefficient, indicating an increase in optic nerve diameter. The 15° head-down rotations produced regression coefficients of 0.0009-0.0045 mm/sec, with a mean of 0.003 mm/s (s.d.=0.0014). The 30° head-down rotations yielded regressions coefficients of 0.004-0.0076 mm/s, with a mean of 0.0057 (s.d.=0.0013); the 45° head-down rotations resulted in regression coefficients of 0.0017-0.0081 mm/s, with a mean of 0.0046 (s.d.=0.0027). Repeated measure ANOVA found no significant difference (F=4.29, p=0.5415, df=2) between the different magnitudes of rotation in the non-pooled data. The maximum change in optic nerve diameter observed during the head-down rotations were: 15° mean=0.47 mm, s.d.=0.288, n=5; 30° mean=0.48 mm, s.d.=0.18, n=5; 45° mean=0.603, s.d.=0.163, n=5. A repeated measure ANOVA test found no significant difference between the terminal sizes of the optic nerves between the different rotations (F=0.564, p=0.589).
The pooled head-down data sets (Figure 5B) all had regression coefficients that were significantly different from 0: 15° b=0.0029, t=2.868 (df=60), p=0.0057; 30° b=0.0047, t=5.16 (df=55), p=0.00004; 45° b=0.00486, t=7.798 (df=70), p <0.000001. The regression coefficient for the 15° head-down rotation was significantly different compared to those for the 30° and 45° rotations (t=10.0, df=115, p<0.000001 and t=13.61, df=130, p<0.000001, respectively). The regression coefficients for the pooled 30° and 45° head-down rotations were not significantly different (t=1.16, df=125, p=0.248).
The direction and order of gravitational rotations performed for the ocular ultrasonography were randomized, but every other aspect of the image capture and quantification was standardized across all trials. The ultrasound images themselves were distinctive; they could easily be sorted as representing head-up or head-down rotations (Figure 6), and they provided other evidence of pressure gradients (such as macular edema) that are beyond the scope of the present study.
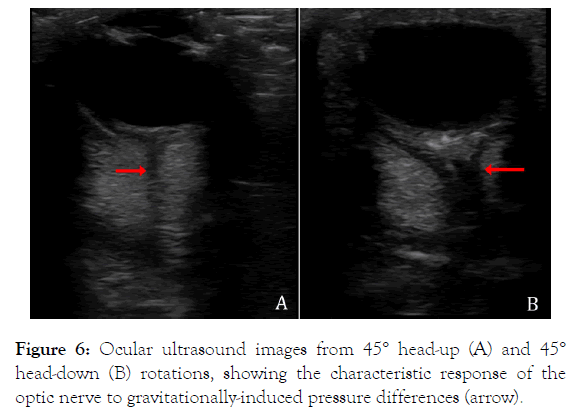
Figure 6. Ocular ultrasound images from 45° head-up (A) and 45° head-down (B) rotations, showing the characteristic response of the optic nerve to gravitationally-induced pressure differences (arrow).
Comparison of the head-up and head-down ultrasound images demonstrates that there was far more variation in optic nerve diameter during the head-down rotations than there was during the head-up rotations (compare Figure 5A and 5B, in which the y-axis is the same).
Comparing the maximal (terminal) changes in optic nerve diameter for the six rotations (Figure 7) demonstrates that, although positive and negative gravitational gradients produced similar changes in optic nerve diameter, the head-down rotations were consistently associated with more variation. Presumably, this higher level of variation among the head-down rotations is what reduced the statistical discrimination between the 30° and 45° trials. In both the regression analyses (Figure 5) and the comparison of maximal changes in optic nerve diameter (Figure 7), there was more variation in optic nerve diameter during the 15° rotations than there was during the more extreme tilts.
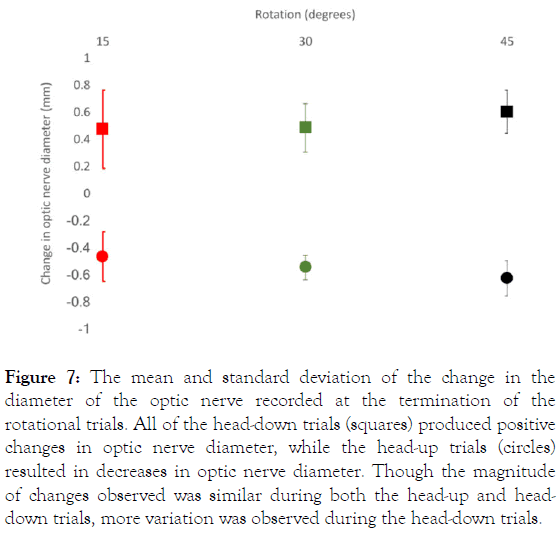
Figure 7. The mean and standard deviation of the change in the diameter of the optic nerve recorded at the termination of the rotational trials. All of the head-down trials (squares) produced positive changes in optic nerve diameter, while the head-up trials (circles) resulted in decreases in optic nerve diameter. Though the magnitude of changes observed was similar during both the head-up and headdown trials, more variation was observed during the head-down trials.
Heart rate
The five specimens of Alligator mississippiensis had resting heart rates of 20.1 -24.7 bpm. The short-duration rotation trials (30 s rest, rotation followed by 30 s of the constant gravitational gradient, then rotation back to horizontal for a 30 s recovery period) were designed to generate two (opposite) barostatic responses, one each at the onset and termination of the gravitational gradient. A surprisingly consistent pattern was observed. The onset of the gravitational gradient produced an increase in instantaneous heart rate regardless of the direction of rotation, as did the termination of the gravitational gradient (Figure 8). Of the 60 rotations quantified, only 2 (3%) resulted in a decrease in instantaneous heart rate, and in both the change in heart rate was less than 1.0 bpm (Table 1).
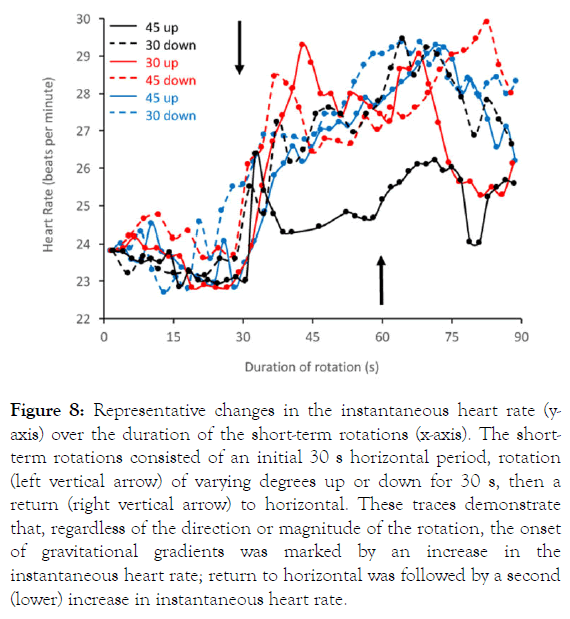
Figure 8. Representative changes in the instantaneous heart rate (yaxis) over the duration of the short-term rotations (x-axis). The shortterm rotations consisted of an initial 30 s horizontal period, rotation (left vertical arrow) of varying degrees up or down for 30 s, then a return (right vertical arrow) to horizontal. These traces demonstrate that, regardless of the direction or magnitude of the rotation, the onset of gravitational gradients was marked by an increase in the instantaneous heart rate; return to horizontal was followed by a second (lower) increase in instantaneous heart rate.
| Heart rate (the 30 s) | Heart rate (120 s) | Optic nerve diameter | Carotid artery area | Jugular vein area | |
|---|---|---|---|---|---|
| Head up 45° | Increase** | no change | Decrease** | Decrease | Increase* |
| Head up 30° | Increase* | no change | Decrease** | Decrease | Decrease* |
| Head up 15° | Increase* | no change | Decrease* | Decrease | Increase* |
| Head down 15° | Increase* | no change | Increase** | Increase* | Increase* |
| Head down 30° | Increase* | no change | Increase* | Increase* | Increase** |
| Head down 45° | Increase* | no change | Increase* | Increase* | Increase** |
Table 1: Magnitude of change in instantaneous heart rate at the onset and termination of short (30 s) rotations. Changes in heart rate are listed as mean (beats per minute), s.d.
Repeated measure ANOVA found a significant difference (F=5.55, p=0.0016, df=5) between the changes in the instantaneous heart rate at the onset of the short-rotation gravitational gradients. Tukey’s post-hoc test found significant (Q=4.51, p=0.040) differences between the 45° head-up initial responses and those from both 15° head-up and 45° head-down trials (Q=5.29, p=0.011 and Q=7.055, p=0.001, respectively).
The 45° head-up rotation produced the largest increase in instantaneous heart rate at the onset of the gravitational gradient (Table 1); the 15° head-up and 45° head-down rotations resulted in the lowest change in instantaneous heart rate due to the presence of a single negative response in each of the two trial sets. Regression analysis demonstrated that the increase in the instantaneous heart rate that occurred at the onset of the gravitational gradient during head-up rotations was greater with increasing degrees of rotation (b=0.129), which was significantly different from 0 (t=5.12, p=0.00002, df=28).
The increase in the instantaneous heart rate that occurred at the onset of the gravitational gradient during head-down rotations decreased with increasing degrees of rotation (b=-0.005); this relationship was not significantly different (t=0.119, p=0.906, df=28) from 0. The relationship between the increase in instantaneous heart rate and angle of rotation was significantly (t=9.53, p<0.00001, df=26) different between the head-up and head-down directions.
The changes in the instantaneous heart rate observed at the termination of the short-duration rotations were positive for both the head-up and head-down rotations (Table 1). When the instantaneous heart rate was compared across angles of headdown terminal rotations, a regression coefficient of -0.036 was determined, which was significantly different (t=5.89, p=<0.00001, df=28) from 0. The regression coefficient of the instantaneous heart rate against angles of head-up terminal rotations was -0.009, which was not significantly different (t=0.28, p=0.781, df=28) from 0. The regression coefficients from the head-up and head-down terminal rotations were significantly (t=3.0, p=0.005, df=26) different from each other. Repeated measure ANOVA found significant difference (F=2.96, p=0.032, df=5) between the changes in instantaneous heart rate following the termination of short duration rotations; Tukey’s post-hoc test found significant (Q=4.51, p=0.040) difference between the 15° head-down and 45° head-up terminal responses, but no significant differences between any other comparisons.
The long-duration rotations were intended to document the heart rate response to sustained (120 s) gravitational gradients.
With the exception of one outlier trial, the long-duration rotations produced little change in the instantaneous heart rate; the regression coefficients for heart rate compared to time were all very close to zero (Figure 9), and many were not significantly different from zero. Rotations in every direction and degree resulted in both positive and negative regression coefficients (both increases and decreases in the instantaneous heart rate). The relatively small size of these regression coefficients indicates that only modest changes in heart rate were observed; the outlier recorded during the head-down 45° trials resulted in the largest mean regression coefficient (0.018) indicating that during the 120 s duration of the gravitational gradient, the alligators’ heart rate would increase by only 2 bpm.
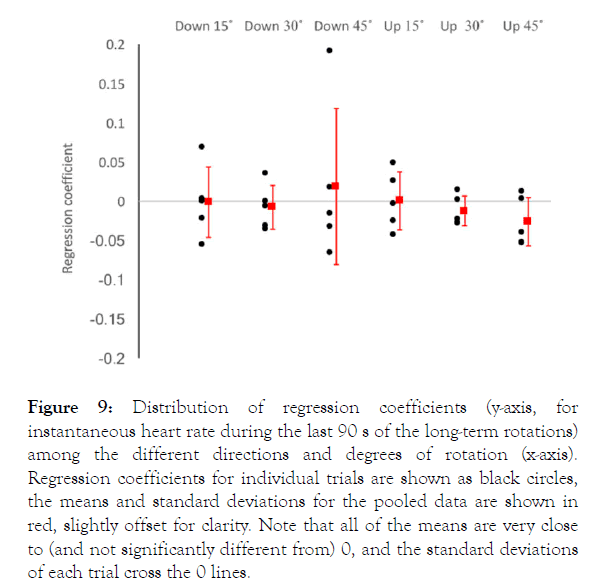
Figure 9. Distribution of regression coefficients (y-axis, for instantaneous heart rate during the last 90 s of the long-term rotations) among the different directions and degrees of rotation (x-axis). Regression coefficients for individual trials are shown as black circles, the means and standard deviations for the pooled data are shown in red, slightly offset for clarity. Note that all of the means are very close to (and not significantly different from) 0, and the standard deviations of each trial cross the 0 lines.
Repeated measure ANOVA found no significant differences (F=0.429, p=0.824) among the regression coefficients for the instantaneous heart rate determined during the long-duration gravitational gradient experiments. These regression coefficients did not show a significant relationship with the degree of rotation during either the head-up (t=1.47, p=0.153, df=28) or head-down (t=0.497, p=0.623, df=28) trials. The pooled regression coefficients for changes in instantaneous heart rate during long-term gravitational gradients were significantly (t=3.82, p=0.0007, df=26) different between the head-down and head-up trials.
Vascular ultrasonography
During head-up rotations, there were no significant changes in the cross-sectional area of the carotid artery; the regression lines calculated for carotid dimension against duration of rotation were all not significantly different from 0 (15° head up t=0.577, p=0.57; 30° head up t=0.53, p=0.6; 45° head up t=0.149, p=0.889). Increased arterial blood flow during head-down rotations caused the carotid arteries to distend (Figure 10A). Regression analysis demonstrated that, during the head-down rotations, the cross-sectional area of the carotids significantly increased during the duration of the rotation (15° head down t=2.46, p=0.02; 30° head down t=2.45, p=0.02; 45° head down t=0.015, p=0.04). Additional analysis revealed that the regression coefficients determined (15° head down b=0.0097; 30° head down b=0.0143; 45° head down b=0.00758) during the headdown rotations were all significantly different from each other (15° to 30° head down t=3.89, p=0.0002, df=51; 15° to 45° head down t=2.066, p=0.04, df=58; 30° to 45° head down t=2.88, p=0.005, df=51).
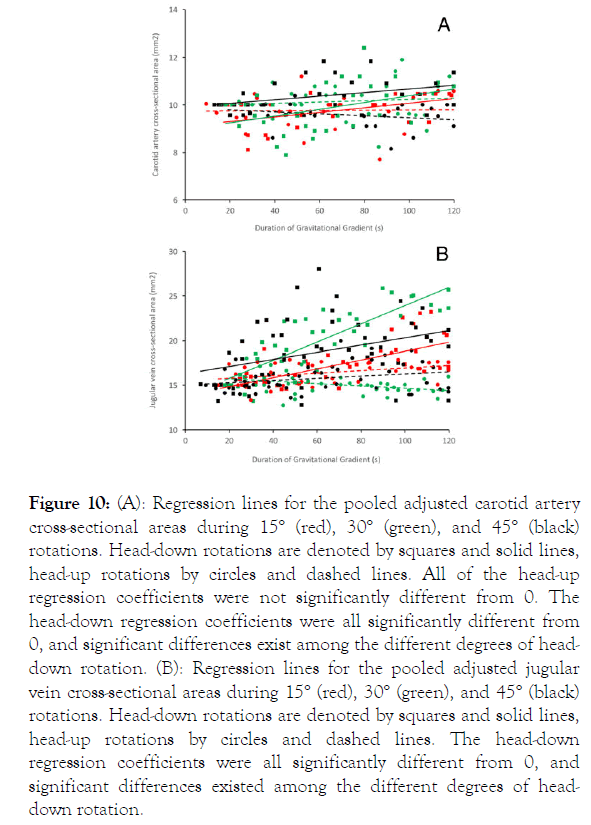
Figure 10. (A): Regression lines for the pooled adjusted carotid artery cross-sectional areas during 15° (red), 30° (green), and 45° (black) rotations. Head-down rotations are denoted by squares and solid lines, head-up rotations by circles and dashed lines. All of the head-up regression coefficients were not significantly different from 0. The head-down regression coefficients were all significantly different from 0, and significant differences exist among the different degrees of headdown rotation. (B): Regression lines for the pooled adjusted jugular vein cross-sectional areas during 15° (red), 30° (green), and 45° (black) rotations. Head-down rotations are denoted by squares and solid lines, head-up rotations by circles and dashed lines. The head-down regression coefficients were all significantly different from 0, and significant differences existed among the different degrees of headdown rotation.
A similar pattern was found in the dimensional changes of the jugular veins. During head-up rotations, there were a variety of low-level responses seen in the jugular veins (Figure 10B). Headup rotations of 15° caused a slight (b=0.014) increase in jugular cross-sectional area that was significantly greater than 0 (t=2.33, p=0.026, df=32); 30° rotations caused a slight decrease (b=-0.013) in jugular cross-sectional area that was significantly less than 0 (t=2.19, p=0.035, df=37); 45° head-up rotations produced a regression coefficient (b=0.012) that was not significantly different from 0 (t=1.91, p=0.06, df=47). By contrast, the head-down rotations all resulted in distension of the jugular veins and positive regression coefficients that were all significantly greater than 0 (15° b=0.05, t=6.25, p=<0.00001; 30° b=0.102, t=9.74, p<0.0001; 45° b=0.04, t=2.81, p=0.006). The regression coefficients determined for jugular area during the head-down rotations were all significantly different from each other (15° to 30° t=25.42, p<0.00001, df=81; 15° to 45° t=3.96, p=0.0002, df=93; 30° to 45° t=21.89, p<0.0001, df=88). Note that the regression coefficient for increase in jugular crosssectional area was greater during the 30° head-down rotations than during the 45° head-down rotations.
The magnitude of change observed in the jugular vein with head-down rotations was several times greater than what was observed in the carotid artery (Figure 10).
General pattern of response to gravitational gradients
The four trials conducted on each specimen (EKG recordings during short-term rotations, EKG recordings during long-term rotations, ocular ultrasonography during rotations, and vascular ultrasonography during rotations) were conducted in a random order, and within each trial the direction and magnitude of rotation of the specimen was randomized. As such, no measurement (e.g., jugular vein luminal area) should have influenced any of the other measurements. When viewed together, the general pattern recorded from the optic nerve and the vascular lumens appears to reflect a consistent response to gravitational gradients. During head-down tilts, the gravitational gradient shifted fluids to the head, and the optic nerve sheath, carotid artery, and jugular vein all exhibited significant expansions (Table 2). During head-up tilts, fluids shifted toward the tail, and there was a significant reduction in the size of the optic nerve sheath, the luminal area of the carotid artery decreased (but not significantly below baseline), and there was an inconsistent pattern of low-level change in the luminal area of the jugular vein (Table 2). Perhaps most surprising, none of the rotations (short or long duration, head-up or head-down) resulted in a change in the EKG that appeared consistent with a barostatic response to a gravitational gradient (Table 2).
| Onset | Termination | |
|---|---|---|
| 15 head-down | 2.2, 0.7 | 3.1, 2.0 |
| 30 head-down | 2.8, 1.1 | 2.2, 1.3 |
| 45 head-down | 2.0, 1.6 | 2.0, 1.0 |
| 15 head-up | 1.0, 1.5 | 1.1, 0.6 |
| 30 head-up | 2.6, 1.1 | 1.1, 0.4 |
| 45 head-up | 4.9, 1.1 | 0.8, 0.7 |
Table 2: Summary of observed changes when Alligator mississippiensis was exposed to gravitational gradients. Responses that were significantly different from 0 are shown with one asterisk. Responses that were also significantly different from smaller rotations in the same direction are shown with two asterisks. If there was an asymmetric response between head-up and head-down rotations, the direction with the larger response is indicated with bold type.
Measuring intracranial pressure using ocular ultrasonography originated for neurological emergency care [30-32] but has found application in veterinary medicine [33]. The present study represents the first application of this technique to alligators or any other reptile. Studies employing both ocular sonography and direct recording of intracranial pressure have found a significant relationship between intracranial pressure and both the optic nerve and the optic nerve sheath [34,35].
Accordingly, we interpret the significant changes in optic nerve sheath diameter that were measured when A. mississippiensis was exposed to gravitational gradients (Figure 5) as reflecting changes in intracranial pressure. The duration of the gravitation gradients used in the present study, combined with the nearly spontaneous changes in optic nerve diameter following tilting, indicates that the measured increase in intracranial pressure resulted from a redistribution of CSF, rather than from changes in the dynamics between the CSF and the vasculature [36,37].
Vascular ultrasonography is an established technique that has been used in a variety of comparative studies [38-40] and previously applied to crocodilians [41,42]. The results presented herein for the carotid artery (Figure 10A) follow a pattern seen in multiple studies: increased orthostatic pressure results in increased arterial blood flow and carotid dilation, whereas decreased orthostatic pressure results in reduced arterial blood flow and minimal change in carotid diameter, because the structure of the arterial wall prevents collapse [43-45].
The significant dilation of the jugular vein, which we observed during head-down tilts (Figure 10B), is a frequent finding during venous pooling in the head [46,47]. Orthostatic gradients associated with head-up posture frequently induce the collapse of the jugular vein [5,48]; in contrast, head-up rotations in the alligator produced variable changes in the jugular luminal area, including increases in luminal area. One cause of the largerthan- expected jugular luminal areas during head-up rotations may be the unusual patterns of heart rate observed during thisstudy (see below), but it may also reflect the nature of the cephalic venous system in alligators. Crocodilians have a central and cranial venous return characterized by the spinal vein [49] and the jugular vein, respectively. These two venous pathways are linked in the skull, and on the caudal surface of the skull by the prominent caudal head vein [50]. The alligator head, like the heads of many other reptiles, includes both peripheral and central venous plexi [51]; shunting blood between the two has been shown to facilitate temperature regulation of the brain in reptiles [52]. Further, reptiles can actively regulate blood flow to control temperature distribution of the head and body [53].
We hypothesized that inducing a gravitational gradient by tilting the alligator would induce changes in heart rate similar to that previously described in snakes [9-11] and other reptiles [54]. Interpreting the changes in heart rate observed during tilting of A. mississippiensis as a baroreflex is problematic for three reasons: 1) tilting the alligator produced an increase in heart rate regardless of the direction of rotation (Figure 9); 2) The increase in heart rate that occurred with rotation (in either direction) started to decrease within approximately 10 s (Figure 8); and 3) sustained rotation (in either direction) did not produce a significant change in heart rate over the course of the rotation (Figure 9). The failure of the orthostatic gradients to induce a baroreflex in A. mississippiensis is in contrast to earlier chemical demonstrations of a baroreflex in crocodilians [26]. Alligators are capable of floating for extended periods with their head at the water surface and body angling down at a sharp angle [55,56]; perhaps with this postural preference, tilts of greater than 45° are necessary to induce the baroreflex.
If the orthostatic gradients used in the present study did not evoke a barostatic reflex in the alligator, what produced the transitory increase in heart rate during each rotation? Studies [22,23] have attributed both bradycardia and tachycardia to arousal/fear/contact responses in alligators. The rotations performed in this study were rapid (1-2 s) and may have evoked a startle/fear response in the specimens. If this startle/fear response includes tachycardia, it would explain the rise in heart rate observed during (virtually) every rotation of the alligators regardless of direction. Previous studies [22,23] offer two complications to this interpretation: 1) alligators showing fearrelated changes in heart rate have all returned to resting heart rate very gradually, rather than the rapid return is seen in the present study; and 2) alligators can acclimate to the fearinducing stimuli (at least in terms of human contact), whereas in the present study the same response was seen with each rotation regardless of the order of rotations performed.
Lilywhite [10] reported that orthostatically-intolerant vipers reacted more strongly to head-down tilts than they did to headup tilts. The same pattern was observed in A. mississippiensis, which would frequently thrash during the 45° head-down tilts, but rarely during any other tilt. Tilt trials for gravitationallychallenged terrestrial snakes have been terminated early over concerns of the apparent lack of cardiovascular control [10,11]. The present study limited tilts to a maximum of 120 s. With the exception of the “static” heart rate, all of the other variables quantified in this study exhibited a relatively linear change during the course of the tilts; no evidence of a late-tilt plateau or correction was observed. The gravitational gradients produced when A. mississippiensis were rotated into a head-up posture caused a significant decrease in cephalic fluids (CSF, arterial blood, and venous blood) with no evidence for a compensatory response; rotation into a head-down posture resulted in the cephalic fluids pooling in the head, again with no evidence for a compensatory response. Although additional studies will be required to elucidate the underlying regulatory mechanisms, the present study clearly establishes that ocular sonography can be used to quantify the intracranial pressure of reptiles and that the response of A. mississippiensis to gravitational gradient is unique from any previously studied reptile or vertebrate.
The authors wish to thank Dr. Ruth Elsey and the Louisiana Department of Wildlife and Fisheries for their cooperation and Dr. P. Kondrashov for his continued support.
Citation: Knoche L, Young BA, Kondrashova T (2019) The Influence of Gravitational Gradients on the American Alligator (Alligator mississippiensis). Anat Physiol 9:318. doi: 10.35248/2161-0940.19.9.318
Received: 07-Oct-2019 Accepted: 16-Oct-2019 Published: 23-Oct-2019 , DOI: 10.35248/2161-0940.19.9.318
Copyright: © 2019 Knoche L, et al. This is an open-access article distributed under the terms of the Creative Commons Attribution License, which permits unrestricted use, distribution and reproduction in any medium, provided the original author and source are credited.