Journal of Clinical and Experimental Ophthalmology
Open Access
ISSN: 2155-9570
ISSN: 2155-9570
Research Article - (2020)Volume 11, Issue 4
Background: The current concept of eye growth and emmetropization is thought to be dependent on visual
stimulation of the mid-peripheral retinal cells. The aim of the current study was to examine whether damage to this
part of the retinal tissue can affect the growth and function of the eye during development.
Methods: We had two groups of domestic fowl chicks. One group was normal (N) and the other had a laser burn on
10% of the nasal retinal area of one eye. The optical components of the eye were examined by retinoscopy while
physical measurements were made using ultrasonography and micrometry. The function of the retina was examined
by standard flash ERG test. There were no differences in the refractive and the ultrasonographic results between the
two groups.
Results: The experimental group (right eye) showed a significant decrease in the amplitude and the latency results of
both a and b wave compared to the other eye (left) and to the control group. However, there were no differences in
the refractive and the ultrasonographic results between the two groups.
Conclusion: This study found that the ERG in damaged eye was significantly affected by the laser as compared to
that of control eye, while there was no difference in the refractive status and growth between the experimental and
control groups. Therefore we concluded that burning only a 10% of the retina has no influence on the eye's growth
or refractive development, notwithstanding the ensuing decrease in retinal function.
Development; Laser burn; Myopia; Refractive status; Retinal changes
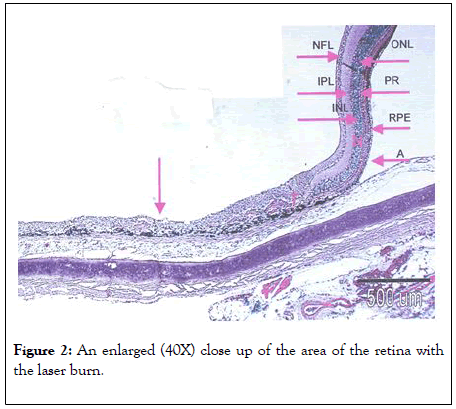
NFL: Nerve Fiber Layer; IPL: Inner Plexiform Layer; INL: Inner Nuclear Layer; RPE: Retinal Pigment Epithelium, ONL: Outer Nuclear Layer; PR: Outer Segment of Photoreceptors; A: Area of Artifact Left arrow: Treatment Area.
The human eye shows great sensitivity to external environmental changes as causes for refractive changes during the developmental period. This is demonstrated by both body and eye growth and changes between the corneal curvature and the axial length ratio. Under normal conditions this results in eventual emmetropia hence the term "emmetropization process." Low visual acuity, due to illness or genetic defects can interfere with this emmetropization process [1,2]. This can explain the relationship between altering the refractive status in childhood and resultant visual lack in adulthood. In order to directly check if even a limited lack of retinal tissue has an influence on the entire eye function, we evaluated the functioning capability of the eye as tested by the electroretinogram (ERG). The ERG is a very reliable physiologic test in determining the quality of the visual process at the level of the retina [3].
Many researchers including those from our laboratory have checked the effect of sensory deprivation on specific eye components and on the refractive state in chicks, cats and monkeys [4-9] and found myopic or hyperopic shifts. Others have examined the influence of damage to photoreceptors on developing lid-suture myopia [10]. In recent years there have been a number of studies stressing the importance of proper light stimulation to the mid-peripheral retina in developing emmetropia (as opposed to myopia) in humans [11,12]. In view of these factors, in the present study we decided to investigate how the retinal function and optical characteristics of the eye develop after burning 10% of the retinal area in one eye in the first month after hatching.
As has been shown in previous studies the chick is a suitable animal model for the studying of optical changes during development [13].
Animals and rearing conditions
Sixty three one-day-old male chicks of the domestic fowl were purchased from a hatchery and kept free or in cages in our animal room.
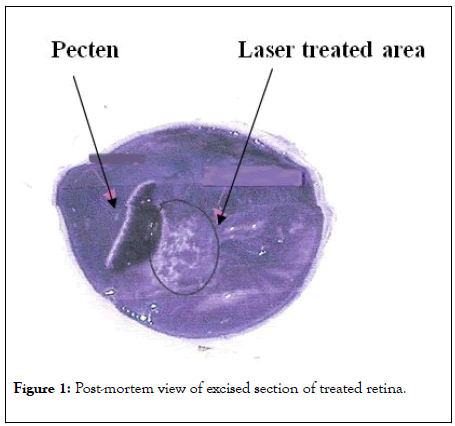
The chicks were divided into two groups: the first group had a laser burn on 10% of the retinal area in one eye in the first month after hatching (BL). The area chosen was the area of the nasal retina known as the aster (Figure 1). The other group was normal (control) (N).

Figure 1: Post-mortem view of excised section of treated retina.
The chick’s weight was measured every few weeks and before the final examinations. The chicks were served protein rich food.
The chicks were reared for the first 3 weeks post hatching in 60 × 60 × 60 cm cages, illuminated and warmed (30 ± 2°C) with incandescent lamps. Light intensity was 1200-3800 Lx, measured with Megarton Luxmeter. After this period the chicks were allowed to range free in 2.3 × 1.7 m rearing rooms. During the first month they were exposed to 24 hours per day lighting which was then reduced to 12 hours daily. The illumination schedule, temperature, humidity and ventilation in the cages and in the rearing rooms were automatically controlled.
The exposure periods given for the experimental and control groups of chicks (>3 months) were longer than the minimal period needed to obtain normal optical properties of the adult eye [14].
Laser procedures
Laser burns were performed monocularly on the 21 experimental group chicks during the first month post-hatching. The chicks were anesthetized with Rompun (Xylazin, Bayer) following 0.06 mg/kg i.m. This dosage kept the chicks fully anesthetized nearly 1 hr. The pupils were dilated with tropicamide 0.5% drops (Mydramid, Fischer) before performing the retinal laser treatments. The laser treatments were performed while the anesthetized chicks were lying on a platform fixed to a stable photographic tripod in front of the laser utilizing a +90D lens (Volk II BIO 90D U.S.A.). Retinal photocoagulation was performed using an Argon laser (Novus 2000 Coherent, Palo Alto Ca U.S.A.) with all chicks having 1100 laser burns on the retina, 2 μ diameters each burn.
Electroretinographic recordings
The ERG ’ s were recorded monocularly from 21 chicks (experimental group) as had been done in previous experiments by our laboratory [1]. The same anesthetizing protocol was used for this portion of the experiment as had been used in the Laser burn phase.
Contact lens electrodes (Medical Workshop b.v., Holland) served as the active electrodes and Celluspangoniofluid (methylcellulose) was placed between the lens and the cornea to ensure good electrical contact, and to avoid corneal dehydration. To ensure correct positioning of the lenses, the lids were sutured near the temporal canthus. The reference electrode was a metal clip attached to the crest.
In each eye the ERG was recorded under three different light intensities.
I=2,8,16. The light intensity I=16 is 22 lumens/sec/ft2. This intensity is twice that of I=8 and four times that of I=2. At each intensity, five sub-segment flashes were given at intervals of 20 sec. The amplitudes and the latency of wave a and b were measured by a specially designed computer program. The results were compared to the ERG results in control group.
Optical and physical measurements
Retinoscopy was done after obtaining cycloplegia with 2 drops of 1% Atropine sulphate. The refractive error was measured in a darkened room using a Heine spot retinoscope and a set of trial lenses. The measurements were carried out separately for the horizontal (nasotemporal plane) and vertical meridians.
Ultrasonography (7200 MA, KLN Kertztechnik) was performed in all chicks with the probe placed on the center of the cornea parallel to the visual axis, using a transmission gel as contact medium and Localin for corneal anesthesia. The position of the anterior surface of the lens and the length of the anteroposterior axis were thus determined.
Histopathologic examinations
The chicks were sacrificed and the eyes were enucleated for histopathologic evaluation. After fixation in formaldehyde, the eyes were sectioned trough the pars plana into two compartments: the anterior segment included the cornea, the ciliary body, the iris and the lens; the posterior segment included the sclera, choroid and retina. The posterior segment was further sectioned through the laser ablated area. These segments of the posterior pole with the laser ablated area were embedded in paraffin, sectioned and stained with hematoxylin and eosin and evaluated by light microscopy.
Statistics and data analysis
To statistically compare the difference between mean results of the experimental chicks and the controls, the t-test for two independent groups was applied. In order to compare the difference between the mean results of the retinoscopy test, comparisons were made between average results for the 90° meridian (vertical axis), which were equal to the results of the 180° meridian (horizontal axis).
Retinal appearance
The results of the laser burn are shown in Figures 1 and 2, these show the effects of the laser burn in both a macro and microscopic view.

Figure 2: An enlarged (40X) close up of the area of the retina with the laser burn.
This area includes the transition between normal retinal and the area of the laser burn in chick #5. The treatment was performed at age 15 days with 1000 separate burns with an area of 2 microns each. On the right is an area of normal retina with a separation artifact caused by the slide preparation. In the treated area there is a disruption of the layering of the retina and an absence of cell nuclei.
ERG Results
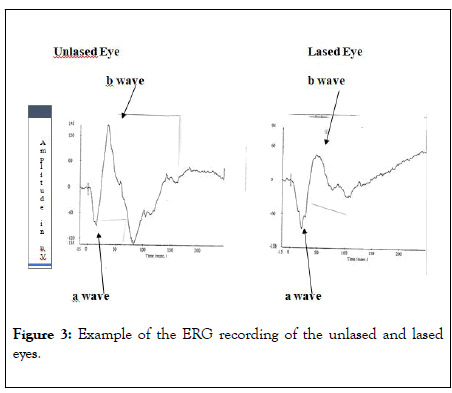
The waveform of a typical chicken ERG response for treated and non-treated eyes is shown in Figure 3.

Figure 3: Example of the ERG recording of the unlased and lased eyes.
These graphs represent the average recordings received after five flashes (I=16) 20 seconds apart. One can see the difference between the reactions of the two eyes.
The comparison between the peak and the time response in the different eyes shows that the amplitude of a and b wave in the control eye in the different intensities are higher then the amplitude of the experimental eye. This difference shows that the laser burn procedure was sufficient to cause damage to the chicken retina (Table 1).
| A-wave amplitude | B-wave amplitude | |||
|---|---|---|---|---|
| Damaged | Normal | Damaged | Normal | |
| I - 2 | 34.5 | 42.87 | 51.39 | 148.29 |
| I - 8 | 36.65 | 56.66 | 72.93 | 166.72 |
| I - 16 | 65.63 | 89.67 | 52.11 | 133.37 |
Table 1: ERG results recording from 10 experimental chicks in a different intensity. The right eye has 1100 laser burns at the first month after hatching the total burn area is 2 μ. And the left eye is a control. The results shown the as far as the intensity is higher the different between the results of experimental and the control groups are higher.
Statistical analysis test (χ2) was performed on the a and b wave amplitude and latency values. The post-laser a and b waves amplitude values and the a-wave latency were found to be significantly different from the other eye (Tables 1 and 2).
| No. | Eye | Day of laser | Peak amplitude | Peak latency | ||
|---|---|---|---|---|---|---|
| A wave | B wave | A wave | B wave | |||
| 1 | R | 15 | 85 | 88.61 | 22.27 | 47.1 |
| L | 7.23 | 190.5 | 15.87 | 38.4 | ||
| 2 | R | 29 | 47.8 | 26.99 | 21.5 | 45.57 |
| L | 106 | 145.7 | 16.38 | 37.12 | ||
| 3 | R | 29 | 84.5 | 43.11 | 17.92 | 47.1 |
| L | 83.5 | 149.7 | 17.92 | 38.91 | ||
| 4 | R | 15 | 83.1 | 85.71 | 19.2 | 43.52 |
| L | 137 | 236.2 | 17.66 | 40.45 | ||
| 5 | R | 15 | 85.8 | 46.02 | 20.74 | 46.59 |
| L | 89.1 | 146.9 | 14.59 | 34.82 | ||
| 6 | R | 28 | 123 | 19.8 | 32.51 | 65.54 |
| L | 125 | 55.72 | 20.22 | 41.22 | ||
| 7 | R | 28 | 74.8 | 57.3 | 17.15 | 42.5 |
| L | 91.7 | 110.4 | 15.62 | 45.31 | ||
| 8 | R | 16 | 45.6 | 83.7 | 21.5 | 48.9 |
| L | 92.7 | 109.4 | 15.62 | 45.31 | ||
| 9 | R | 16 | 38.2 | 48.74 | 17.66 | 48.9 |
| L | 106 | 102.4 | 16.64 | 44.29 | ||
| 10 | R | 23 | 53.2 | 12.46 | 20.74 | 40.19 |
| L | 81.8 | 29.28 | 17.41 | 56.32 | ||
| P Value | P<0.05 | P<0.05 | P<0.005 | P<0.1 | ||
Table 2: The difference between the experimental and the control eyes is clearly shown. Utilizing the Chi-test statistical analysis, the post-laser a and b waves amplitude values and the a-wave latency were found to be significantly different from the other eye.
Visual optics
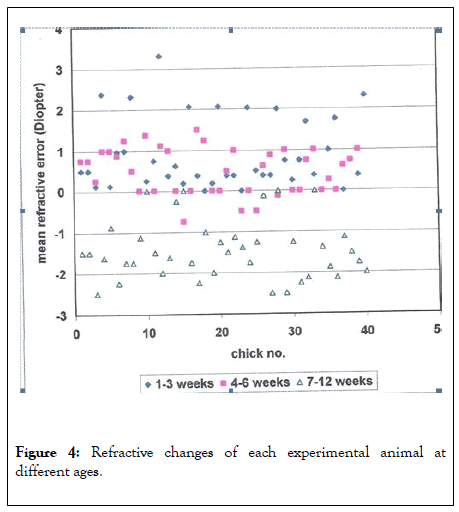
The effect of retinal damage on the ocular structures and geometry of the eyes in the lased eyes in comparison to the control eyes was not statistically significant and the same was true as to the effect on refractive error (Figure 4).

Figure 4: Refractive changes of each experimental animal at different ages.
The refractive findings were checked once every 18 days from hatching until age 12 weeks. Each point represents the average between the findings of the right and left eyes in the two primary meridia (180 and 90).
At three weeks post hatching the refraction was hyperopic (mean of 1.41 D) while at twelve weeks post hatching the refraction shifts towards myopia (mean of-1.1 D). There were no statistically significant differences obtained between the refraction of the different groups at the same time post hatching (Table 3).
| Week | 180th Meridian | 90th Meridian | Average refractive error | p value | |
|---|---|---|---|---|---|
| 1-3 weeks | Lased | 1.58 ± 1.16 | 1.42 ± 1.07 | 1.5 ± 1.11 | >0.05 |
| Normal | 1.42 ± 0.74 | 1.42 ± 0.58 | 1.42 ± 0.66 | ||
| 4-6 weeks | Lased | 1.35 ± 0.91 | 1.36 ± 0.91 | 1.36 ± 0.91 | >0.05 |
| Normal | 1.03 ± 0.95 | 1.09 ± 1.03 | 2.12 ± 0.99 | ||
| 9-7 weeks | Lased | 0.51 ± 1.25 | 0.4 ± 1.08 | 0.46 ± 1.16 | >0.05 |
| Normal | 0.8 ± 1.05 | 0.95 ± 0.94 | 0.87 ± 1.00 | ||
| 10-12 weeks | Lased | -1.3 ± 0.75 | -1.18 ± 0.85 | -1.24 ± 0.80 | >0.05 |
| Normal | -1 ± 0.78 | -0.85 ± 0.78 | -0.93 ± 0.78 | ||
| 13-15 weeks | Lased | -1.52 ± 0.55 | -1.27 ± 0.56 | -1.4 ± 0.56 | >0.05 |
| Normal | -1.39 ± 0.64 | -1.43 ± 0.63 | -1.41 ± 0.64 |
Table 3: Average refractive error (in diopters) in the control and experimental groups by weeks.
In all groups 3-week post hatching the refraction was hyperopic. 12 weeks post hatching the refraction tendency went toward myopia. There were statistically significant differences in the refraction of the same group at different period of time; however, there was no statistically significant difference between the refraction of the different groups at the same age.
The emmetropization process is influenced by several factors, such as: heredity, the surroundings, optical conditions etc. All of these factors influence the growth process, but until now no one measured the degree of influence of each factor. Many experimental studies focused on the environmental conditions and found an influence on the refractive status [15,16]. In addition, it was found which of the ocular components is the most dominant in determining the refractive defect [17-19].
Numerous studies show the connection between the degree of the retinal function, the optical structure and refractive balance in the developing period. For example, development in a dark environment or with visual deprivation destabilizes this balance and causes myopia [4-8,20].
This study evaluated in what manner laser damage to the retina can influence the eye's ERG, refraction and growth. It was found that the ERG in damaged eye was significantly affected by the laser as compared to that of control eye. In spite of this damage there was no difference in the refractive status and growth between the experimental and control groups.
Other than the previously cited work by Oishi and Lauber there were no reports on damaging the retina in the developing period to compare to our results and their methodology was selective to photoreceptors. However, in studies on the effect of cutting the optic nerve in animals a higher standard deviation was found in refractive errors between the different animals although there was no difference in the mean refraction [21]. In human studies, it was found that retinal lack or partial retinal lack due to pathologic conditions can cause refractive changes. The types of conditions studied included coloboma (an absence of iris tissue due to damage or incomplete closure of the fetal tissue of the choroid), foveal splitting, and optic nerve damage [22]. All of these can cause reduced visual acuity [23-27].
What still remains to be proven is if the refractive changes are due to retinal deficit or other factors. In this study retinal damage was induced in experimental animal model and no influence on the refraction was found. Another factor that can influence this result is that we damaged only 10% of the retina which may have been insufficient to influence this factor.
We are grateful, to Dr. GenadyDobin for his kind assistance during the surgical recording, and histological session and to our electronic technician, Eli Zimmerman, for his technical assistance during the recording and computation session. This study was supported by the Claire and AmedeeMaratier Institute for the study of Visual Disorders and Blindness, Eye Institude, Tel Aviv University, Sheba Medical Center. Tel-Hashomer 52621, Israel
Citation: Koslowe KC, Rozentzvaig L, Yinon U, Rosner M (2020) The Involvement of the Retina in the Development of Myopia in a Model Eye of Chicks. J ClinExpOphthalmol. 11:853. DOI: 10.35248/2155-9570.20.11.853
Received: 22-Jun-2020 Accepted: 06-Jul-2020 Published: 13-Jul-2020 , DOI: 10.35248/2155-9570.20.11.853
Copyright: © 2020 Koslowe K, et al. This is an open-access article distributed under the terms of the Creative Commons Attribution License, which permits unrestricted use, distribution, and reproduction in any medium, provided the original author and source are credited.