Journal of Sleep Disorders & Therapy
Open Access
ISSN: 2167-0277
+44 1478 350008
ISSN: 2167-0277
+44 1478 350008
Research Article - (2019)Volume 8, Issue 2
Background: The Epsworth sleepiness score is a vital tool clinicians use to grade the severity of excessive daytime sleepiness and it is also given significant relevance by the third-party payers before approving Continuous Positive Airway Pressure (CPAP) treatment for patients with obstructive sleep apnea with apnea-hypopnea index between 5 to 15 events per hour. Many studies that explored if an elevated Epsworth sleepiness score can predict the presence of obstructive sleep apnea have had conflicting results. Whereas some show association between Epsworth sleepiness score and obstructive sleep apnea, others did not find any association. In this study, the association of Epsworth sleepiness score with obstructive sleep apnea was evaluated at a community-based practice with multiple locations all around central Florida. We also analyzed the association of apnea-hypopnea index with known risk factors for obstructive sleep apnea such as larger neck circumference, overweight and obesity.
Methods: In this cross-sectional study, we reviewed the charts of 529 consecutive subjects who presented for sleep evaluation at a community practice over a period of 6 months and underwent sleep studies. 186 (35%) of the patients were not included in our analysis because they have incomplete data. 343 patients were used for this data analysis and 252 (73.5%) were diagnosed with sleep apnea based on apnea-hypopnea index of ≥5 per hour on polysomnography. The following data were collected on each subject; body-mass-index, neck circumference, Epworth sleepiness score, the absence or presence of excessive daytime sleepiness, hypertension and diabetes. Epworth sleepiness score ≥10 was considered elevated while large neck circumference was set at ≥16 inches in females and ≥17 inches in males.
Results: 252 patients had sleep apnea, 94.8% of them were overweight or obese, 84.1% had large neck circumference, 82.1% presented with excessive daytime sleepiness, 63.1% had hypertension, 34.1% had diabetes and 57.5% had an elevated Epworth sleepiness score. Pearson’s tests between body-mass-index and apnea-hypopnea-index in the overweight and obese patients showed positive correlation (P<0.001, R=0.24, N=319). Furthermore, the relationship between neck circumference and apnea-hypopnea-index in males with neck circumference of ≥17 inches was significant with positive correlation (P=0.047, R=0.17, N=143) likewise, in females with neck circumference ≥16 inches, the relationship was also significant (P<0.001, N=128) with a stronger correlation (R=0.32) but the association between Epsworth sleepiness score and AHI was not significant (P=0.79, R=0.02, N=193). Interestingly, a significant positive correlation co-efficient (R=0.39, P=0.02) was seen between BMI and AHI in the population of males who were overweight, hypertensive and diabetic. The same relationship was not significant in females (P=0.1).
Conclusion: In this study, BMI in overweight patients and large neck circumference has positive correlation with apnea-hypopnea-index but no significant association was found between elevated Epsworth sleepiness score and apnea-hypopnea-index. The strength of this study is that it was done in a community-based setting with a realworld patient population. We believe our findings will be applicable to many community-based settings around the countryy.
Epsworth sleepiness score; Obstructive sleep apnea; Metabolic syndrome; BMI; Neck circumference; Apnea-hypopnea index
ESS: Epsworth Sleepiness Score; OSA: Obstructive Sleep Apnea; AHI: Apnea-hypopnea-index; BMI: Body Mass Index; CPAP: Continuous Positive Airway Pressure; PSG: Polysomnography; EDS: Excessive Daytime Sleepiness; SBD: Sleep Breathing Disorder
Sleep breathing disorder (SBD) is a common disorder with global prevalence of almost a billion adults. It is more common in men than women and the prevalence increase with obesity and age.
In a recent study by Franklin et al. the mean prevalence of obstructive sleep apnea (OSA) was 22% (range,9-37%) in men and 17% (range, 4-50%) in women from 11 epidemiological studies published between 1993 and 2003 [1]. The importance of diagnosing OSA promptly and timely cannot be overemphasized. Frost and Sullivan stated that about 29.4 million American men and women have sleep apnea and estimate the economic burden of undiagnosed sleep apnea in the US to be around $150 billion annually. In light of the above, better insight into pre-test probability, screening tests, diagnosis and prompt treatment of obstructive sleep apnea will go a long way in reducing morbidity and mortality.
It is well known that obesity is probably the most predictive risk factor for sleep apnea and other factors that also come to play include age, male gender, onset of menopause in females, larger neck circumference, and presence of co-morbidities such as hypertension and diabetes [2-14]. There is however some controversy at this time in determining whether hypertension and diabetes are predisposing factors of obstructive sleep apnea or if they arise as clinical consequences of untreated sleep apnea [15-17].
In addition to the risk factors mentioned above, the Epworth sleepiness scale that was developed to subjectively grade the severity of excessive daytime somnolence has been shown by some studies to be predictive of the presence of obstructive sleep apnea [18-20]. Some other studies however found it not predictive of obstructed sleep apnea [21-24]. The Epworth sleepiness scale is a selfadministered questionnaire asking how likely a patient is to doze off while engaging in 8 different activities during daytime and each answer gets a score between 0 and 3 (with the number increasing with severity). The minimal possible score is 0 while the maximum possible score is 24 with a cut-off of 9 being set as the upper limit of normal.
The aim of this study is to determine the association of Epsworth sleepiness score with AHI in a cohort of 529 subjects that presented to a community-based practice for sleep evaluation. We also determined the association that obstructive sleep apnea (OSA) has with large neck circumference and being over-weight/obese in our subjects.
Data for this study was collected by reviewing charts of 529 consecutive subjects (262 males and 267 females) who had sleep evaluation at a community-based practice between October 2018 and March 2019. The population is diverse consisting of Caucasians, Hispanics and African Americans with the age range of males being 19 years to 87 years while that of females was 23 years to 89 years.
186 (35%) of the subjects were not included in our analysis because they had incomplete data. A total of 343 patients (183 males and 160 females) were analyzed in this study and 252 (73.5%) of them were diagnosed of sleep apnea based on apnea-hypopnea index of ≥5 per hour on polysomnography.
Of the 186 subjects who were excluded because of incomplete data, 74.1% were found to have sleep apnea which is comparable to the percentage of patients with sleep apnea in the population that was used for the analysis. We believe the similarity between the data should minimize the bias of using skewed data for our analysis.
Most of the subjects underwent a full overnight in-laboratory diagnostic polysomnography (PSG) while a few had home sleep testing. In those who had full overnight in-laboratory polysomnography, electroencephalography electrodes were positioned according to the international 10-20 system. PSG consisted of monitoring of sleep by electroencephalography, electrooculography, electromyography, airflow, respiratory muscle effort and included measures of electrocardiographic rhythm and blood oxygen saturation. Thoracoabdominal plethysmograph, oronasal temperature thermistor, and nasal-cannula pressure transducer system were used to identify apneas and hypopneas. Transcutaneous finger pulse oximeter was used to measure oxygen saturation. Sleep was recorded and scored according to the standard method. AHI was the sum of the number of apneas and hypopneas per hour of sleep. OSA was defined as an AHI of ≥5 events per hour. An AHI of <5 events per hour was considered within normal limits.
The information collected include their age, body mass index (BMI in kg/m2; the most commonly used method to measure obesity, was calculated by dividing weight in kilograms by the square of height in meters), neck circumference (NC; measured in inches at the level of the cricothyroid membrane), Epsworth sleepiness score, the absence or presence of excessive daytime sleepiness, hypertension, diabetes and apnea-hypopnea index (AHI) which is the combined number of apneas and hypopneas that occur per hour of sleep. ESS ≥10 was considered elevated while large neck circumference was set at ≥16 inches in females and ≥17 inches in males. A BMI of 25 kg/ m2 and was classified as overweight for both males and females.
Statistical analysis was computed using SPSS for Mac Os, results were expressed as mean ± standard deviation and the strength of the correlation between variables (R-Value) which was computed using the Pearson’s test. Statistical significance was concluded in cases with P<0.05. Regression estimation graphs were used to express results of association.
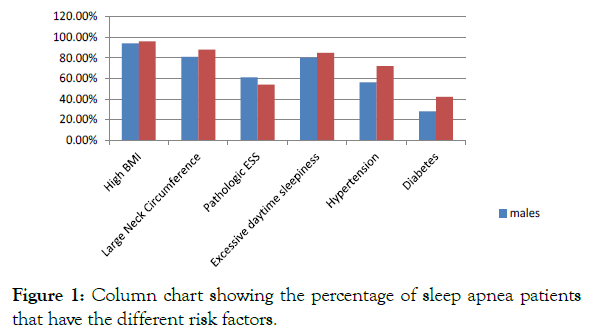
Statistical difference was seen between the BMI of males and females (P=0.004) and also their neck circumference (P<0.001) whereas the mean age and ESS was similar in both groups (Tables 1, 2 and Figure 1).
| Males (137) | Females (115) | Total (252) | P value | |
|---|---|---|---|---|
| Mean Age (Years) | 54.6 ±14.8 | 56.8 ±14.3 | 55.6 ±14.6 | P=0.16 |
| Mean BMI (kg/m2) | 34.3 ±8.2 | 37.1 ±9.6 | 35.6 ±9.0 | *P=0.004 |
| Mean Neck Circ (Inches) | 17.5 ±1.1 | 17.0 ±1.2 | 17.2 ±1.2 | *P<0.001 |
| Mean ESS | 11.3 ±5.8 | 11.0 ±6.4 | 11.2 ±6.1 | P=0.66 |
ESS: Epsworth sleepiness score, Circ-Circumference, *= Significant difference in the independent statistics.
Table 1: Demographic data distribution of subjects with OSA (Total number 252).
| Males (137) | Females (115) | Total (252) | |
|---|---|---|---|
| High BMI | 129 (94.2%) | 110 (95.6%) | 239 (94.8%) |
| Large Neck Circumference | 111 (81.0%) | 101 (87.8%) | 212 (84.1%) |
| Elevated Epsworth sleepiness score | 83 (60.5%) | 62 (53.9%) | 145 (57.5%) |
| Excessive daytime sleepiness | 109 (79.6%) | 98 (85.2%) | 207 (82.1%) |
| Hypertension | 76 (55.5%) | 83 (72.2%) | 159 (63.1%) |
| Diabetes Mellitus | 38 (27.7%) | 48 (41.7%) | 86 (34.1%) |
Table 2: Frequency of risk factors in subjects with OSA (Total number 252).

Figure 1: Column chart showing the percentage of sleep apnea patients that have the different risk factors.
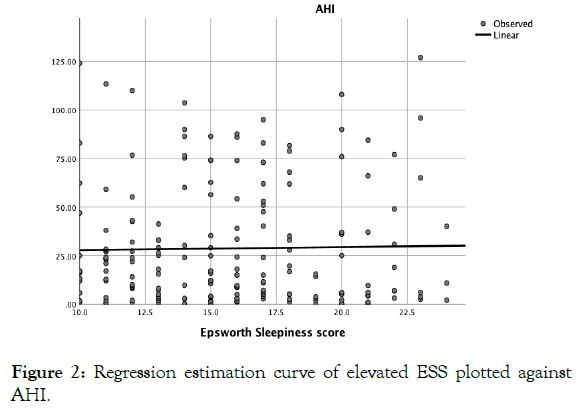
No association was found between elevated ESS and AHI in males (P=0.31), females (P=0.51) and when the data of both genders were analysed together (P=0.79).
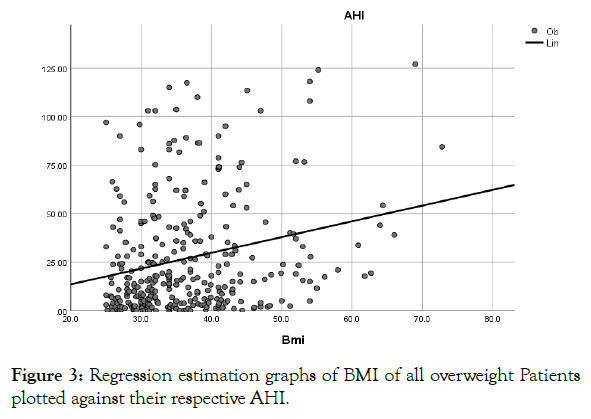
A significant correlation was found between high BMI and AHI in males (P<0.001, R=0.29, N=170), females (P<0.001, R=0.31, N=149) and both genders when analysed together (P<0.001, R=0.24, N=319).
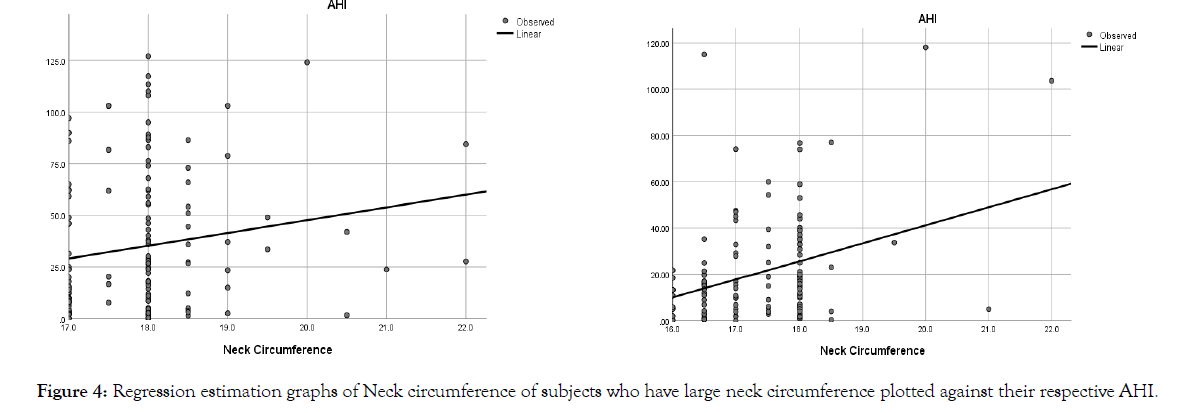
A significant correlation was also found between large neck circumference and AHI in males (P=0.047, R=0.17, N=143), females (P<0.001, R=0.32, N=128) and both genders analysed together (P<0.001, R=0.26, N=271) (Tables 3, 4 and Figure 2).
| Gender Relationships tested | Male (183) | Female (160) | Total (343) |
|---|---|---|---|
| Pathologic ESS and AHI | No Correlation P= 0.31 |
No Correlation P=0.51 |
No Correlation P=0.79 |
| High BMI and AHI | R=0.29 **P<0.001 N=170 |
R=0.31 **P<0.001 N=149 |
R=0.24 **P<0.001 N=319 |
| Large NC and AHI | R=0.17 *P=0.047 N=143 |
R=0.32 **P<0.001 N=128 |
R=0.26 **P<0.001 N=271 |
NC: Neck Circumference; R: Pearson’s coefficient; P:P value; N: Number of Patients Test; *correlation is significant at the 0.05 level; **correlation is significant at the 0.01 level
Table 3: Pearson’s test results between High BMI, Large neck circumference, Elevated ESS and AHI.
| Has Sleep Apnea on Polysomnography | No sleep apnea on Polysomnography | Total | |
|---|---|---|---|
| Pathologic ESS | 145 | 48 | 193 |
| Non-Pathologic ESS | 107 | 43 | 150 |
| Total | 252 | 91 | 343 |
Sensitivity=145/252 = 57.5% Specificity=43/91=47.3% |
|||
Table 4: Evaluation of ESS as a diagnostic test for sleep apnea.

Figure 2: Regression estimation curve of elevated ESS plotted against AHI.
A positive correlation existing between the BMI of 319 subjects who had a BMI greater than 24.9 kg/m2 and their respective AHI obtained from their sleep study (Figures 3 and 4).

Figure 3: Regression estimation graphs of BMI of all overweight Patients plotted against their respective AHI.

Figure 4: Regression estimation graphs of Neck circumference of subjects who have large neck circumference plotted against their respective AHI.
These graphs show a positive correlation between neck circumference and AHI in both males and females who have a large neck circumference with a stronger correlation seen in females (R=0.32) than males (R=0.17).
Finally, the correlation between BMI and AHI in males with BMI≥25 kg/m2 who have hypertension and diabetes (P=0.02, R=0.39, N=34) was found to be stronger than what was seen between AHI and BMI only in overweight and obese male (Table 5).
| BMI against AHI Patients who are Overweight/obese, Hypertensive and Diabetic | |
|---|---|
| Male (183) | R=0.39 *P=0.02 N=34 |
| Female (160) | No Correlation P=0.1 N=56 |
R:Pearson’s coefficient; P=P value; N=Number of Patients tested; *correlation is significant at the 0.05 level.
Table 5: Pearson’s test results between High BMI and AHI in subjects who have both hypertension and diabetes.
Excessive daytime sleepiness (EDS) is seen in about 10-25% of the general population. ESS is a subjective instrument used for measuring and grading the severity of EDS. In our experience a vast majority of patients who complain of daytime sleepiness have their ESS forms with scores less than ten. In this study, we performed multivariate Pearson’s analysis to identify independent OSA predictors.
82% of the subjects in this study with OSA complained of EDS whereas only 57% of them have an elevated ESS. The sensitivity of the ESS for predicting the presence of sleep apnea is very weak (57.5%) and no association was seen between ESS and AHI. Kapur VK et al. did a cross sectional study in a cohort of 6440 subjects and came to the same conclusion similar to our study [25]. Our study also did not find any association between AHI and ESS on linear regression which confirms the finding from the study by Rasmus Rude Laub et al. which found no association between AHI and ESS in a cohort of 687 patients with suspected sleep apnea [26].
Our study supports the position of the AASM guideline that stated that clinical tools, questionnaires, and prediction algorithm should not be used to diagnose or exclude the presence of sleep apnea [27].
If an ESS ≥10 was the only criteria considered before ordering PSG for all the subjects in our study, only 42% of subjects who have OSA would have had PSG done. After common causes of EDS such as insomnia, sleep insufficiency, and drugs have been excluded, PSG should be performed irrespective of the score on ESS.
STOP-BANG questionnaire was used to screen most of our subjects who presented for preoperative evaluation prior to having PSG done in those who had elevated scores, but we did not compare the association of OSA with STOP-BANG in our analysis. The STOPBANG has been shown in multiple studies to show a high level of sensitivity for predicting moderate and severe OSA however the Positive predictive value is not very good because of its low specificity [28-30]. Berlin questionnaire is another proposed screening tool for OSA but its performance for detecting sleep apnea in the middleaged general population has been questioned [31,32].
Our study showed association between being over-weight/obese and the presence of OSA. 95% of our subjects with OSA have BMI greater than 24.9 kg/m2. There was also a significant association between BMI and AHI on linear regression which indicates that the higher the BMI the worse the severity of the sleep apnea. This significant association between BMI and AHI was noted in both males and females.
We found a positive association between large neck size and AHI, confirming the association between large neck size and AHI as reported by other studies [3,33,34].
When we explored the association between BMI and AHI in subjects who were both hypertensive and diabetic, we found the association between BMI and AHI was stronger in males who had both co-morbidities than the association seen between BMI and AHI in the general male population of our study. This association was however not significant in females. The reason why there was no association noted in females is not known but we postulate that the association may be more pronounced in males and not noted in females because OSA is commoner and more severe in males than in females [35]. Another possible reason could be that both type 2 diabetes and hypertension is more common in men than women [36-38]. In general, the association of OSA and hypertension is incontrovertible. There are studies that have showed causal relationship between the OSA and hypertension [27,39] but the Victoria sleep study of Spain [40] failed to show any association between OSA and hypertension.
The study supports the body of evidences that similarly show that ESS is not a good predictor of the presence of sleep apnea [22,41-43] and less emphasis should be placed on it when determining whether PSG should be performed in patients suspected of having sleep breathing disorder.
We acknowledge the contribution of Dr. Carlos Molinares (PhD) and Dr. Helen O. Oderinde (MS Clinical Psychology, EdD Educational Leadership) that helped with statistical analysis and provided oversight.
Citation: Alabi FO, Alabi CO (2019) The Predictive Value of Epworth Sleepiness Scale in Obstructive Sleep Apnea. J Sleep Disord Ther 8:303. 10.35248/2167-0277.19.8.303
Received: 18-Aug-2019 Accepted: 18-Sep-2019 Published: 25-Sep-2019 , DOI: 10.35248/2167-0277.19.8.303
Copyright: © 2019 Alabi FO, et al. This is an open-access article distributed under the terms of the Creative Commons Attribution License, which permits unrestricted use, distribution, and reproduction in any medium, provided the original author and source are credited.