Journal of Geography & Natural Disasters
Open Access
ISSN: 2167-0587
ISSN: 2167-0587
Research Article - (2024)Volume 13, Issue 4
The most significant strategy to address flood hazards is to conduct a Flood Vulnerability Assessment (FVA) because it informs the disaster risk reduction and preparedness process. FVA provides metrics that can help manage flood risks and disaster events. However, many flood vulnerable regions like Malawi still lack FVA-supporting frameworks in all phases (pre, trans, and post-disaster). Partly, this is attributed to a lack of evidence-based studies to inform the processes. On one hand, the frameworks that exist in Malawi such as the Unified Beneficiary Register (UBR) and Rapid Assessment (RA) are tools that reflect the aftermath of a disaster. On the other hand, the Participatory Vulnerability Capacity Assessment (PVCA), though used as a tool, cannot be negated that it is an approach rather than a tool because indicators have been not suggested. This informed the need to assess Households’ Flood Vulnerability (HFV) in the Mtandire ward of Lilongwe City (LC) and Traditional Authority (T/A) of Karonga District (KD) to propose an FVA framework for rural and urban informal settlements in Malawi and beyond. A household survey was used to collect data from a sample of 545 households’ participants in June-August 2021. Vulnerability was explored through a combination of Underlying Vulnerability Factors (UVFs) with Vulnerability Components (VCs). The UVFs and VCs were agglomerated using abinomial multiple logit regression model. Variance Inflation Factors (VIFs) were used to check the multicollinearity of variables in the regression model. The analysis was carried out using R software and STATA. Multiple Correspondence Analysis (MCA) and Artificial Neural Network (ANN) were conducted to determine the variability of factors contributing to vulnerability. The results reveal a total average score of high vulnerability (0.62) and moderate vulnerability (0.52) on MCA in T/A Kilupula and Mtandire ward respectively. The results further show that all the indicator variables in Mtandire ward have an inertia value at the expected rate of less than 10% while in T/A Kilupula lack of credit unions (0.103), lack of markets (0.499) and poverty (0.123) display values that deviate from the expected score of <10%. The study concludes that the determinants of households’ flood vulnerability are place settlement, low-risk knowledge, communication accessibility, lack of early warning systems, and limited access to income of household heads. This study provides an FVA framework that could be applied to promote the resilience of communities to mitigate flood risks and support the planning and decision-making process in Malawi and at any region in the world because all the input data is globally available.
Vulnerability assessment; Floods; Climate change; Lilongwe city; Karonga; Malawi
In recent years, the world has deviated from flood hazard control to flood vulnerability assessment [1]. Vulnerability refers to the extent to which the population, communities, country, regions systems or structures are prone/susceptible to damage or injury from hazards. Coppola defined the term as a measure of the propensity of an object, area, individual, group, community, country, or other entity to incur the consequences of a hazard. Susman describes vulnerability as the degree to which different classes of society are at risk. Wesner et al. define vulnerability as characteristics of a person or group in terms of their capacity or ability to anticipate, cope with, resist and recover from the impacts of a hazard. Birkmann et al. looked at vulnerability as exposure to contingencies and stress, and difficulty in coping with them. In this case, Birkmann et al. indicate that vulnerability has thus two sides: An external side of risks, shocks and stress to which an individual or household is subject; and an internal side that is, defencelessness meaning, a lack of means to cope without damaging loss [2]. Wisner et al. states that vulnerability has been defined as the characteristics of a person or group and their situation that influence their capacity to anticipate, cope with, resist and recover from the impact of a natural hazard. Kron maintain that vulnerability is a multi- layered and multi-dimensional social space defined by the political, economic, and institutional capabilities of people in specific places. This study defines vulnerability as conditions that predispose households or systems to incur loss based on interaction of underlying vulnerability factors (physical, social, economic, environmental, cultural) and vulnerability components (exposure, susceptibility and resilience).
The concept of vulnerability clarifies the significant confusion in the usage of the terms “natural hazards” and “natural disaster”. What makes a hazardous event like flood to become disaster is the ability of the society and community preparedness and response mechanism. This in turn is significantly governed by the vulnerability and capacity of the society itself. Therefore, it is a misnomer to refer a flood as a disaster. Literature reveals that vulnerability induces floods to become disasters [3]. A flood hazard event can strike an uninhabited community, but a disaster can exist only where people and livelihood assets related to them suffer. While many definitions exist, a disaster in this case, is defined as the interaction of hazard (flood) and vulnerability resulting in a noticeable consequence affecting the normal functioning of the community. Floods are the processes whereas disasters are the results or responses of floods. Floods may create extreme events, but not all extreme events become disasters. Disasters originate from the interaction between biophysical vulnerability and social vulnerability [4].
Therefore, vulnerability assessment is a primary component of flood hazard mitigation, preparedness and management [5]. Several studies that have attempted to assess flood vulnerability have used single dimensional indicators [6]. Those that have combined the indicators have not gone further to propose FVA frameworks to support decision making [7]. While this is so, floods affect many people worldwide [8]. The emergency events database indicates that 50,000 people died and approximately 10% of the world population was affected by floods between 2009 and 2019 [9]. While the level of vulnerability differs between developed and less developed nations, but floods recently, have shown vulnerability of all the regions with numerous effects [10]. In the developed world, the Germany floods in July 2021 [11], the destruction of Louisiana in USA [12], the 2001 floods in the city of Kempsey in Australia [13] and the occurrence of floods in China [14] and Poland [15] are among the key examples that reveal flood vulnerability. According to statistics provided by the National Centers for Environmental Information (NCEI), the average annual cost of flooding from 1980 to 2022 in the United States is approximately $4.0 billion US dollars [16]. Developing countries such as Benin, Nigeria, Senegal and Sudan have recently experienced severe flooding leaving a considerable number of human casualties and thousands displaced [17]. In the Sub- Saharan African (SSA) region, floods and droughts account for 80% and 70% of disaster-related deaths and economic loss respectively [18]. In Southern Africa, the cyclone Eline induced floods of 2000 resulting in huge loss for communities of the Zambezi Basin [19]. About 700 people died, over 500,000 people were left homeless and damage to infrastructure of over US$ 1 billion was incurred. Further, the 11-13 April 2022 floods in South Africa left 448 people dead and 40,000 people displaced [20]. Similarly, in January 2011, floods caused death of 11 and 2 people in Luanda Providence in Northern Angola and Madagascar respectively. Statistics for the reported economic losses due to natural disasters in Africa, for the 1970–2019 period, revealed that the cost of floods is around 13.09 billion U.S. dollars [21]. Undoubtedly, people in developing countries have the limited capacity to resist the impact of hazards such as floods. This is the major reason to undertake Flood Vulnerability Assessment (FVA) in developing countries like Malawi.
In Malawi, floods are the most frequent natural hazards causing devastating impacts in both rural and urban areas. For instance, between periods of 2015-2023, about four major floods induced by tropical cyclones have affected communities. The most destructive were floods of 11-13 March 2023, influenced by Tropical Cyclone Freddy (TCF) which developed in the Western Indian Ocean and moved eastwards [22]. The TCF caused multiple flash floods and landslides which killed about 679 people, injured 2178 people, displaced 563,602 people, and about 511 people were reported missing, including causing several other damages and loss in sectors such as agriculture, infrastructure, food security and health. The response to this catastrophic, including the previous floods tailored more on rescue and relief operations. While these are critical to save lives and to provide immediate relief and short term support, they cannot provide long terms solutions for programming current and future floods impacts resulting from these cyclones. As such, the application of FVA can provide practical solutions for programming current and future flood mitigation measures in a sustainable and long term process.
FVA provides a significant opportunity towards identifying factors leading to flooding losses [23]. FVA is an impetus in which science may help to build resilient society. FVA provides metrics that can support decision-making process and policy interventions. FVA is a proactive task for pre-hazard management and planning activities [24]. Nazir et al. notes that FVA provides an association between theoretical conceptions of flood vulnerability and daily administrative process. Therefore, vulnerability to natural hazards must be quantified and analysed to identify specific dimensions that make household face a hazard differently. Birkmann et al. argue that the need to understand vulnerability is a primary component of disaster risk reduction at household and community level and culture of building resilience. Iloka highlights that measuring vulnerability helps to determine immediate impacts on lives as well as future impacts of the affected households and communities. The Sendai Framework (2015-2030), an international policy for DRR also emphasises on vulnerability assessment as a tool for minimizing the impact of hazards [25]. The Sendai Framework posits that Vulnerability Assessment (VA) should be conducted to understand risk in all dimensions of vulnerability, capacity, exposure of persons, hazard characteristics and the environment. Birkmann et al. suggest that a vulnerability assessment is a prerequisite to reduce the impacts of any natural hazard. Therefore, in order to propose the FVA framework, this study quantified and predicted household vulnerability to floods in rural and urban informal settlements of Karonga district and Lilongwe city respectively [6]. The quantification was premised on the understanding that vulnerability implies the conditions that predispose households or systems to incur loss based on interaction of underlying vulnerability factors (physical, social, economic, environmental, cultural) and vulnerability components (exposure, susceptibility and resilience).
Contextualisation of FVA in Malawi
FVA is a step towards reducing flood hazard impacts [26]. It constitutes a step in the process of measuring vulnerability to identify vulnerable areas in all aspects of multi-dimensional measures such as physical, social, economic, environmental [27] and exposure, susceptibility as well as adaptive capacity. It is a primary component of disaster risk reduction [28]. However, in Malawi, FVA has been rarely understood. This is compounded by lack of comprehensive and standardised flood vulnerability assessment tools and guidelines. The Government of Malawi (GOM) through the Malawi Growth and Development Strategy (MGDS III) seeks to build a productive, competitive and resilient nation by reducing vulnerability and enhancing the resilience of its population to disasters and socio-economic shocks [29]. GOM has developed enabling policy frameworks to enhance vulnerability assessment, risk characterisation and knowledge management in disaster risk management. Among the key framework relevant to this study, include; (1) Malawi National Disaster Risk Management Policy, 2015. The policy acknowledges the significant role of vulnerability assessment to reduce the disaster risk. Disaster Risk Management Act [30]. The Act provides the structures to assist the implementation of disaster risk reduction programmes from village level to national level. It creates the legal and institutional framework for addressing disaster in Malawi. The established institutional mechanisms include the National Preparedness and Relief Committee (NDPRC), National Preparedness and Relief Technical Committee (NDPRTC) and other technical committees such as Village Civil Protection Committee (VCPC), Area Civil Protection Committee (ACPC) and District Civil Protection Committee (DCPC). While floods occurrences are common in both urban and rural areas of Malawi with varying impacts on households and infrastructure, few studies have been conducted targeting either urban areas [31] or rural areas of Malawi [32]. This implies that there are limited studies that support a comparison of flood vulnerability assessment in rural and urban informal settlements. For example, across the world, majority of the studies (62.1%) focused on the neighbourhood followed by 14.7% in the city [33]. Indisputably, there is a neglect to develop FVA framework, which would guide vulnerability assessment in rural and urban informal settlements. The Malawi National Disaster Risk Management Policy [34] maintains that vulnerability assessment has not been done in a comprehensive manner. While this is the case, the Social Vulnerability Index (SVI) ranks Malawi with high vulnerability of 0.6 arbitrary units of societal vulnerability [35]. As such, the need for comprehensive analysis of vulnerability to particular hazards like floods in order to increase assessment methods of flood vulnerability, which can support decision makers in flood disaster management, is required. Doing so, would unveil the real trigger causes of vulnerability that make the majority of Malawians to suffer from flood hazards in rural and urban informal settlements.
Lack of FVA studies that compare rural and urban vulnerability, negatively impact on the development of vulnerability assessment framework that could be utilised in national policy and planning making for effective disaster risk management. It also makes Malawi to lack a strategy to invest its scarce resources to minimise the damage related to flood disasters [36]. It further makes the DRM be characterised by post-event humanitarian actions and relief activities. It also makes the country to lack scientific data and framework that could be utilised to compare households’ vulnerability to floods between rural and urban settlements. Finally, it makes the achievement of priority area 3 aimed at ensuring comprehensive disaster risk identification, assessment and monitoring system is established and functional in the NDRM policy to be practically difficult. Hence, this study conducted flood vulnerability assessment in rural and urban informal settlements in Malawi in order to compare household vulnerabilities and propose a flood vulnerability assessment framework. Otherwise, lack of studies like this one, prevent the country from identifying best measures for strengthening communities’ resilience to flood hazards and disasters at large.
Theoretical frameworks of vulnerability
Vulnerability is viewed through the lens of multiple contexts, dimensions and spatiotemporal scales [37]. It is pointed out that there is no universal theory or model for measuring vulnerability [38]. Birkmann argues that measuring vulnerability can help to develop indicators that can reduce vulnerability of societies at risk. In this regards, measuring vulnerability provides opportunity for identifying vulnerabilities of specific people and specific areas. Many contemporary vulnerability theories and frameworks have been developed in the context of disaster resilience in order to develop methods of measuring vulnerability [39]. They include; sustainable livelihood framework [40], hazard of place framework [41], Birkmann, Boarguard and Cadona–BBC model [42], International Strategy for Disaster Risk (ISDR) Framework and Turner et al. vulnerability framework. The sustainable livelihood framework looks at vulnerability as failure to access and maintain livelihoods [43]. It measures the accessibility and availability of livelihood capitals such as human, natural, social, physical and economic. The hazard of place framework [44] stresses that vulnerability is based on geographical and specific conditions of an area. Therefore, it emphasizes that each place needs to be examined based on its uniqueness. It acknowledges the combination of biophysical and social vulnerability for risk creation. Similarly, BBC framework, underscores vulnerability as a function of exposure, susceptibility and coping capacities. It argues that identification of interventions to reduce vulnerability could be crucial to reduce the potential risks that might be created by the hazards. It further emphasises that vulnerability should be analysed from a social, economic, environmental perspective. Last, but one, the ISDR Framework for disaster risk reduction [45] separates vulnerability from hazards. It argues that vulnerability is a standalone entity of the hazard, and thereby risks originate from two different phenomena. The framework conceptualises vulnerability as having four dimensions; social, economic, environmental and physical. Finally, the Turner et al. vulnerability framework, views vulnerability as result of exposure, susceptibility and responses (coping responses, impact responses, adaptation responses). It argues that the linkages of human and biophysical processes contribute to vulnerability. In this study, these frameworks were deductively assessed in order to identify indicators of flood vulnerability assessment which could be used to benchmark and compare with the indicators of FVA framework. However, for inductive assessment, the selection of indicators in this study focused much on the Pressure and Release model and urban flood vulnerability framework as key theoretical frameworks [46].
Conceptual framework on flood vulnerability
This study developed a conceptual framework based on the understanding that a disaster occurs as an intersection of vulnerability and hazard [47]. This approach deviates from the dominant views that focus on one side of vulnerability assessment either UVFs or VCs. Using both domains means that this study contributes to widening the methodologies of assessing vulnerability in Malawi and the World at large because the input data can be available everywhere. Some studies in Sub- Sharan African (SSA) have mainly been focusing on one dimension [48]. This conceptual framework considered the physical, social, economic, environmental and cultural domains on one end and on the other end, it considered exposure, susceptibility and resilience domains (Figure 1).

Figure 1: Conceptual framework.
This conceptual framework indicates that two forces create vulnerability of households/communities to floods. First, households can be vulnerable to floods when subjected to the underlying vulnerability factors (physical, social, economic, environmental and cultural causes). Each of the causes, physical-social-economic-environmental-cultural, have the indicators that are used to identify households’ vulnerability to floods. Depending on variations that exist among these indicators in terms of their scores, percentages, inertias and probability values, households may be determined and/or predicted their vulnerabilities. The determination and prediction can be based on Flood Vulnerability Index (FVI) scale range 0 to 1. The second force is determined by vulnerability components (exposure, susceptibility and resilience). Households are vulnerable to floods if they are exposed and susceptible to it and have less resilient to withstand its impacts. In this study, exposure is portrayed as the extent to which an area that is subject to an assessment falls within the geographical range of the hazard event. This implies that exposure looks at the possibility of flooding to impact people and their physical objects in the location they live. Hence, exposure was linked with physical and environmental vulnerability factors to predict household vulnerability. Furthermore, susceptibility means the predisposition of elements at risk (social and cultural) to suffering harm resulting from the levels of fragility conditions [49]. Therefore, susceptibility was linked to social and cultural vulnerability factors during the assessment. In the same vein, the resilience of households is evaluated based on the capacity of people or society potentially exposed to hazards to adapt, by resisting or changing in order to reach and maintain an acceptable level of functioning and structure [50]. This is determined by the degree to which the social system is capable of organising itself to increase its capacity for learning from past disasters for better future protection and to improve risk reduction measures as well as to recover from the impact of natural hazards [51]. It can be argued that resilience is a measure of insufficient resources to withstand a hazardous situation. As such, in this study, it was related to economic vulnerability during assessment. Iloka states that low incomes, lack of resources, and unemployment are some of the factors that make vulnerability leading to disasters.
Study area
This study was carried out in Lilongwe City and Karonga District in the central and northern regions of Malawi respectively (Figure 2). Specifically, this study was carried out in Mtandire Ward (area 56) (Figure 3) and Traditional Authority Kilupula (Figure 4) in Lilongwe City and Karonga District respectively. The areas were selected based on spatiotemporal flood hazard characteristics such as frequency, location, manageability, and forewarning. Kissi indicate that the magnitude of an extreme event is inversely related to its frequency of occurrence.

Figure 2: Map of Malawi showing location of Lilongwe city and Karonga district.

Figure 3: Map of Mtandire ward in Lilongwe city.

Figure 4: Flood map of T/A Kilupula in Karonga district.
On the one hand, Mtandire Ward is an informal settlement which is found in Senior Chief (SC) Chigoneka. Therefore, this study targeted households in Senior Chief (SC) Chigoneka of Mtandire Ward. The area of SC Chigoneka is bounded by the Lingadzi drainage system. This river system is prone to flooding, making the residents susceptible to disasters. The area was chosen because of is an informal settlement, compounded by unplanned areas developed without following any planning layouts or standards. The area has varied housing quality built of temporary building materials. On the other hand, the target areas in T/A Kilupula were Group Village Headmen (GVH) Matani Mwakasangila and Mujulu Gweleweta. The area of GVH Matani Mwakasangila and is located about 16 km north of Karonga town. This area experiences flooding almost every year, making residents susceptible to flooding.
Measuring flood vulnerability
Flood vulnerability measurement is not easy and straightforward. Moreira et al. states that though there is an increasing body of research on flood vulnerability, methods in the construction of vulnerability indices are still lacking. Nazeer et al. states that vulnerability has no single universally “best” methodological approach for the formulation of indicators because of its data-specific nature of each single study. In this regards, several methods of measuring vulnerability appear in literature: First, the Social Index (SoVI) identifies dominant vulnerability factors from a large set of social vulnerability factors using Principal Component Analysis (PCA). Second, critical infrastructure and sectors assessment is based on the ground survey of the exposure and susceptibility of basic infrastructure services and facilities such as hospitals and schools. Third, Community-Based Assessments (CBA) involve the use of active participation of local communities in identifying the hazards, vulnerabilities, and risks through such methods as transect walks, risk mapping, asset inventories, livelihood surveys, focus group discussions, or key informant interviews. Fourth, the multi-dimensional model approach gives a holistic approach to flood vulnerability assessment. It quantifies vulnerability indicators using the participatory approach though the application of the Flood Vulnerability Index (FVI). Fifth, method involves conducting a risk assessment. According to ISDR, risk assessment considers potential hazards, estimating the likelihood or probability of those impacts occurring and the consequences or potential harm that would result; Vulnerability Index System (VIS) which is commonly used in flood vulnerability because to incorporate complex indices and has the ability to allow the weighting of their indicators. Vulnerability Curve Method (VCM) is normally found in real damage investigation, but it takes a lot of time and resources. Finally, the Disaster Loss Model Data (DLMD) focuses on demonstrating the losses in simulation analysis. It encounters the problem of low validity of data shortage in most of the countries or regions. Therefore, this study applied the VIS method because which was linked with the indicator-based approach derivation of flood vulnerability indicators using binomial logistical regression model and Minitab-multiple Correspondence Analysis (MCA). The final determination of vulnerability based on the output of the logistical regression was compared to the Flood Vulnerability Index (FVI). The FVI uses a probability range of 0 to 1, with index value 0.32-0.40 (very low vulnerability, 0.41-0.49 (low vulnerability), 0.50-0.59 (moderate vulnerability), 0.60.0.79 (high vulnerability), and 0.8 to 1 (very high vulnerability).
Determination of household flood vulnerability
Vulnerability is a complex concept and includes diverse components. Therefore, vulnerability requires a comprehensive methodology that can help to reveal various components. Rana et al. stipulate that there is a lack of integrated methodology that fuses all the component. This study used indicator based approach to quantitatively assess household flood vulnerability. The determination was based on the Flood Vulnerability Index (FVI). As accorded by ISDR, quantitative approach was useful to establish indicators of FVA framework. Chakraborty et al., Hudrikova, Kablan et al., and Nazeer et al. agree that quantitative indicators are used to predict flood vulnerability. However, variation exists on the selection of the quantitative tools. For instance, Nazeer et al. applied Pearson’s correlation to predict flood vulnerability. Kissi et al. used deductive and inductive approaches to select flood vulnerability indicators. This study used binomial multiple logistical regression to predict household flood vulnerability. The use of this method allowed to agglomerate the indicators of the UVFs and VCs.
Study population and sampling determination
The target flood-prone area of TA Kilupula in KD was selected based on the frequency of flood occurrence. Kissi et al. indicate that the magnitude of an extreme event is inversely related to its frequency of occurrence. Whilst, Mtandire Ward in Lilongwe city was chosen because it is an informal settlement. Household participants in Mtandire ward were those specifically in two Group Village Headmen, Chibwe and Chimombo of Senior Chief Ligomeka. These villages are located along Lingadzi River opposite area 49 (New Gulliver). This study used a total of 10 headmen (VH). The choice of the VH was based on proximity to Lingadzi River. Mtandire has total population of 66,574 people, but 5000 people are reported to be at risk to floods. Relatedly, the target population in Karonga district were households of GVH Matani Mwakasangila and Mujulu Gweleweta in Traditional Authority (TA) Kilupula. These household villages share a network of water systems such as Lufilya, Mberere, Ntchowo and Fwira. This study used a total of 10 Village Headmen (VH), five from each GVH. The choice of five VH in each GVH was based on the fact that each GVH in T/A Kilupula has a minimum number of five Village Headmen. T/A Kilupula has a total population of 78,424 people, with approximately 9,500 households at risk of floods.
The sample size (n) for this study was calculated using the formula in Fisher et al. as shown in the equation (1). The formula in equation returns the minimum sample size required to ensure the reliability of the results.
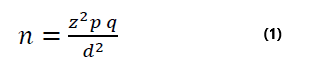
In equation (1), Z is the confidence level (1.96 for 95%), p is the proportion of the target households, q=is the alternative (1-P) and d is the power of precision (d=0.05 at 95%).
The formula requires to know the target population (P) and it also assumes “P” to be 0.5 which is conservative. Therefore, the fact that the number of households prone to floods in T/A Kilupula and Mtandire ward is known, using this formula, 384 and 246 households were obtained from Mtandire ward and T/A Kilupula respectively. The study used 0.5 (50%) to represents “P” in Mtandire Ward and 0.2 (20%) to represent “P’ in T/A Kilupula. The reason for differentiating the “P” was that in the Mtandire ward the whole area was selected while in T/A Kilupula not all the GVHs were selected and involved in the survey. Furthermore, unlike in T/A Kilupula where the population is sparsely distributed and households were selected based on location to flood-prone areas, in Mtandire ward 50% was used as conservative because of high population density such that it was possible to interview many households. During data collection, the researcher managed to collect data from 345 and 200 household participants, representing 90% and 81% of the total sampled in Mtandire ward and T/A Kilupula respectively. The reason for not completing the actual sample size was that the household survey interviewed houses along the buffer zones of Lingadzi and Lufilya rivers and the whole area of the buffer was randomly selected. Therefore, continuing to interview every household in the buffered area would have meant interviewing every household. This would have worked against the rule of simple random sampling strategy and survey ethics.
Data collection
The procedure for the determination of household flood vulnerability involved undertaking various steps namely (1) Framing flood vulnerability indicators, (2) Sampling determination, (3) Questionnaire design and administration (4) Indicators derivation, normalization, weighting, and aggregation.
Framing flood vulnerability indicators: Flood vulnerability indicators were selected based on a thorough review of contemporary frameworks such as PAR model and Salami FVA framework. Data variables were classified into two parts namely the UVFs and the VCs. The study used demographic characteristics variables (age, gender, marital status, education and occupation) to provide explanation of the variability of UVFs and VCs on household flood vulnerability using descriptive and inferential statistics. Since there is no general acceptable way of selecting vulnerability indicators, this study considered the indicators based on a cut-off point of probable value zero to one where zero represents minimum and one indicates maximum values.
Questionnaire design and administration: This study used a structured household questionnaire survey. Key variables in the questionnaire were aligned based on the conceptual framework (Figure 1). This questionnaire captured information that provided the linkages of households’ vulnerability factors, exposure, susceptibility and resilience. Associations of vulnerability factors have been supported in literature. Nazeer, et al. argues that the issue of double counting of the indicators is an important step to be considered in the formation of composite indicators. The household questionnaire survey was coded in KoBoToolBox. The household questionnaire survey was administered face-to-face with household participants who were above 21 years old. The age parameter was controlled in the KoBoToolBox environment such that the interviewers could not proceed administering the questionnaire if this question was not answered even if the age entered was below 21. It is also important to note that the attributes to variable age were not coded because it is a continuous variable hence the Research Assistants (RAs) asked the ages directly from the participants to type manually in the system of KoBo. Finally, the household questionnaire survey was pretested and piloted in Mchesi and Mwanjasi in Lilongwe City and Karonga District respectively. Before pretesting and piloting, RAs were trained to have a common local understanding of the terms that were contained in the questionnaire, specifically vulnerability, floods, resilience, susceptibility, adaptive capacity and exposure.
Indicators derivation, normalisation and aggregation: Flood vulnerability was explored through the lens of Underlying Vulnerability Factors (UVFs) physical-social-economic-environmental (Table 1) and cultural with Vulnerability Components (VCs)-exposure-susceptibility and resilience (Table 3). While some of the assessment indicators have been selected from the existing frameworks, implying that they are being tested for their applicability in the context of rural and urban contexts in Malawi, additional of cultural and drainage systems in the environmental category have widen the assessment of vulnerability in this study.
| Vulnerability factor | Indicators | Data source | Weighting scale |
|---|---|---|---|
| Physical | • No construction housing standards • Infrastructural built in substandard way • Low quality building materials |
Structured field survey | 1=Less important 2=Important 3=Very important |
| Social/institutional | • Lack of Knowledge and skills in DRR • Poor access and source of drinking water • Limited/absence of institutional support |
Structured field survey | 1=Less important 2=Important 3=Very important |
| Economic | • No credit unions • Lack of income generating activities • Poverty • No alternative livelihoods |
Structured field survey | 1=Less important 2=Important 3=Very important |
| Environmental | • Pressure on land • Residing in prone areas • Scarcity of energy • Poor drainage systems |
Structured field survey | 1=Less important 2=Important 3=Very important |
| Cultural | • Traditional beliefs • Cultural conflicts • Defiance to safety measures • Absence of ownership of resources |
Structured field survey | 1=Less important 2=Important 3=Very important |
Table 1: Indicators of Underlying Vulnerability Factors (UVFs).
The study measured the level of vulnerability of the elements at risk in all the underlying vulnerability factors (Table 2). These were evaluated based on the constructed scale which modified the Balica and was calibrated as (0-0.2) very low vulnerability; (0.2-0.49) moderate vulnerability; (0.5 to 0.59) vulnerability (0.6-0.79) high vulnerability and (0.8-1) very high vulnerability. However, in the actual data collection tool (household questionnaire survey), measurements scale of “not vulnerable”, “slightly vulnerable”, “vulnerable”, “severely vulnerable” and “do not know” were used and later the percentage obtained during univariate analysis were computed and compared to the weighting scale constructed (3.10). Ndanusa, et al. argued that a breakdown of the elements at risk poses a serious threat to communities' vulnerability and prosperity. This consequently contributes to the higher vulnerability of the community to hazards.
| Elements at risk in UVFs | Indicators | Description | Weighting scale |
|---|---|---|---|
| Physical | • Houses • Toilets • Roads and bridges |
% houses affected % toilets affected % roads damaged |
0.32-0.40 very low vulnerability 0.41-0.49 low vulnerability 0.50-0.59 moderate vulnerability 0.60-0.79 high vulnerability 0.8-1.0 very high vulnerability |
| Social/institutional | • Health posts • Schools • Warehouses • Electricity cables • Farm crops |
% health posts affected % schools affected % warehouses affected % electricity cables affected % farm crops affected |
|
| Economic | • Livestock • Trading and business • Loss of employment |
% livestock lost % trade and business affected % loss of employment |
|
| Environmental | • River channels • Forest cover • Land and soil quality drainage systems |
% river channels affected % forest cover affected % loss of land and soil fertility % of poor drainage systems |
|
| Cultural | • Social networks • Cultural systems and heritage • Loss of important cultural artefacts |
% of loss of social networks % loss of cultural systems % loss of cultural artifacts |
Table 2: Indicators of elements at risk in the UVFs.
The Vulnerability Components (VCs)-exposure-susceptibility and resilience (Table 3) were combined by UVFs. Physical and environmental factors linked to exposure (i.e. human settlement damage, house type, location, rivers). Social and cultural factors combined with susceptibility (i.e. community accessibility, flood risk awareness, adaptation mechanisms, warning systems) to determine household vulnerability. Economic factors linked with resilience (i.e. a source of income, the capacity of economic skills and resource skills).
| Components | Indicators and associated UVFs | Description | Data source |
|---|---|---|---|
| Exposure | Physical | ||
| Extent of damage | % HHs with damaged houses | Structured field survey | |
| House type | % of house type categories | ||
| Environmental | |||
| Surrounded by forest | % Yes=1 and % No=2 | Structured field survey | |
| Geography | % Yes=1 and % No=2 | ||
| River banks | % Yes=1 and % No=2 | ||
| Susceptibility | Social | ||
| Floods risk awareness | % Yes=1 and % No=2 | Structured field survey | |
| Communication accessibility | % Yes=1 and % No=2 | ||
| Adaptation mechanism | % Yes=1 and % No=2 | ||
| Warning systems | % Yes=1 and % No=2 | ||
| Cultural/Human | |||
| Trust in local authority | % Yes=1 and % No=2 | Structured field survey | |
| Protection and response | % Yes=1 and %No=2 | ||
| Prediction method | % None=0, % Scientific Knowledge=1, % Indigenous knowledge=2 | Structured field survey | |
| Resilience | Economic | ||
| Source of income | % HHs source of income | Structured field survey | |
| Education | % HH participants level of education | ||
| Employment | % HH participants employed | ||
| Occupation | % type of occupation of participants | ||
Table 3: Indicators of vulnerability components.
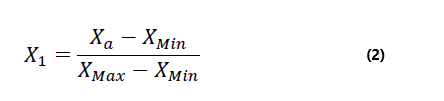
The vulnerability component indicators (Table 3) were normalised to have a comparable set of indicators, the study adopted the Min–Max normalisation to convert the values to a linear scale (such as 0 to 1). Vulnerability increases with an increase in exposure and susceptibility, and it decreases with an increase in Resilience. Therefore, normalisation was based on the assumptions that:
(a) Vulnerability (V) increases as the absolute value of the indicator also increases. In this case, where the functional relationship between the indicator and vulnerability is positive, the normalised indicator is derived using the following equation (2).
(b) Vulnerability (V) decreases with an increasing absolute value of the indicator. Here, when the relationship between vulnerability and the indicator is found to be negative, the data are rescaled by applying the equation (3).
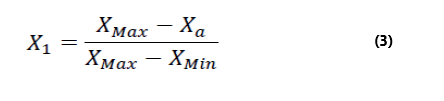
Where:
X1=normalised value;
Xa=actual value;
XMax=maximum value;
XMin=minimum value for an indicator i (1, 2, 3. . . n) across the selected communities.
Furthermore, no weight was assigned to the indicators of vulnerability components. The reason for not including weights was that most of responses during the stakeholders’ engagement were contradictory and highly inflicting. Therefore, to avoid an index value that will mislead the end users, the normalised indicator was aggregated into its respective sub-indices for final flood vulnerability index.
The additive arithmetic function was employed in the aggregation of the indicator into its respective sub-indices (exposure, susceptibility, and lack of resilience) using equation (4).
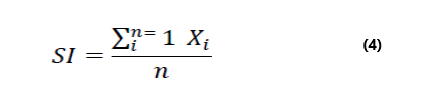
The overall flood value of the vulnerability index was computed with equation (4), an additive function.
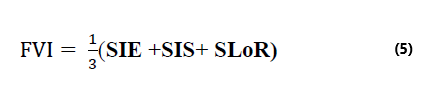
Where,
SIE means Sub-Indices Exposure, Susceptibility (SIS), and lack of resilience (SILoR) for “n” numbers of indicator in each component of vulnerability.
Data analysis
The analysis of household flood vulnerability was carried at two levels. Bivariate analysis looked at the significance levels between demographics and vulnerability factors using the single Chi-square test and a combined P-value analysis package. Bivariate analysis, specifically, the statistical tests such as chi-square tests and probability value (p-value) were used to compute significance levels of variables in UVFs and VCs. Those that were significant were computed in the modified binomial multiple logistical regression model using equations. All these were performed in “R statistical software and STATA version 12. A post analysis of computed results was carried using Artificial Neural Network (ANN). ANN is a machine learning method that stands more independent in comparison than statistical methods. Several studies have used ANN to predict specific events. Due to its predictive ability, this method was applied in this study as a post analysis to predict the causes of flood vulnerability of the variables which were statistically tested using combined P-value package between UVFs and VCs. ANN comprises several nodes and interconnected programming elements. It contains input layers, hidden layers and output layers. The multivariate level used the multiple binomial logistical regression model (Equation 6) to predict household flood vulnerability. It utilised a paired comparison model, in which each UVF was linked with a selected vulnerability component (exposure, susceptibility and resilience). This link is accorded in the studies of Wallen, et al. and Mwale. This model generated the significance levels of physical-exposure, social-susceptibility, eco-resilience, enviro-exposure and cultural-susceptibility. Then, Flood Vulnerability Index (FVI) was applied to determine which factor contributes vulnerability. The FVI uses a probability range 0 to 1 where 0 means not vulnerable and 1 means more vulnerable. Using equation 1, the paired attributes were run in r environment through the modified binomial logit multiple regressions (Equation 4). However, it would have been significant to use logit ordered regression since vulnerability has certain order.
Where,
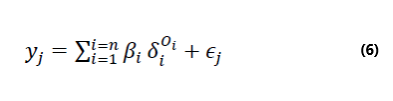
yj is a response variable (i.e., as selected from exposure, susceptibility and resilience)
βi is intercept (values generated by the equation after extraction in r-environment,
δi is predictor variable (selected from physical, social, economic, environmental and cultural),
Oi operator (i.e., measurement scale, less important and very important which considered by the model),
εj is an error.
This equation was applicable for all the UVFs, thus parameters in the UVFs were predicted separately based on the VCs to which they were associated. The link of UVFs and VCs is the regression model were computed in an implicit relationship showing the predictor and response variables (Table 4).
| VC | Predictor (y) | UVF | Response (δi) | Measurement (R Software) | Expected theoretical relationships |
|---|---|---|---|---|---|
| Susceptibility (S) | Communication accessibility (ca) | Social | • Human Rights (HR) • Health Services (HS) |
Equation 5 (R) | 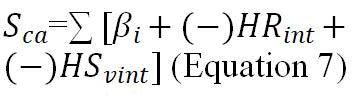 |
| Cultural | • Local Norms (LN) • Local Behaviour (LB) |
Equation 5 (R) | 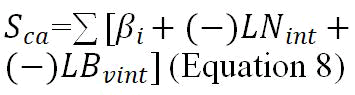 |
||
| Exposure (E) | Housing material type (hmt) | Physical | • Poor Construction (PC) • Lack of Construction Materials (CM) |
Equation 5 (R) | 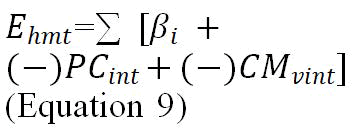 |
| Geography (ge) | Environmental | • Cultivated Land (CL) • Environmental Mismanagement (EM) • Poor Land Management (PLM) • In Appropriate Use of Resources (AUR) |
Equation 5 (R) | 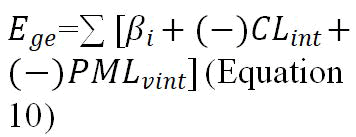 |
|
| Resilience (R) | Income of household head (ihh) | Economic | • Poverty (PV) • Alternatives Livelihood (AL) |
Equation 5 (R) | 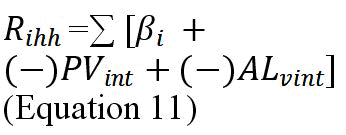 |
Table 4: Relationship matrix of VCs and UVFs using the binomial regression.
The binomial logit regression model was used based on three assumptions which implied that: The indicators for UVFs should be measured as a proportional value of household participants involved during the survey. The percentage values should be generated using a scale range with operators of “less important”; “important” and “very important” to contribute to flood vulnerability”. However, for flood vulnerability determination, a cut-off point should be placed at greater or equal to 50% for each indicator from the operator of the scale range of “important” and “very important”. In this case, all the values generated in the scale of “less important” as responded by the participants should be left out during determination and selection.
The linkage of UVFs and VCs should be based on statistical tests using P-values or correlation (r) or simply any statistical test applicable by the researcher. The values that are significant at certain confidence level (i.e. 0.05 in this study) should be selected to be included in the framework for specific combination like Physical Exposure Factors (PEFs), Socio-Susceptibility Factors (SSFs), Eco-Resilience Factors (ERFs), Enviro-Exposure Factors (EEFs) and Cultural-Susceptibility Factors (CSFs). Furthermore, those values significant at an appropriate confidence level should be considered as factors generating flood vulnerability in the studied areas.
Multicollinearity of the UVF and VC variables should be checked using Variance Inflation Factor (VIF) to assess the level of correlation in the regression model. It is assumed that a variable with VIF ≥ 10 has higher variance inflation in influencing other response variance and is redundant with other variables. As such, that variable should be dropped. In this study, the VIF process was done in STATA.
Flood Vulnerability Index (FVI) was used in the determination of household flood vulnerability based on the output of the analysis of the results. The results were compared to the Flood Vulnerability Index (FVI) probability scale of 0 to 1 (Table 5).
| Index value | Description | Designated colour |
|---|---|---|
| 0.32-0.40 | Very low vulnerability | Light green |
| 0.41-0.49 | Low vulnerability | Dark green |
| 0.50-0.59 | Moderate vulnerability | Yellow |
| 0.60 to 0.79 | High vulnerability | Orange |
| 0.8 to 1 | Very high vulnerability | Red |
Table 5: Interpretation of flood vulnerability index.
Results were presented in tables and spatial distribution maps. Spatial distribution maps were computed in ArcGIS 10.8 Desktop. Shapefiles for Malawi administrative boundaries were downloaded from MASDAP (Malawi Spatial Data Application Portal). Then Excel was used to generate the tabulated information and pie charts and later exported the output to ArcMap. The Maps were colored to show the contribution of each variable to households' flood vulnerability.
Margins and predictions post analysis: Margins and predictions are post-analyses that are run soon after a regression model. Margins were applied in this study as the way to predict the vulnerability of households in rural and urban informal settlements based on any other explanatory variables of the UVFs. The interaction between explanatory variables in the model makes interpretation difficult. However, after fitting the model one can obtain predictive margins for each of the levels in the interaction of explanatory variables. Margins also are used to test if there is a significant difference in the probability of an outcome within a particular categorical independent variable (VCs). The probabilities of vulnerability level for a household that was located in a particular village with the considerations of other explanatory factors such as physio-exposure, socio- susceptibility, and eco-resilience were predicted and outputs were presented in Tables. The probability of an outcome for a response variable can be calculated as below:
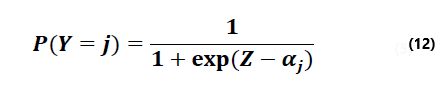
Where, Σni=1 QiXi, αj is the threshold of the jth level of a response variable. QiXi is as described in the ordered logistic model above. The Z part is calculated by the predict command in STATA. The command also can be used to predict the probabilities of a response variable under given conditions on response and explanatory variables.
Ethical issues
Ethical approval was sought from the Mzuzu University Research Ethics Committee (MZUNIREC). The MZUNIREC Permission was submitted to the Karonga District Council (KDC) and Lilongwe City Council (LCC). Participants were assured of confidentiality.
Variability of underlying vulnerability factors: The results of Multiple Correspondence Analysis (MCA) output have been outlined in Tables 6-10.
| Variable | Qual | Inert | Corr | Contr | ||||
|---|---|---|---|---|---|---|---|---|
| LC | KD | LC | KD | LC | KD | LC | KD | |
| INT/VINT | INT/VINT | INT/VINT | INT/VINT | |||||
| Poor construction standards for houses | 0.6579 | 0.3074 | 0.0935 | 0.0891 | 0.5352 | 0.5449 | 0.2014 | 0.3130 |
| 0.7199 | 0.5507 | 0.0457 | 0.0429 | 0.6992 | 0.6743 | 0.1286 | 0.0219 | |
| Lack of construction materials | 0.6172 | 0.3017 | 0.0872 | 0.0994 | 0.4398 | 0.0240 | 0.1544 | 0.0113 |
| 0.6167 | 0.7075 | 0.0533 | 0.0391 | 0.6071 | 0.1235 | 0.1301 | 0.0230 | |
| Aging of sewer systems | 0.7141 | 0.1846 | 0.0776 | 0.0936 | 0.1834 | 0.1072 | 0.3000 | 0.0572 |
| 0.0670 | 0.0437 | 0.1078 | 0.1212 | 0.0029 | 0.0007 | 0.0013 | 0.0004 | |
| Construction of roads and other infrastructures | 0.5689 | 0.3732 | 0.0906 | 0.0904 | 0.3371 | 0.1722 | 0.2341 | 0.1229 |
| 0.4425 | 0.0705 | 0.0470 | 0.1147 | 0.4153 | 0.0428 | 0.0785 | 0.0233 | |
| Note: INT: Important; VINT: Very Important; LC: Lilongwe City; KD: Karonga District | ||||||||
Table 6: Variability of underlying physical vulnerability variables.
The results in Table 6 show that except for the construction of roads (0.443) and ageing of sewer systems (0.067) in the scale of “INT” and “VINT”, all the physical indicator variables have larger quality values in LC. However, the results in KD show a greater quality value in the scale of “VINT” for indicator values of poor construction standards for houses (0.551) and lack of construction materials (0.708). Furthermore, the results for inert value of ageing of sewer systems deviate most from all the indicator variables in the scale of “VINT” for both LC (0.108) and KD (Table 7). The results also indicate higher correlation (corr.) for poor construction standards for houses in the scale value of “INT” and ‘VINT, accounting for higher amount of inertia. Ageing of sewer systems (0.300) and construction of roads and other infrastructures (0.234) account for high contribution to the inertia in LC while poor construction of housing standards account for higher inertia value (0.201) in LC and (0.313) in KD (Table 6).
| Variable | Qual | Inert | Corr | Contr | ||||
|---|---|---|---|---|---|---|---|---|
| LC | KD | LC | KD | LC | KD | LC | KD | |
| INT/VINT | INT/VINT | INT/VINT | INT/VINT | |||||
| Lack of capacity to cope | 0.4100 | 0.8208 | 0.0782 | 0.0812 | 0.3976 | 0.7904 | 0.1205 | 0.2613 |
| 0.2788 | 0.3516 | 0.0653 | 0.1237 | 0.1914 | 0.0323 | 0.0484 | 0.0163 | |
| Social security | 0.5055 | 0.7275 | 0.0743 | 0.0939 | 0.5044 | 0.5601 | 0.1453 | 0.2141 |
| 0.4976 | 0.5792 | 0.0773 | 0.1168 | 0.1637 | 0.1724 | 0.0491 | 0.0819 | |
| Human rights | 0.1454 | 0.6589 | 0.0769 | 0.0869 | 0.6484 | 0.0826 | 0.1932 | 0.0292 |
| 0.1364 | 0.5243 | 0.0726 | 0.0425 | 0.2865 | 0.1349 | 0.0806 | 0.0233 | |
| Heath services in availability | 0.5133 | 0.1515 | 0.0885 | 0.0926 | 0.506 | 0.0974 | 0.1735 | 0.0367 |
| 0.4691 | 0.1606 | 0.0494 | 0.0330 | 0.3037 | 0.1082 | 0.0581 | 0.0145 | |
| Note: INT: Important; VINT: Very Important; LC: Lilongwe City; KD: Karonga District | ||||||||
Table 7: Variability of underlying social vulnerability variables.
The results of MCA show significant contribution of vulnerability with a quality values in the category of social security the scale of INT (0.506) and VINT (0.500). The results further show significant contribution of vulnerability in the category of inavailability of health services (0.513) in the scale of INT in LC. In KD, the results show significant quality values on lack of capacity to cope (0.821) in the scale of INT, social security and human rights in the scale of INT and VINT (Table 8). While the results of the inert values in LC do not deviate much from the expected, in KD the inert value of lack of capacity to cope (0.124) in scale of INT and social security (0.117) in scale of VINT deviate from the expected value. The results also indicate higher correlation (corr.) social security (0.504) and human rights (0.648) and inavailability of health services (0.506) in LC while lack of capacity to cope (0.790) and social security (0.560) have higher Corr in KD accounting higher amount of inertia to contribute to vulnerability. The results further show all the indicator variables in the scale of “INT) contribute higher to the inertia in LC while only lack of capacity to cope (0.2613) and social security (0.2141) contribute higher to the same in KD.
| Variable | Qual | Inert | Corr | Contr | ||||
|---|---|---|---|---|---|---|---|---|
| LC | KD | LC | KD | LC | KD | LC | KD | |
| INT/VINT | INT/VINT | INT/VINT | INT/VINT | |||||
| No credit unions | 0.4148 | 0.6079 | 0.0820 | 0.0861 | 0.0452 | 0.1894 | 0.0155 | 0.0728 |
| 0.3988 | 0.5259 | 0.0698 | 0.1027 | 0.1141 | 0.3137 | 0.0333 | 0.1439 | |
| Lack of markets | 0.5743 | 0.5785 | 0.0832 | 0.0080 | 0.0013 | 0.0080 | 0.0005 | 0.0027 |
| 0.4429 | 0.6138 | 0.0710 | 0.4989 | 0.1870 | 0.4989 | 0.0556 | 0.2060 | |
| Poverty | 0.5125 | 0.2470 | 0.0982 | 0.1234 | 0.0131 | 0.1234 | 0.0054 | 0.0485 |
| 0.4966 | 0.3697 | 0.0351 | 0.2031 | 0.0874 | 0.2031 | 0.0129 | 0.0376 | |
| Lack of alternative livelihoods | 0.3736 | 0.0918 | 0.0789 | 0.0888 | 0.0188 | 0.0888 | 0.0062 | 0.0366 |
| 0.4475 | 0.0962 | 0.0603 | 0.0714 | 0.1333 | 0.0714 | 0.0337 | 0.0120 | |
| Note: INT: Important; VINT: Very Important; LC: Lilongwe City; KD: Karonga District | ||||||||
Table 8: Variability of underlying economic vulnerability variables.
The results in Table 8 show that lack of markets (0.574) and poverty (0.513) in the scale of “INT” have higher quality value in LC while lack of credit unions and lack of markets showed higher quality value in KD. These results suggest that lack of markets, poverty and lack of credit unions contribute more to household flood vulnerability than lack of alternative livelihoods. The results further show that all the indicator variables in LC have an inertia value at the expected rate of less than 10% while in KD lack of credit unions (0.103), lack of markets (0.499) poverty (0.123) and (0.203); display values that deviate from the expected. Similarly, the results show weak correlation (less than 1) for all the economic indicator variables in LC and only lack of markets (0.499) is close to 1 in KD thereby contribute highly to the inertia. Lack of credit unions and lack of markets account for high contribution to the inertia, thereby suggesting a high contribution to vulnerability (Table 9).
| Variable | Qual | Inert | Corr | Contr | ||||
|---|---|---|---|---|---|---|---|---|
| LC | KD | LC | KD | LC | KD | LC | KD | |
| INT/VINT | INT/VINT | INT/VINT | INT/VINT | |||||
| Cultivated land | 0.2605 | 0.0603 | 0.0635 | 0.0812 | 0.2419 | 0.0371 | 0.0711 | 0.0115 |
| 0.0422 | 0.0269 | 0.0693 | 0.0310 | 0.0017 | 0.0218 | 0.0005 | 0.0026 | |
| Extensive paving | 0.2251 | 0.4159 | 0.0652 | 0.6070 | 0.0928 | 0.6737 | 0.0280 | 0.1721 |
| 0.0334 | 0.0386 | 0.0614 | 0.0964 | 0.0330 | 0.0066 | 0.0094 | 0.0024 | |
| Environmental mismanagement | 0.5295 | 0.6330 | 0.0696 | 0.0645 | 0.5241 | 0.5568 | 0.1690 | 0.1369 |
| 0.6202 | 0.6778 | 0.0433 | 0.0391 | 0.4251 | 0.6770 | 0.0853 | 0.1009 | |
| Poor land management | 0.6320 | 0.3530 | 0.0693 | 0.0584 | 0.6307 | 0.2967 | 0.2024 | 0.0660 |
| 0.7460 | 0.4526 | 0.0433 | 0.0457 | 0.5186 | 0.4524 | 0.1041 | 0.0788 | |
| In appropriate use of resources | 0.5249 | 0.6992 | 0.0631 | 0.0716 | 0.5179 | 0.3195 | 0.1515 | 0.0872 |
| 0.6015 | 0.7064 | 0.0491 | 0.0360 | 0.4618 | 0.0360 | 0.1051 | 0.0942 | |
Table 9: Variability of underlying environmental vulnerability variables.
The results in Table 9 show that except for poor land management in KD for scales of INT and VINT, environmental mismanagement, poor land management and inappropriate use of resources have larger quality values in LC and KD. No indicator variable depicted the unexpected inertia value in LC and KD. In LC, the results further revealed that correlation is higher for environmental mismanagement (0.524) in the scale of INT, poor land management is also higher in both scales and in appropriate use of resources (0.518) in the scale of INT. However, extensive paving (0.674), environmental mismanagement (0.557) and poor land management (0.677) have higher correlation values close to one. Environmental mismanagement (0.169), poor land management (0.202; 0.104) and inappropriate use of resources (0.152; 0.105) account for high contribution to the inertia in LC while extensive paving The results in LC showed that lack of safety measures (0.551) and lack of personal responsibility (0.632) have high quality values above the cut-off of 50% while in KD traditional beliefs (0.508), settlements conditions (0.579), lack of safety measures (0.596) and lack of personal responsibility (0.636) have high quality values. No indicator variable depicted the unexpected inertia value in LC and KD. The results further revealed no strong correlation (close to 1) in LC to contribute to inertial variability. Nevertheless, in KD, the results showed strong correlation for traditional beliefs (0.506) and informal settlement (0.576). This suggests people living in Mtandire Ware are not aware that they live informally. It was noted that J Geogr Nat Disasters, Vol.14 Iss.2 No:1000305 15 (0.1721) and environmental mismanagement (0.137; 0.101) account for higher contributions in KD (Table 9).
| Variable | Qual | Inert | Corr | Contr | ||||
|---|---|---|---|---|---|---|---|---|
| LC | KD | LC | KD | LC | KD | LC | KD | |
| INT/VINT | INT/VINT | INT/VINT | INT/VINT | |||||
| Traditional beliefs and myths | 0.1604 | 0.5083 | 0.0549 | 0.0709 | 0.1576 | 0.5060 | 0.0470 | 0.1868 |
| 0.0738 | 0.0045 | 0.0534 | 0.0466 | 0.0410 | 0.0033 | 0.0119 | 0.0008 | |
| Cultural conflicts | 0.4318 | 0.1098 | 0.0560 | 0.0509 | 0.1617 | 0.0947 | 0.0493 | 0.0251 |
| 0.3171 | 0.3996 | 0.0673 | 0.0667 | 0.1032 | 0.0389 | 0.0378 | 0.0135 | |
| Informal settlement | 0.4043 | 0.5788 | 0.0558 | 0.0662 | 0.0111 | 0.5764 | 0.0034 | 0.1987 |
| 0.4103 | 0.1096 | 0.0388 | 0.0774 | 0.0988 | 0.0088 | 0.0209 | 0.0036 | |
| Language of communication | 0.3861 | 0.4390 | 0.0682 | 0.0679 | 0.0500 | 0.4316 | 0.0185 | 0.1526 |
| 0.3843 | 0.2064 | 0.0178 | 0.0748 | 0.0665 | 0.1835 | 0.0064 | 0.0714 | |
| Lack of safety precautions | 0.3341 | 0.0770 | 0.0489 | 0.0560 | 0.0423 | 0.0102 | 0.0113 | 0.0030 |
| 0.5506 | 0.5962 | 0.0555 | 0.0500 | 0.2085 | 0.0013 | 0.0629 | 0.0003 | |
| Lack of personal responsibility | 0.4791 | 0.1710 | 0.0504 | 0.0474 | 0.0034 | 0.1056 | 0.0009 | 0.0261 |
| 0.6316 | 0.6361 | 0.0474 | 0.0598 | 0.1699 | 0.0145 | 0.0438 | 0.0045 | |
| Note: INT: Important; VINT: Very Important; LC: Lilongwe City; KD: Karonga District | ||||||||
Table 10: Variability of underlying cultural vulnerability variables.
The results in LC showed that lack of safety measures (0.551) and lack of personal responsibility (0.632) have high quality values above the cut-off of 50% while in KD traditional beliefs (0.508), settlements conditions (0.579), lack of safety measures (0.596) and lack of personal responsibility (0.636) have high quality values. No indicator variable depicted the unexpected inertia value in LC and KD. The results further revealed no strong correlation (close to 1) in LC to contribute to inertial variability. Nevertheless, in KD, the results showed strong correlation for traditional beliefs (0.506) and informal settlement (0.576). This suggests people living in Mtandire Ware are not aware that they live informally. It was noted that Mtandire Ward is not properly defined as it is part of the Lilongwe City or Lilongwe District. While results show no higher value for contribution (Contr) in LC, traditional beliefs (0.187), settlement conditions (0.199) and language of communication (0.1526) account for high contribution to the inertia in KD (Table 10).
Artificial neural network: Multi-Layer Perceptron (MLP): The results of the ANN in Multi-Layer Perceptron (MLP) to show the relationship of the indicators used in the UVFs and those in the VCs as predicted by the combined P-value (Tables 12-16) are presented in Tables 11-15. Details of a full Artificial Neural Network (ANN) using Multi-Layer Perceptron (MLP).
| VC used | VCs indicator | UVF used | UVFs (indicators) | Study area | |
|---|---|---|---|---|---|
| LC | KD | ||||
| Exposure | House material | Physical | Poor Construction Standards (PCS) | -9.116 | 33.321 |
| Lack of construction materials (PCMs) | 1.217 | 6.928 | |||
| Construction of Roads and other infrastructures (CRF) | 13.027 | 3.777 | |||
| Ageing Infrastructures (AI) | 15.577 | 6.323 | |||
Table 11: Combined exposure and physical factors in ANN-MLP.
The results of exposure linked with physical factors reveal that therse is a strong relationship between house type with PCS in KD, while in LC the relationship is not very strong (-9.116) (Table 11). The relationships of house type with CRFs imply that these contribute to household flood vulnerability. Lack of construction materials (PCMs) has strong network value in KD compared to LC with a negative value (Table 12). The results reveal that houses made up of bamboo followed by those made up of mudstone are strongly associated with PCS in KD. The results further show that houses made up of unburnt bricks are strongly associated with ageing infrastructure in LC. Lack of construction materials has a strong relationship in KD than LC; CRF and AI have strong relationship with house material type in LC thereby contribute to high household flood vulnerability in LC.
| VC used | VCs indicator | UVF used | UVFs (indicators) | Study area | |
|---|---|---|---|---|---|
| LC | KD | ||||
| Susceptibility | Communication accessibility | Social | Lack of Capacity to cope (LOC) | -2.125 | 0.619 |
| Access to Health Services (AHS) | 16.033 | 0.2125 | |||
| Lack of Institutional Support (LIS) | 6.037 | 0.9509 | |||
Table 12: Combined susceptibility and social factors in ANN-MLP.
The results show positive and negative outcome of lack of capacity to cope Lack of Capacity to cope (LOC) in KD and LC respectively (Table 13). These results point to the fact that lack of capacity to cope contributes to household vulnerability in KD than LC. The results further show that LAL and LS have positive values both in LC and KD, but with greater contribution to household flood vulnerability in LC. Finally, the results reveal that AHS has positive and negative value in KD and LC. This result indicates that AHS contribute to household flood vulnerability in KD compared to LC.
| VC used | VCs indicator | UVF used | UVFs (indicators) | Study area | |
|---|---|---|---|---|---|
| LC | KD | ||||
| Resilience | Income of household head | Economic | No Credit Unions (NCU) | 3.297 | 0.619 |
| Lack of Alternative Livelihoods (LAL) | 3.839 | 0.403 | |||
| Poverty (PO) | 2.829 | 0.2125 | |||
| Lack of income Generating Activities (LGA) | 9.554 | 0.9509 | |||
Table 13: Combined resilience and economic factors in ANN-MLP.
The results of ANN revealed that all the UVFs for economic factors have positive values in LC and KD, but with higher values in LC. Lack of income generating activities was revealed to be higher both in LC and KD. These results imply that the NCU, LAL, PO and LGA contribute to household flood vulnerability in LC and KD (Table 14).
| VC used | VCs indicator | UVF used | UVFs (indicators) | Study area | |
|---|---|---|---|---|---|
| LC | KD | ||||
| Exposure | Topography | Environmental | Cultivated Land (CL) | 3.297 | 0.619 |
| Residing in Prone Areas (RPA) | 3.839 | 0.403 | |||
| Environmental Mismanagement (EMS) | 2.829 | 0.2125 | |||
| Poor Land Management (PLM) | 9.554 | 0.951 | |||
| Inappropriate Use of Resource (IUR) | 3.271 | 0.599 | |||
Table 14: Combined exposure and environmental factors in ANN-MLP.
The results of topography linked with environmental factors reveal that there is strong relationship between them, all greater than 0 in LC compared to KD (Table 15). The results show that Poor Land Management (PLM) has strong network value (9.554) in LC and (0.951) KD followed by RPA in LC (3.839). These results point to the fact that the CL, RPA, EMS, PLM and IUR contribute to households flood vulnerability in LC and KD, with higher contribution in LC.
| VC used | VCs indicator | UVF used | UVFs (indicators) | Study area | |
|---|---|---|---|---|---|
| LC | KD | ||||
| Susceptibility | Communication accessibility | Cultural | Traditional Beliefs (TB) | 7.872 | 79.789 |
| Cultural Conflicts (CC) | 6.426 | 11.864 | |||
| Lack of Adherence to Safety Measures (LASM) | 7.782 | -25.912 | |||
| Absence of Ownership of Resources (AOR) | 5.706 | 0.122 | |||
Table 15: Combined susceptibility and cultural factors in ANN-MLP.
The results of communication linked with cultural factors reveal that there is strong relationship between them, all greater than 0 in LC compared to KD. The results show that Traditional Beliefs (TB) have strong network value (79.789) in KD and (7.872) LC followed by 11.864 in KD and 6.426 in LC.
Derived equations based on the binomial logit multiple regression: The binomial Logit Multiple Regression was computed in r to generate five scores outlined in 2.3.11 to 2.3.15.
Computation of socio-susceptibility score: The underlying social vulnerability factors (SVFs) linked with communication accessibility (ca) in the susceptibility indicators generated the output of socio-susceptibility score (equation 11).
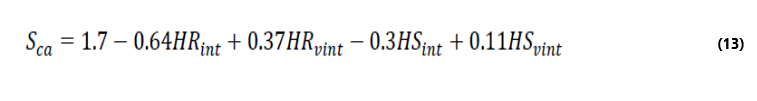
Where,
S=Susceptibility,
ca=Communication accessibility,
HR=Human rights,
HS=Health services
sint=Scale of less important,
svint=Scale of very important.
The above output (equation 13) linked the susceptibility indicators (communication accessibility) with social variables. Therefore, to compute the scores in Lilongwe city (Mtandire Ward) and Karonga district (T/A Kilupula), the percentage values generated using descriptive statistics from the scale of “important” and “very important” were separately inputted in the equation (equation 13).
Computation of physio-exposure score: The underlying physical vulnerability factors (PVFs) linked with housing material types (hmt) in the exposure indicators generated the output of physio-exposure score (equation 14).
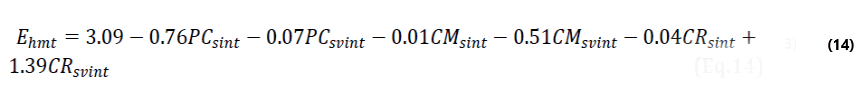
Where,
E=Exposure,
hmt=Housing material type,
PC=Poor construction,
CM=Construction materials,
CR=Construction of roads,
sint=Scale of less important,
svint=Scale of very important.
The output (equation 14) linked the exposure indicators (housing material type) with physical variables [16]. Therefore, to compute the scores in Lilongwe city (Mtandire Ward) and Karonga district (T/A Kilupula), the percentage values generated using descriptive statistics from the scale of “important” and “very important” were separately inputted in the equation (equation 14).
Computation of eco-resilience score: The underlying economic vulnerability factors (EVFs) linked with income of household head (ihh) in the resilience indicators generated the output of eco-resilience score (equation 15).
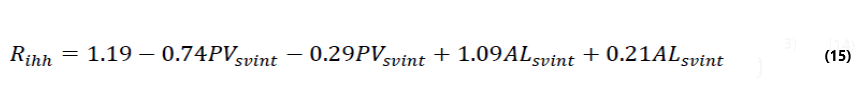
Where,
R=Resilience,
ihh=income of household head,
PV=Poverty,
AL=Alternative livelihoods,
sint=scale of less important,
svint=scale of very important.
The output (equation 15) linked the resilience indicators (income of household head) with economic variables. Therefore, to compute the scores in Lilongwe city (Mtandire Ward) and Karonga district (T/A Kilupula), the percentage values generated using descriptive statistics from the scale of “important” and “very important” were separately inputted in the equation (equation 15).
Computation of enviro-exposure score: The underlying Environmental Vulnerability Factors (EVFs) linked with geography (ge) in the exposure indicators generated the output of enviro-exposure score (equation 16).
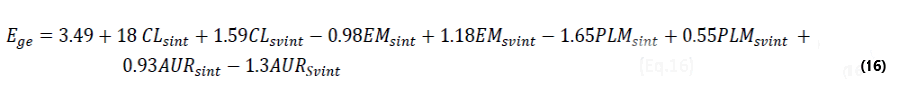
Where,
E=Exposure,
Ge=Geography,
CL=Cultivated land,
EM=Environmental mismanagement,
PLM=Poor land management,
AUR=Inappropriate use of resources,
sint=scale of less important,
svint=scale of very important.
The output (equation 16) linked the exposure indicators (geography) with environmental variables. Therefore, to compute the scores in Lilongwe city (Mtandire Ward) and Karonga district (T/A Kilupula), the percentage values generated using descriptive statistics from the scale of “important” and “very important” were separately inputted in the equation (equation 15).
Computation of cultural-susceptibility score: The underlying Cultural Vulnerability Factors (CVFs) linked with inaccessibility of communication (ic) in the susceptibility indicators generated the output of cultural-susceptibility score (equation 16).
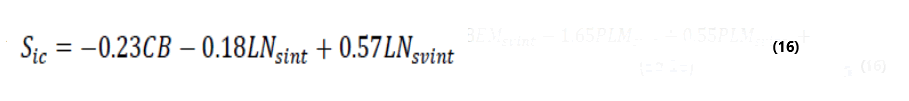
Where,
S=Susceptibility,
cb=cultural behaviour,
LN=local norms,
sint=scale of less important,
svint=scale of very important.
The output (equation 16) linked the susceptibility indicators (cultural behaviour) with cultural variables. Therefore, to compute the scores in Lilongwe city (Mtandire Ward) and Karonga district (T/A Kilupula), the percentage values generated using descriptive statistics from the scale of “important” and “very important” were separately inputted in the equation (equation 16).
The score measure of UVF (physical, social, economic, environmental and cultural) against VCs (exposure, susceptibility and resilience) generated a single value according to the association which was as follows: Physical with Exposure Factors (PEFs), Social with Susceptibility Factors (SSFs), Economic with Resilience Factors (ERFs), Environmental with Exposure Factors (EEFs) and Cultural with Susceptibility Factors (CSFs). This association further generated value that was divided by the total sample size 345 and 200 household participants in Lilongwe city and Karonga district and multiplied by the 100 percent to obtain a percentage value of each category in the calibrated formula, for example:

Then the percentage result obtained in equation (equation 1) for each factor was further divided by 100% to generate the vulnerability level (extent of vulnerability) of each factor (i.e., VLPEFs). This computed arbitrary value was compared to the FVI to predict the extent of vulnerability per factor, for example:
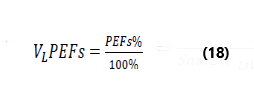
Where VLPEFs means extent (level) of vulnerability on Physio-Exposure factors. This formula was applied to all the combined categories (i.e., SSFs, ERFs, EEFs and CSFs) by substituting the category that was required to be worked out in the equation to obtain the value that was used to determine vulnerability [18]. Finally, the result was used to predict vulnerability in terms of “high vulnerability” and “very high vulnerability” per FVI scales range. Ordinal categories for the indicators of vulnerability determinants (less important, important and very important) and indicators of elements at risk (not vulnerable, small vulnerable, vulnerable, highly vulnerable and very highly vulnerable) were used for selection of variables.
Finally, the relationship (using equation 1) generated results in the category of the Physio-Exposure Factors (PEFs), Social Susceptibility Factors (SSFs), Eco-resilience Factors (ERFs), Enviro-Exposure Factors (EEFs) and Cultural-Susceptibility Factors (CSFs) (Figure 5).

Figure 5: Vulnerability levels.
The results of PEFs falls in scale range of “vulnerability” in Lilongwe city (0.52) compared to “high vulnerability” in Karonga district (0.64). The SFFs generated a vulnerability value (0.61) of people living in TA Kilupula in Karonga district compared to a low vulnerability value (0.2) of people living in Mtandire Ward in Lilongwe city. The ERFs contribute to “very high vulnerability” in Karonga (0.8) and “high vulnerability” in Lilongwe (0.6). The EEFs revealed “very high vulnerability” in both LC (0.8) and KD (0.9). Finally, the CSFs revealed a low vulnerability in both LC (0.34) and KD (0.39) (Figure 5). In the FVI scale, the SSFs and CSFs contribute to low vulnerability in LC while only the CSFs contribute to low vulnerability in KD.
Though variations exist in the causes of vulnerability, the results of this study have demonstrated that the vulnerability of households to floods in rural and urban informal settlements is very high based on a lack of building materials, proximity to catchments, and limited communication among other factors. Similar, to this finding Alam et al., also found a high vulnerability value of 0.7015 for rural people living in the Dammar Char in Southeastern Bangladesh compared to urban areas. While, Alarm et al., did not specify the causes of such high vulnerability, this study attributes the high vulnerability to the aspect of lack of construction materials, distance to markets and transport cost that people have to incur to access construction materials in rural areas. These causes agree with the findings of Qasim et al., in which vulnerability to flooding was attributed to poor/lack of materials used to construct houses. The results also revealed that poor construction of infrastructural facilities falls in the scale of “high flood vulnerability in both LC and KD. This implies that substandard construction of infrastructure such as houses contributes to vulnerability. This finding is supported by literature that substandard infrastructures contribute to flood vulnerability. Furthermore, the ANN results in MLP revealed a strong association of physical vulnerability factors (lack of construction materials, construction of infrastructures, and ageing infrastructures) with housing type. This implies that they contribute to generating vulnerability because people live in substandard houses. This finding confirms the result finding of Movahad et al., and Aliyu Baba Nabegu, who indicated that people are vulnerable to floods because they usually live in substandard housing conditions which become prone to floods.
The SFFs generated a vulnerability value (0.61) for people living in T/A Kilupula in Karonga District compared to a low vulnerability value (0.2) for people living in Mtandire Ward in Lilongwe City. The above findings indicate that key factors for households’ flood vulnerability are associated with knowledge of building codes and standards. This means that the culture of shelter safety is lacking and that there is a lack of knowledge of the type of houses that they can build to resist floods and any other type of natural hazards. These could be attributed to dynamic pressures influencing households’ vulnerability to floods. That’s to say, people do have enough resources, decision-making, and societal skills to access housing materials that can help them build strong houses. In this situation, the programming of flood risk management and in general DRM mitigation, preparedness and recovery measures should focus on reducing the pressures by strengthening households’ knowledge and building standards. This can be achieved through designing mitigation measures that address the root causes that contribute to increased vulnerabilities in the pre-flood and post-flood phases rather than focusing too much on the trans-flooding phase. In terms of social-susceptibility vulnerability, the results found that the SSFs that contribute to generating vulnerability both in T/A Kilupula of KD and Mtandire Ward of LC are lack of access to health services, human rights, limited institutional capacities and lack of awareness. However, the binomial logistical regression of the SFFs generated a vulnerability value (0.61) for people living in the studied area of KD compared to a low vulnerability value (0.2) of people living in the studied area of LC. This finding differs from the findings of Munyai et al., in Muungamunwe Village in South Africa, which found that the value of FVI social was 0.80 higher than all the factors assessed. However, it is noted that the later study did not comprehensively link various factors between UVFs and VCs to determine the degree of contribution to vulnerability. The results further imply that the socio-susceptibility factors contribute to higher vulnerability in rural areas than in urban areas. This finding is supported by the study of Mwale in which social susceptibility was categorised from “high to very high vulnerability” among the communities in rural Lowershire of Chikwawa and Nsanje Districts of Malawi.
The ERFs contribute to “very high vulnerability” in Karonga (0.8) and “high vulnerability” in Mtandire Ward of Lilongwe City (0.6). The high vulnerability is linked to factors such as poverty, lack of alternative livelihoods, and lack of income-generating activities. Similar to these results, the study of Mwale (2014) also established a predominantly very high economic susceptibility based on causes such as a lack of economic resources, an undiversified economy and a lack of employment opportunities among communities in the lower Shire Valley of Malawi. Despite the results revealing the same outcome, the earlier study linked economics with susceptibility measures while this study agglomerated economics with resilience measures. The existing variation placed some causes in different association order. For example, poverty in the study of Mwale was categorised as a social susceptibility indicator, while in this study it was used as the eco-resilience measure. The understanding of this study is that poverty is a measure of the income level of a household. That is to say, a household with enough income will be less poor thereby becoming more resilient and vice versa. Therefore, poverty was classified as a cause of “high vulnerability” both in Mtandire Ward of LC with a value of 0.73 and T/A Kilupula of KD with a value of 0.68. On the other hand, the lack of alternative livelihoods contributes to “vulnerability” in Mtandire Ward with a value of 0.54 while ‘high vulnerability” in T/A Kilupula with a value of 0.71). These findings point out the notion that programming current and future flood disaster mitigation plans and vulnerability reduction measures requires the formulation of relevant financial and economic measures which may contribute to poverty alleviation in the community and society.
The EEFs revealed “very high vulnerability” in both Mtandire Ward of LC (0.8) and T/A Kilupula of KD (0.9). The EEFs revealed “very high vulnerability” of EEFs (0.8) in Mtandire Ward and (0.9) in T/A Kilupula. Except for the pressure on cultivated land in Mtandire Ward, all Underlying Environmental Vulnerability Factors (UEVFs) contribute to vulnerability in both rural and urban areas. This result points out that pressure on land is an environmental indicator that predicts households’ vulnerability to floods in rural areas (T/A Kilupula) and not in urban areas (Mtandire Ward). The high vulnerability depicted by the EEFs is a total indication that households are more vulnerable due to the built environment. This could be attributed to the fact that people have allowed development in areas where danger exists due to the lack of policy and legal systems to help and guide government and enterprises in disaster risk management. This argument is supported by literature that development in dangerous areas increases peoples’ exposure to. Barbier et al., support that environmental damage affects the well-being of the local people since it leads to soil degradation which eventually causes low food production. To this end, laws and policies to regulate development and habitation in risk areas should be seamlessly programmed into the current and future flood mitigation and preparedness plans at all levels.
Finally, the CSFs revealed a low vulnerability in both Mtandire Ward of LC (0.34) and T/A Kilupula of KD (0.39) (Figure 6). In the FVI scale, the SSFs and CSFs contribute to low vulnerability in Mtandire Ward of LC while only the CSFs contribute to low vulnerability in T/A Kilupula of KD (Figure 3). The CSFs show a value of 0.34 in Mtandire Ward and 0.39 in T/A Kilupula, indicating that it contributes to low vulnerability in both areas. However, it was established that household flood vulnerability in T/A Kilupula is high due to other factors such as cultural beliefs of conserving their ancestors’ graveyards and land ownership issues. In support of this result, Iloka (2017) found that a system of beliefs regarding hazards and disasters contributes to vulnerability. The findings of the author further established that cultural issues do not assist households to be resilient to floods. In Mtandire Ward of LC, it was observed that land use and human occupancy in risk areas contribute to household flood vulnerability. Furthermore, it was reported that rich people have occupied places which are not habitable thereby changing the course of the Lingadzi River. Further to this, youths have resorted to destroying the banks of the river due to a lack of economic activities and high unemployment. It was noted that people do not fear or abide by city regulations because there is no punishment that they receive from city councils.
Implications of the study
Based on the results, and in order to provide proper flood mitigation and programming of current and future challenges in flood management in Malawi, the FVA framework has been proposed. The FVA framework follows a cyclic set theory approach. A set is a collection of different objects. The collection of objects can take the form of; empty set (no objects), union set (collection of all objects that are in either set), intersection set (collection of objects that are in both sets) and universal set (set of all possible objects). Sets can be shown in a Venn diagram-which depicts the relationship between sets. Each set is shown as a circle and circles overlap if the sets intersect. The intersection point, relates to elements that are common. Therefore, this study applied the intersection set using Veen diagrams. FVA indicators which contribute to vulnerability in both urban and rural areas were placed at the intersection and vice versa. The framework utilised all the indicators that were revealed as significant at p-value 0.05 between UVFs and VCs and those that generated higher inertia in a Minitab-MCA.
Assumptions of the FVA framework
Assumptions are key to the realization of the results and critical for achieving the successful implementation of an intervention. In this regard, the fact that FVA framework provides the indicators which can be used to assess flood vulnerability in urban and rural areas in Malawi and at any region of the world, the following twelve assumptions are vital for consideration in order to achieve the results:
• The UFV should be constituted by physical, social, economic, environmental and cultural factors while the VC composed of exposure, susceptibility and resilience in order to determine flood vulnerability. Selection of variables for these key components should consider vulnerability a combination of physical and social sciences.
• The UVFs and VCs should be linked to generate Physio-Exposure Factors (PEF), Socio-Susceptibility Factors (SSF), Eco-Resilience Factor (ERF), Enviro-Exposure Factors (EEF) and Cultural-Susceptibility Factors (CSF) in order to determine flood vulnerability or any particular hazard.
• The generated indicators in the PEF, SSF, ERF, EEF and CSF should lead to the production of Physio-Exposure Indicators (PEIs), Social Susceptibility Indicators (SSIs), Eco-Resilience Indicators (ERIs), Enviro-Exposure Indicators (EEIs) and Cultural-Susceptibility Indicators (CSIs), which in turn should capture indicators for FVA framework (Figure 3).
• The breakdown on the elements at risk poses a serious households flood vulnerability. Therefore, assessing the elements at risks based on the scale of 1-4: 1=severely vulnerable, 2=vulnerable, 3=slightly vulnerable and 4=not vulnerable would help to determine the extent of vulnerability.
• A comprehensive flood vulnerability assessment framework that can give rise to multi-hazard vulnerability assessment should deviate from the common systematization of vulnerability of using one set of variables. A combination of UVFs and VCs should be used to generate wide range of issues and variables.
• The linkage between the factors that amplify vulnerability and those that can enhance vulnerability reduction should be demonstrated through adaptive capacity and disaster risk reduction measures and be incorporated in the framework. Those that cannot be quantified should be supported by qualitative methods.
• The linkage of the UVFs and VCs as key explanation of the generation of vulnerability should be emphasised and that conceptual framework for FVA should provide clear connectivity of the variables of the UVFs and VCs.
• The variables for UVFs (physical, social, economic, environmental and cultural) should be measured as absolute proportion value of household participants involved during the survey. The percentage values should be generated using a scale range with operator of “less important”; “important” and “very important” to contribute to flood vulnerability”. However, for flood vulnerability determination, a cut-off point should be placed at greater or equal to 0.5 (50%) for each indicator from the operator of the scale range of “important” and “very important”. In this case, all the values generated in the scale of “less important” as responded by the participants should be left out during determination of flood vulnerability.
• The selected variables UVFs indicators (at 50%) should be tested using the variables of VCs (exposure, susceptibility and resilience) in the order stipulated in 2 and 3 through statistical tests using P-values or correlation (r) or simply any statistical test applicable by the researcher. The values that are significant at certain confidence level (. 0.05 in this study) should be selected to be included in the framework for specific combination like PEFs, SSFs, ERFs, EEFs and CSFs (Figure 3). Furthermore, those values significant at an appropriate confidence level should be considered as factors generating flood vulnerability.
• Households vulnerability to floods should be predicted based on logistical regression test between the UVFs for all the operators of less important, important and very important and the VCs indicators (in exposure, susceptibility and resilience). The selection of the VCs indicators should be based on those that were significant during statistical test as explained in assumption 2.9.
• Demographic characteristics should be statistically tested to determine their significant level of at P-value 0.05 with the Underlying Vulnerability Factors (UVFs) in order to provide explanation of who is vulnerable to what. However, because other explanation might be hidden in a quantitative assessment, a qualitative-in-depth assessment must be done to understand those hidden issues per se. In so doing, the assessment would be informative in identifying the factors that give rise to the pressures that generate vulnerable conditions in the society for different groups.
• Adaptive capacity should be assessed both quantitatively and qualitatively since it is a component of vulnerability reduction. This entails that if adaptive capacity is sufficient, it is likely that households response to floods would be high and vulnerability is also likely to reduce and vice versa.
Finally, vulnerability equation would be generated as a sum of UVFs, VCs, hazard (flood) and (-) adaptive capacity. Mathematically the equation is coined as FV=((UVFs+VCs)+H)-AC, where FV is (Flood Vulnerability), UVFs (Underlying Vulnerability Factors), VC (Vulnerability Components), H (Hazard in this case floods) and AC (Adaptive Capacity). The flexibility of the framework is that it gives room for H (Hazard) and F (Flood) to change based on the type of hazard the assessor is interested in. Hence, this framework can be utilised in a multi hazard assessment. The equation is interpreted as follows: A positive value denotes vulnerable to floods while a negative value denotes not vulnerable to floods.
The FVA framework: The FVA framework should be implemented as a pre-hazard, trans hazard and post hazard (flood) assessment tool. In the pre-hazard category, all the proposed indicators should be used to determine vulnerable conditions which may (or may not) make some households at risk to flood disaster in an event of a flood occurrence. In the trans-hazard, the FVA indicators should be used to determine vulnerabilities of households in order to identify the households that have been affected by floods as part disaster response and recovery process. In so doing, the FVA indicators should be used as a means of establishing strategies for disaster response and recovery as part of building back better. As a post-hazard tool, indicators should be used to determine the vulnerabilities that contributed to a disaster situation. Users should prioritize these indicators as a means of building DRR for disaster rehabilitation and reconstruction. In this case, the FVA framework contrasts itself to available tools such as Unified Beneficiary Register (UBR) and Hazard Rapid Assessment (HRA) which largely are implemented only after the hazard in Malawi. Furthermore, it clearly separates indicators that generate vulnerability in sub-sectors, but most available frameworks do not portray this separation. Therefore, participating enterprises can implement FVA framework based on the need of the assessment. The FVA framework can be implemented through hydrological assessment, flood modelling, quantitative, qualitative, GIS and remote sensing methodologies, giving opportunity to multiple users. The framework puts emphasis on UVFs (physical, social, economic, environmental and cultural) and VCs (exposure, susceptibility and resilience) as intersection construct of flood vulnerability in urban and rural areas of Malawi and other places where it can be applied. It provides very simplified indicators of assessing flood vulnerability at local and national level, deviating from the generalised frameworks that look at wider scale like the PAR model. More importantly, the framework provides tailor-made indicators thereby by localizing the assessment of flood vulnerability in Malawi. This framework gives indicators that can be easily measured and evaluated at any level using different tools (statistical applications) thereby giving empirical scientific data on floods. The framework is coined strategically for researchers to utilise it in measuring vulnerability of a single underlying factor of interest (i.e., physical vulnerability or social vulnerability etc.). It also gives simplified indicators that can be utilised by policy and decision makers for planning interventions. The framework provides a good alignment of adaptive capacity to underlying vulnerability factors and components. In this case, the framework integrates DRR into vulnerability reduction strategies. Unlike the PAR model which does not explain exactly the measures of vulnerability reduction, this framework, through integration of adaptive capacity, it has filled up this gap. Finally, the framework intersect the significant factors of vulnerability in a set theory analysis giving a new thinking in outlining FVA indicators in Malawi and beyond. The framework goes beyond the Community Based Disaster Risk Index (CBDRI) by Bollin which does clearly provide proper link of indicators between vulnerability factors and components. For example, the CBDRI considers vulnerability components as structure, population, and economy, environmental and capacity measures yet alone these could be grouped as conditions that generate flood vulnerability as tested in the FVA framework.

Figure 6: 1 FVA framework.
Physio-Exposure Indicators (PEIs): The PEIs have been generated from the PEFs. Therefore, in the FVA framework, the PEI relates the physical causes to housing and infrastructures. In this case, the PEIs must be evaluated based on exposure to its operator house material and type to understand how they contribute to vulnerability. This is supported by literature that exposure entails the probability of flooding to affect physical objects-buildings and people due to location. Since location is an exposure variable, defined by the geographical position to which the assessment was done, this study relates location/geography to predict household vulnerability and thereby all significant indicators were grouped as Physio-Exposure Factors (PEFs) to give rise to the PEIs. In Figure 6, those that intersect the Venn diagram (Housing Typology (HT), Poor Construction of Standards (PCS), Lack of Building Materials (LBM) and Loss of Physical Assets (LPA) and infrastructural standards) are the PEIs for both urban and rural areas. While location (LC) and Growth of Informal Settlement (GIS) are PEIs for rural and urban areas respectively.
Socio-Susceptibility Indicators (SSIs): This framework further relates that the social causes must be linked to susceptibility with operator access to communication. Susceptibility deals with elements that influence an individual or household to respond to the hazard itself. Birkmann et al., and Kablan et al., stated that susceptibility relates to the predisposition of the elements at risk in social and ecological spheres. Hence, most of the susceptibility factors relate to social and cultural causes because they are all an integral part of humanity's suffering if conditions do not support them to withstand and resist the natural hazard impacts. So, access to communication is a susceptibility condition which may result in making households vulnerable to floods because they cannot anticipate the impending flooding. Hence this study related social causes with access to communication to develop a combination of Socio-Susceptibility Factors (SSFs). In Figure 6, the SSIs, Lack of Access to Health Services (LHS), Communication Accessibility (CA), Access to Training and Advocacy (ATA) and Level of Sanitation (LS) indicators that intersect the Venn diagram, implying they are applicable both rural and urban informal areas. However, Lack of Human Rights (LHR) and Level of Waste Management and Drainage Systems (LWDS) are SSIs in rural and urban respectively.
Eco-Resilience Indicators (ERIs): The framework also put much emphasis on economic causes of vulnerability. Economic indicators such as limited access to alternative livelihoods and poverty contribute to generate vulnerability. These indicators may or may not be affected by the resilience of households to the shock. Qasim stated that certain beliefs and poverty play a role in the lack of resilience among communities. Birkmann stipulated that resilience comprise pre-event risk reduction, in time-coping, and post-event response actions. As such, resilience is measured based on the ability of the households to cope with the event. As such, key factors to measure resilience include access to resources, improved livelihoods and access to income among others. The framework therefore strongly overlaps economic causes with resilience factors to assess vulnerability of households to floods. In the Figure 6, the combination is referred as ERFs. In Figure 6, Poverty (PO), limited livelihoods (LVs), Lack of Income of Household Head (LIHH), Loss of Economic Assets (LEA) intersect the Venn diagram, implying that they are Eco-Resilience Indicators (ERIs) for both rural and urban areas. The ERIs for only rural Lack of Markets (LM), Limited Credit Unions (LCU) and Reduction in Agricultural Land (RAL) while in urban informal settlements they include Lack of Employments Opportunities (LEO).
Enviro-Exposure Indicators (EEIs): The FVA framework relates the environmental causes to land use planning and management as such they were predicted based on exposure variables, specifically location. This is supported in literature that exposure is the extent to which an area that is subject to an assessment fall within the geographical range of a hazard event due to location. Therefore, since location is an exposure variable, defined by geographical position to which assessment was done, then this study related the environmental causes to those location/geography to predict household vulnerability and thereby all the indicators that were significant were grouped as Enviro-Exposure Factors (EEFs) and referred as the EEIs in Figure 6.
In the same Figure 6, Environmental Mismanagement (EM), Proximity to Rivers (PR), Poor Land Management (PLM), Inappropriate Use of Resources (IUR) and Siltation of Rivers (SR), River Catchment Morphology (RCM) Flooding Risk Location (FRL) intersect in the Venn diagram, implying that they are the EEIs for both rural and urban informal areas. Those outside the intersection apply specifically as EEIs conforming either in Lilongwe include Waste Management (WM), Land Use Planning (LUP) or in Karonga (Cultivated Land: CL and topography TP).
Cultural-Susceptibility Indicators (CSIs): This framework suggests that the cultural causes must be linked to susceptibility with operator access to communication. Susceptibility deals with elements that influence an individual or household to respond to the hazard itself. Birkmann and Kablan stated that susceptibility relates to the predisposition of the elements at risk in social and ecological spheres. Hence, most of the susceptibility factors relating to cultural causes are all integral parts of humanity suffering if conditions do not support them to withstand and resist the natural hazard impacts. So, access to communication is a susceptibility condition which may result in making households vulnerability to floods because they cannot anticipate the room danger for immediate response. In Figure 5, lack of personal responsibility, lack of adherence to regulations, lack of institutional support and flood perception intersect the Venn diagram, implying that they are the CSIs for both urban and rural areas. However, cultural beliefs and myths about floods should be indicators to be evaluated specifically in rural areas, while power conflicts, limited DRR strategies and lack of cooperation should be used to assess vulnerability in urban areas, though they can be applicable to rural areas too.
Adaptive capacity: The framework further provides key adaptive measures that can be incorporated to deal with vulnerability conditions generated from each intersected category. The adaptive measures relating to housing strategies can be utilised to minimised floods impact on households under the physio-exposure factors in the category of the PEIs are Strengthening Availability of Building Materials (SULBM), Enforcement of Building Codes and Standards (EBCS) and Empower Locals on Flood Resilient Structures (ELFRS). Similarly, the social organisational measures can be utilised to minimise socio-susceptibility factors relating to the SSIs. The adaptive capacity that can contribute to reduce vulnerability in the category are: Ability to Make Decisions (AMD), Ability to Organise and Coordination (AOC) and Communal Strategic Grains for Resilient Buildings (CSGRB). In addition, the economic measures can be utilised to minimise floods impacts relating to eco-resilience factors for the category of ERIs and they include Saving Agricultural Produce (SAP), Strengthen Diversification (SD) Strengthen Livelihoods Opportunities (SLO) can be used as adaptive capacity under this category. In terms of enviro-exposure, households to adapt to floods impact can use land management measures. These practices include: Elevating House Location (EHL), Afforestation and Re-afforestation (AR) and Building Dykes and Embankments (BDE) can be used as adaptive capacity under this category. Finally, households can minimise the cultural-susceptibility factors that generate their vulnerability through the application of warning systems for impending flooding (WS) and use of Indigenous and Scientific Knowledge (ISK) This is contrary to the PAR model and Urban Flood Vulnerability Assessment, which did not elaborate the adaptive strategies. However, the FVA relates well with the ISDR framework on adaptive capacity because the ISDR puts emphasis on the disaster risk reduction through adaptive responses such as awareness knowledge, development public commitment, application of risk reduction measures, early warning and preparedness.
FVA benchmarking and comparability to the other frameworks: This study benchmarked the FVA with various contemporary disaster management frameworks. The aim was to test for its comparability and the reliability of indicators. The test was also done to check the variations of the FVA and the contemporary frameworks. This study argues that the ability to identify variations between the earlier and the later imply that a new face in the later phenomenon has been added. Therefore, key contemporary frameworks and models which were used in order to achieve this goal include; PAR Model, Hazard of Place Framework, Sustainable Livelihood Model, community based Disaster Risk Management Model framework and the International Disaster Risk Reduction Framework. The FVA was further benchmarked with studies carried out in Malawi on flood vulnerability assessment to check the relevance of the indicators that have been generated in the intersection parameters of the associated UVFs and VCs.
Therefore, based on the indicators intersected in Figure 6 (such as housing conditions, access to information, access to resources, poor land use, social networks, location), the FVA framework correlates well with most of the indicators stipulated in Hazard of place model, PAR model, Urban Flood Vulnerability Assessment Framework, ISDR framework. However, the FVA framework has provided simplified indicators of flood vulnerability assessment because the indicators are simple to be used by experts and non-experts whether they are in urban or rural areas. They can be easily understood by ordinary users and policy makers. Furthermore, the indicators can be used for multi-hazards vulnerability assessment, since the H and F in the constituted equation can be changed based on hazard. In this case, the FVA Framework is widening vulnerability assessment beyond a focus on floods. The FVA, therefore, eliminates the gaps that most studies in literature mainly focus on, single hazards, ignoring the multi-hazard assessment. The FVA includes variables that can be measurable through quantitative and ANN (machine learning platform) thereby expanding the process of vulnerability analysis.
The FVA separated the indicators that generate vulnerability in different subsector of UVFs and VCs. This separation deviates from most of the contemporary frameworks. Joakim noted that most contemporary frameworks fail to portray the linkages and networks that exist with the layers or sections leading to the vulnerability. For example, the PAR model provides a generalised causation of vulnerability. It portrays the progression of vulnerability from root causes to unsafe condition, but it fails to explicitly acknowledge the linkages that exist within each progression. The FVA has provided straightforward linkage of indicators by systematizing and assessing vulnerability in different subsectors. Similarly, International Strategy for Disaster Reduction (ISDR) framework, Hazard of Place Framework (HOP), Borgardi, Birkmann and Cadona (BCC) and the Turner et al. II framework, all have methodological difficulty of translation of some concepts into practice. This methodological variation, further makes the contemporary frameworks to be difficult to incorporate different links that exist between vulnerability factors. Mwale argues that HOP framework does not provide a causal explanation of the vulnerability, instead variables are selected the way they are. Joakim further noted that the applicability of HOP framework is a Canadian context, giving an impression that some indicators might manifest themselves differently in small political, economic and social processes. Though, HOP framework in some instances, relates very well with FVA, particularly the inclusion of perceptions, emphasis on understanding the underlying vulnerability factors, inclusion of mitigation and adaptive capacity in the analysis of vulnerability. It is also highlighted that the Turner et al. II framework is too theoretical and lacks specificity. This means that the framework is not simple and easy to use. The ISDR does not link preparedness response system and thereby not explicit on how vulnerability can be reduced. Also, the use of one dimensional indicators is demonstrated in the Turner II framework which define vulnerability in terms of exposure, susceptibility and responses. For this part, the ISDR defines vulnerability in the realms of social, economic, environmental and physical, missing the aspects of exposure, susceptibility and resilience. Above all, most of these frameworks have neglected to agglomerate the UVFs and VCs in their analysis and development of vulnerability frameworks. These FVA has attempted to fill these gaps, fiving vulnerability assessment a new direction. In Malawi and SSA in general, Mwale et al. in a study of contemporary disaster management framework quantification of flood risk in rural lower shire valley, Malawi found medium, high and very high flood vulnerability in the same construct of indicators of the FVA framework. This implies that the FVA indicators are locally comparable and that can be used for decision making process. The FVA indicators are more practical and can ably enhance community and household resilience. These indicators can thus be applied in promoting resilience of communities to mitigate flood risks and key component for planning and decision making process.
This study carried out Flood Vulnerability Assessment (FVA) using quantitative methods by utilising MCA, ANN (machine learning) and multiple logistical regression. The high flood vulnerability and lack of adaptive capacity among the households and communities in rural and urban informal settlements is an indication that catchment management in most areas remains a challenge to the water sector, disaster professionals and other players. This study highlights place settlement (proximity to catchments), low-risk knowledge, limited access to communication, poor sanitation, limited institutional capacity, and lack of alternative livelihoods as key drivers of flood vulnerability. These, among others, prevent households near the catchments from living in harmony and at peace with their water resources catchments. As the FVA framework specifies the indicators that contribute to flood vulnerability in rural and urban informal settlements, it is important to consider shifting towards investing in the adaptive capacity of communities along the catchments for better resilience building. The FVA framework considered adaptive capacity to mean actions taken by households to manage their catchments and livelihoods before, during and after floods. The adaptive measures entail the level of resilience households would be (or would not be) to floods. This study considered it crucial to constitute this framework in this manner to provide a roadmap for identifying the underlying causes of household levels of vulnerability to floods. This flood vulnerability assessment framework is applicable for both rural and urban and could be fit for purpose in sectors such as climate change, water resources management, disaster risk management, disaster risk reduction, integrated water management, food security, health, environmental management, engineering etc. The government might find the framework significant to establish clear regulations and accountability mechanisms to ensure that their involvement genuinely contributes to sustainable and equitable outcomes. Enterprises would find the framework useful for mapping vulnerability to natural hazards to address current and future risks in communities, including building community resilience and a line of separation with government.
The FVA framework is the first attempt to agglomerate operators in the UVFs and VCs through a multicollinearity analysis in a logit multiple regression to give rise to indicators in the PEIs, SSIs, ERIs, EEIs and CSIs for flood vulnerability assessment. The framework emphasises both understanding the conditions that generate vulnerability and those that can reduce vulnerability. Therefore, the study emphasises that the Malawi government through the Department of Disaster Management Affairs (DODMA) should strengthen disaster risk reduction by maintaining (1) Political responsibility through the formulation of public policies with a clear understanding of people’s vulnerabilities (2) Legal responsibility through incorporating the framework as a way of perfecting the legal system, enforce the laws and establish laws that are not a centric symbol of disaster enterprise (3) Social responsibility through applying the framework to harmonise systems to be fair and just, without treating others in a sense of societal leniency, greenwashing practices and prioritisation of profit over environmental and social responsibility (4) Economic responsibility through utilising the framework to formulate relevant financial and economic measures i.e. disaster risk funds, to make disaster funds not to base on the declaration of a disaster.
Similarly, mapping vulnerability to natural hazards in urban areas should be enhanced to provide data necessary for developing disaster risk awareness and communication strategies vital to strengthening urban risk knowledge of natural hazards. The framework should be applied in promoting the resilience of communities to mitigate flood risks and can be a key component for planning and decision-making processes both in rural and urban areas. Finally, this study focused on one rural area and one urban informal area, so there is a need for district- wide or city-wide study and/or there is a need for study in urban between planned settlement and Unplanned Traditional Housing Areas (UTHA).
The publication of this research received financial support from the NORHED Project on Climate Change and Ecosystem Management in Malawi and Tanzania (#63826) and the Centre for Resilient Agri-Food Systems (CRAFS) under the Africa Centres of Excellence (ACE2) programme.
The authors declare that they have no known conflict of interest or any kind of influence and relationships that could jeopardize the work reported in this article.
[Crossref] [Google Scholar] [PubMed]
Citation: Mwalwimba KI, Manda M, Ngongondo C (2024) Towards a Framework for Flood Vulnerability Assessment for Rural and Urban Informal Settlements in Malawi. J Geogr Nat Disasters. 14:305.
Received: 02-Feb-2024, Manuscript No. JGND-24-29459; Editor assigned: 05-Feb-2024, Pre QC No. JGND-24-29459 (PQ); Reviewed: 22-Feb-2024, QC No. JGND-24-29459; Revised: 27-Jun-2024, Manuscript No. JGND-24-29459 (R); Published: 04-Jul-2024 , DOI: 10.35248/2167-0587.24.14.305
Copyright: © 2024 Mwalwimba KI, et al. This is an open-access article distributed under the terms of the Creative Commons Attribution License, which permits unrestricted use, distribution, and reproduction in any medium, provided the original author and source are credited.