Journal of Plant Biochemistry & Physiology
Open Access
ISSN: 2329-9029
ISSN: 2329-9029
Research Article - (2014) Volume 2, Issue 4
Transciptome analysis based on next generation sequencing allows quantitative comparisons of gene expression across diverse species. Using Illumina sequencing, we generated a total of 35.7 and 30.1 million paired-end reads with lengths of 100 bp from Paphiopedilum concolor tessellated leaves and Paphiopedilum hirsutissimum green leaves, respectively. De novo assembly yielded 68,602 and 54,273 unigenes with average lengths of 844 and 874 bp for each species leaves, respectively. Based on BLAST searches with known protein sequences, 46.6% unigenes from P. concolor and 48.6% unigenes from P. hirsutissimum were annotated. Gene ontology, cluster of orthologous groups and kyoto encyclopedia of genes and genomes annotations revealed that the functions of the transcripts from the two Paphiopedilum species leaves covered a similarly broad set of molecular functions, biological processes and metabolic pathways. Gene expression profiles analyses between the two Paphiopedilum species leaves revealed that a total of 1,544 genes were obviously differentially expressed. To confirm the differential expression results, the expression profiles of 8 selected genes were analyzed by quantitative real-time PCR. Both transcript differences analysis and leaf internal morphology observation between the two Paphiopedilum species leaves demonstrated that chloroplast, cytoplasm, thylakoid membrane, extracellular region, and nucleus related genes probably played crucial roles in the two Paphiopedilum species leaves formation during evolutional processes. Finally, 8,523 potential EST-SSRs were identified, and 7,864 primer pairs for 6,210 SSRs were obtained. This study provides a valuable clue to understand the mechanisms of Paphiopedilum leaves formation during evolutional adaptation, and supplies us with a large leaf sequence resource for novel gene discovery and marker-assisted studies in Paphiopedilum plants.
Keywords: Chloroplast; EST-SSR markers; Gene expression profiles; Illumina paired-end sequencing; Leaf transcriptome; Paphiopedilum orchids
BLAST: Basic Local Alignment Search Tool; bp: base pair; cDNA: Complementary DNA; Gb: Gigabases; PCR: Polymerase Chain Reaction
In the evolution and adaption of plants, the leaf is more sensitive and plastic to environmental change than the other organs [1,2]. Leaf traits are key factors in terms of reflecting the influence of the environment on the plant and adaptation of the plant to the environment [3]. Moreover, the change of leaf anatomical structures greatly affects plant growth and metabolism [4,5].
Paphiopedilum spp, well-known as lady’s slipper orchids in horticulture, belong to Paphiopedilum genus, Orchidaceae family [6]. With respect to leaf traits, Paphiopedilum has coriaceous, green or tessellated and evergreen leaves [6,7]. The Paphiopedilum genus has attracted considerable attention from stomatal physiologists because of the lack of chloroplasts in its guard cells [1,8-10]. This lack of chloroplasts slows the induction of photosynthesis and ecophysiologically acclimatizes itself to a low light, nutrient-poor and water shortage environments [1,2,9,10]. Paphiopedilum stomata lack a photosynthesis-dependent opening response, but they have blue light and phytochrome-mediated stomatal opening response [11-13] However, molecular studies on Paphiopedilum green or tessellated leaves formation are few.
Currently, next-generation sequencing (NGS) technologies, such as Illumina Genome Analyzer, the Roche/454 Genome Sequencer FLX Instrument and the ABI Solid System, have proven to be powerful and cost-effective tools for advanced research in many areas of orchids, including de novo transcriptome sequencing, gene discovery, expression profiling analysis and molecular marker development [14- 17]. Very recently, mature flowers of Paphiopedilum armeniacum had been sequenced using NGS [18] because the results of this study were based on mature flowers, the comprehensive gene expression profiles of Paphiopedilum green or tessellated leaves still remain unavailable. Moreover, expressed sequence tags (ESTs) collection can contribute to the development of molecular markers for a variety of application in plant genetics and molecular breeding, whereas only a few ESTderived markers from Paphiopedilum have been identified and utilized [19] therefore, extensive transcriptomic sequence data are needed to discover genes controlling Paphiopedilum green or tessellated leaves formation, and to develop new molecular markers for Paphiopedilum plants.
In the present study, we aimed to provide a large collection of assembled and functionally annotated cDNAs in Paphiopedilum green and tessellated leaves, and to identify EST-derived simple sequence repeat (SSR) markers. Furthermore, we compared the gene expression profiles between the Paphiopedilum green and tessellated leaves. Both transcript differences analysis and leaf internal morphology observation demonstrated that chloroplast, cytoplasm, chloroplast thylakoid membrane, extracellular region, and nucleus related genes probably played vital roles in regulation of Paphiopedilum tessellated and green leaves formation. This result represents the first report of public available pyrosequencing data for Paphiopedilum tessellated and green leaves. It also provides an important comparative resource for studies of leaves physiology and evolutionary adaptation in plant biology.
Plant materials and growth conditions
Two Paphiopedilum phenotypes leaves used in this study were from Paphiopedilum concolor and Paphiopedilum hirsutissimum, named PCL and PHL, respectively. P. concolor are tessellated leaves with abaxial entirely purple, whereas P. hirsutissimum are green leaves with abaxial green (Figure 1). Orchids were grown in a greenhouse under natural light at 15 °C to 30 °C in Environmental Horticulture research institute, Guangdong Academy of Agricultural Sciences, Guangzhou, China. Plants were watered and fertilized as needed. To avoid potential expression differences among collections due to circadian rhythms, mature leaves at the second position from top shoots were only collected from three pots of plants (at least four plants per pot) between 9:00 and 10:00 am on April 18, 2012.
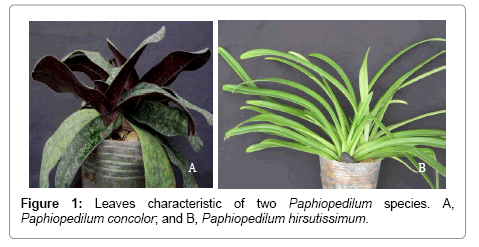
Figure 1: Leaves characteristic of two Paphiopedilum species. A, Paphiopedilum concolor; and B, Paphiopedilum hirsutissimum.
RNA isolation, cDNA library construction and sequencing
The Paphiopedilum two phenotypes leaves were collected in sterile RNase-free tinfoils, respectively, which were placed immediately into liquid nitrogen, and stored at -80 °C until RNA was extracted. Total RNA was isolated from each sample using TRIzol Reagent (Invitrogen, CA, USA) according to the manufacturer’s instructions. To avoid genomic DNA contamination, RNA was treated with RNase-free DNase (TaKaRa, Dalian, China). RNA quality and quantity were analyzed using an Agilent 2100 Bioanalyzer (Agilent Technologies, CA, USA) and a Nanodrop ND1000 (NanoDrop Technologies, Wilmington, USA), respectively.
Two normalized Paphiopedilum leaves cDNA libraries were prepared using Illumina’s kit (Illumina, San Diego, CA, USA) following manufacturer’s recommendations, respectively. Briefly, the poly(A) mRNA was purified from total RNA of each sample using oligo(dT) magnetic beads and fragmented into short sequences using divalent cations under elevated temperature. The cleaved RNA fragments were transcribed into first-strand cDNA using reverse transcriptase and random hexamer-primers, followed by second-strand cDNA synthesis using DNA polymerase I and RNaseH. After the end repair and ligation of adaptors, the products were cleaned up with a QIAquick PCR Purification Kit (Qiagen, Valencia, CA) to create the final cDNA library. Finally, after validating on an Agilent Technologies 2100 Bioanalyzer using the Agilent DNA 1000 chip kit, the two cDNA libraries were sequenced using Illumina HiSeqTM 2000 to obtain short sequences from both ends at Shanghai Biotechnology Corporation (SBC) in Shanghai, China.
Sequence data processing and de novo assembly
The raw reads of each sample were cleaned by removing noncoding RNA (such as rRNA, tRNA and miRNA), adapter sequences and low quality sequences, which included the reads with ambiguous nucleotides and ones containing more than 10% nucleotides in read with Q-value ≤20. The clean reads of each sample were assembled with the CLC Genomics Workbench software (CLC bio, Denmark, http:// www.clcbio.com/) using the following parameters: conflict resolution (vote), similarity of 95% 100 bp over read length and alignment mode (global, do not allow InDels), and then re-assembled twice with CAP3 version 10/15/07 [20] using first round settings (threshold identity cutoff 95% over 500 bp) and second round parameters (threshold identity cutoff 95% over 800 bp), respectively. Briefly, CLC first combined reads with a particular overlap to form longer fragments without N, which were called contigs. Next, the reads were mapped back to the contigs using CLC to construct scaffolds with the paired-end information. The program detected contigs from the same transcript as well as the distances between these contigs. Next, CLC connected the contigs between each pair of contigs using N to represent unknown bases, thus generating scaffolds. Next, the assembled scaffolds were re-assembled twice by CAP3 for gap filling. The sequences with the lowest Ns and those that could not be extended on either end were obtained. Such sequences were defined as unigenes. The unigenes were constructed for each leaf sample, respectively.
Functional annotation
All the publicly available ESTs and transcriptomes of Phalaenopsis and Oncidium orchids (accession Nos. JL898334-JL943742) were downloaded and used for the comparison with our each leaf transcriptome. Firstly, the mRNA sequences of the same cultivar or species were assembled using CAP3 to obtain unigenes with an overlap length cutoff of 50 bp and an overlap percent identity parameter of 90. Comparisons of our each leaf transcriptome with ESTs and transcriptomes of Phalaenopsis and Oncidium orchids were conducted using BLASTx algorithm [21] with E value cut-off 1.0E-10. All Illumina assembled unigenes of each Paphiopedilum leaf were also aligned with sequences in the National Center for Biotechnology Information (NCBI) non-redundant (Nr) database (http://www.ncbi.nlm.nih. gov), Swiss-Prot protein database (http://www.expasy.ch/sprot), Kyoto Encyclopedia of Genes and Genomes (KEGG) pathway database (http://www.genome.jp/kegg), and Cluster of Orthologous Groups (COG) database (http://www.ncbi.nlm.nih.gov/COG) using Blastx algorithm. The E value cut-off was set at 1.0E-5. If the results from the different databases conflicted, a priority order of Nr, Swiss-Prot, KEGG and COG was followed to decide the sequence direction of the unigenes. The Blast2GO [22] was used to predict the Gene Ontology (GO) terms of the unigenes based on BLASTx hits against the NCBI Nr database with an E-value threshold of <1.0E-5.
Gene expression pattern analysis
Unigene expression of each leaf sample was calculated in accordance with the method of reads per kilobase per million reads (RPKM) [23] To identify the differentially expressed genes (DEGs) in two samples overall, the DEGseq, an R package [24] was used. We used a false discovery rate (FDR) of <0.001 and an absolute value of the log2Ratio of ≥1 as the threshold for judging the significance of the gene expression differences [25] Then DEGs were mapped to GO and KEGG databases, and then the number of unigenes for every GO term and KO term were calculated, respectively. The hypergeometric test was used to find significantly enriched GO and KO terms in the DEGs based on p-values. For GO and KO terms enrichment analysis, the calculated p value was determined using Bonferroni correction, taking the corrected p value of ≤ 0.05 as a threshold.
To analysis the protein-coding genes differential expression, we selected the longest protein-coding sequence for each gene in each sample as the representative transcript. Then, applying the criteria for significantly differential expression (|log2Ratio|≥ 2 and FDR<0.001), variations in protein-coding genes expression were identified based on comparison of PCL with PHL. Next, based on the comparison group, we selected those genes (|log2Ratio|≥ 5) to build a cluster tree. Clustering analysis was performed via Muti Experiment Viewer (MeV) version 4.9.0 [26] using the algorithm of hierarchical clustering.
Quantitative real-time PCR (qRT-PCR) analysis
To further verify the expression profiles of the genes in our Illumina sequencing, we selected 8 DEGs for qRT-PCR verification. Sequence comparisons were conducted with Clustal X 1.81 program [27]. Mutual sequences for DEGs were designed with the Prime Primer 5 and primers were listed in Table 1. Total RNA was extracted as described for cDNA library construction. Total RNA (1 μg) from each sample was reverse-transcribed to synthesis first strand cDNAs in a 20 μL reaction volume using the PrimeScriptTM 1st Strand cDNA Synthesis Kit (TaKaRa) according to the manufacturer’s protocol. Real-time PCR was carried out with SYBR Green I kit (TaKaRa) in a final volume of 20 μL, including 0.5 μL forward primer (10 μM), 0.5 μL reverse primer (10 μM), 10 μL SYBR Green Premix (2×), 2.0 μL diluted first strand cDNAs and 7.0 μL sterile distilled water. The reactions were preformed in Light Cycler 480 real-time PCR system (Roche Diagnostics, USA) using the following program: preheating at 95 °C for 30 s followed by 40 cycles of 5 s at 95 °C, 15 s at 58 °C and 30 s at 72 °C. The levels of gene expression were analyzed with Light Cycler 480 Software (Roche Diagnostics) and normalized with the results of 18S rRNA (AJ303203). The relative changes in gene expression levels were calculated using 2-ΔΔCt method. Real-time PCR was performed in three replicates for each sample, and data were indicated as means± SD (n=3).
| Gene name (abbreviation) | Primer sequence (5’→3’) | PCR size (bp) |
|---|---|---|
| Pseudo-response regulator 5 (PRR5) | F: AACCTATTGCTTGGCAGACAT R: ATGGAAAACCCAAAACCCTTA |
175 |
| Phosphoribulokinase, chloroplastic-like (PRK) | F: ACCAGAGGCAGCAGGTTATC R: GGTAGTCATCCAAGCAAATCA |
267 |
| Light-harvesting complex (LHC) | F: CGTCTACGCTTCCTCCTCCAC R: GCCGTCCCTTTTCTTAGTTTT |
105 |
| pyrophosphate-energized vacuolar membrane proton pump 1-like (PVMPP1) | F: CCCTTTTTGGTGCCTTTGTG R: TGTTGAACTGCCTGCGGACT |
180 |
| ATP-dependent zinc metalloprotease FTSH, chloroplastic (FTSH) | F: CCAACCCTTCCCCAGACACA R: GACCTTGCCCTTCTTCACGG |
146 |
| Chlorophyll a-b binding protein CP24 10A, chloroplastic (CBP) | F: TCGTTGCCCCAAAGAAATCA R: GAGAAGCGACCCGAAAGAGA |
290 |
| Gamma tonoplast intrinsic protein (TIP) | F: GGGGGGGAAGGTTCTGTGC R: CGGCGAAGACGAAAATGAC |
159 |
| Chlorophyllase 1 (Chl 1) | F: GGCGGACAGAAGAAGAACCC R: AACAAGATGGCAAGCAGGAG |
102 |
| 18S rRNA | F: GGTCGGCTTGTCCCTTATGT R: TTTCGCAGTGGTTCGTCTTT |
266 |
Table 1: Primer sequences for real-time PCR.
Leaf internal structure observation
Mature leaves of each Paphiopedilum species at the second position from top shoots were excised from the middle portion of leaf blades avoiding the midrib. Small segments were excised under 4% glutaraldehyde in 0.1 M phosphate buffer (pH7.2). The segments were fixed in the above fixative buffer at 4 °C overnight. The tissue segments were then post fixed in 1% osmium tetroxide in 0.1 M phosphate buffer for 16 h at 4°C. Post-fixed tissue segments were rinsed in 0.1 M phosphate buffer and dehydrated in a graded ethanol series followed by two changes of absolute acetone. The tissue segments were then embedded in Spur resin (Sigma). Semithin sections 2 μm thick and ultrathin sections 70 nm thick was cut using a glass knife on an ultramicrotome (Reicherd, Austria), respectively. Semithin sections were collected on some slides and stained in 0.5% toluidine blue solution (10 min), and subsequently looked at them under the light microscope (Laica DM2500, Germany). Ultrathin sections were collected on 50-mesh copper grids and stained in uranyl acetate (10 min), followed by lead citrate (20 min) and subsequently viewed in a transmission electron microscope (TEM) (JEM 1200 EX, Japan) at 100 kV. Eight replicates were used for each leaf sample and five grids for each leaf sample were viewed.
EST-derived SSR markers and primers design
Potential Simple Sequence Repeats (SSRs) markers were detected using MIcroSAtellite (MISA) tool (http://pgrc.ipk-gatersleben.de/ misa/). In this study, the SSRs were considered to contain motifs with two to six nucleotides in size and a minimum of 5 contiguous repeat units. Mononucleotide repeats were ignored since distinguishing genuine mononucleotide repeats from polyadenylation products and single nucleotide stretch errors generated by sequencing was difficult. Primer pairs were designed using BatchPrimer 3 [28]. The parameters for primer pair design were set as following: primer length of 18-28 bases (average 22 bases), annealing temperature between 55 °C and 65 °C (average 58 °C) with a maximum discrepancy within 4 °C between the primer pairs, and PCR product size of 100 to 500 bp (average 300 bp).
Illumina pair-end sequencing and de novo assembly
In this study, two distinct phenotypes leaves from Paphiopedilum orchids were sequenced using Illumina HiSeqTM 2000 sequencing. After cleaning and quality checks, we obtained 35.44 and 29.87 million clean bp paired-end reads for the PCL and PHL, encompassing 3.54 and 2.98 Gb of sequence data, respectively (Table 2). The two phenotypes leaves raw reads data (PCL and PHL) were deposited in the GenBank Short Read Archive under accession numbers SRR1405683 and SRR1405685, respectively.
| Leaf samples | PCL | PHL |
|---|---|---|
| Total raw reads | 35,712,019 | 30,190,340 |
| Total clean reads | 35,443,123 | 29,874,945 |
| Total clean nucleotides (bp) | 3,544,312,300 | 2,987,494,500 |
| Q20 percentage (%) | 99.25 | 98.96 |
| Total number of contigs | 85,230 | 66,189 |
| Average length of contigs (bp) | 510 | 575 |
| Total length of contigs (bp) | 54,632,618 | 45,294,345 |
| N50 of contigs | 724 | 900 |
| Total number of scaffolds | 72,865 | 57,336 |
| Average length of scaffolds (bp) | 801 | 832 |
| Total length of scaffolds (bp) | 58,354,255 | 47,699,962 |
| N50 of scaffolds | 1,258 | 1,354 |
| Total number of unigenes | 68,602 | 54,273 |
| Average length of unigenes (bp) | 844 | 874 |
| Total length of unigenes (bp) | 57,903,739 | 47,455,221 |
| N50 of unigenes | 1,354 | 1,446 |
| Distinct clusters | 3,804 | 2,730 |
| Distinct singletons | 64,798 | 51,543 |
Table 2: Statistics for sequencing and assembly of the two Paphiopedilum orchids leaves transcriptomes.
A de novo assembly was performed for each leaf sample independently. An overview of the sequencing and assembly was given in Table 2. Based on the high-quality reads, a total of 85,230 and 66,189 contigs, with mean sizes of 510 and 575 bp, were assembled from the PCL and PHL libraries, respectively (Table 2). The length distribution of the contigs was shown in Figure S1. Based on the pairedend information of the corresponding assembled contigs, 72,865 and 57,336 scaffolds were obtained, with mean sizes of 801 and 832 bp for PCL and PHL, respectively (Table 2). The length distribution of the scaffolds was shown in Figure S1. After further gap filling, 68,602 and 54,273 unigenes were generated from the PCL and PHL libraries with average lengths of 844 and 874 bp, respectively (Table 2). The length distribution of the unigenes was shown in Figure S1.
Functional annotation of de novo assembled transcripts
Paphiopedilum orchids are members of Orchidaceae. As relatives, Phalaenopsis and Oncidium orchids have been sequenced recently [14,15]. Here, based on the alignments, 38.7% (26,598) of the total PCL unigenes and 38.8% (21,064) of the total PHL unigenes could be matched to transcripts from Phalaenopsis and Oncidium orchids, respectively (Table 3).
| Annotation database | No. unigenes of PCL (%) | No. unigenes of PHL (%) |
|---|---|---|
| Phalaenopsis and Oncidium orchids |
26,598(38.7) | 21,064(38.8) |
| Nr | 29,201(42.5) | 24,547(45.2) |
| Swissprot | 19,738(28.7) | 17,009(31.3) |
| COG | 10,986(16.0) | 10,077(18.5) |
| KEGG | 15,096(22.0) | 12,440(22.9) |
| Total | 32,025 (46.6) | 26,411 (48.6) |
Table 3: Summary of annotation of the four Paphiopedilum orchids leaves transcriptomes against public databases.
All unigenes of each sample generated by Illumina sequencing were also aligned to public protein databases (Nr, Swiss-prot, COG and KEGG) by BLASTx (E values<1.0E-5). A total of 58,436 unigenes were annotated in this matter: 32,025 of 68,602 unigenes (46.6%) from PCL and 26,411 of 54,273 unigenes (48.6%) from PHL, respectively (Table 3). A large proportion of them (about 52%) apparently had no significant match in any of the existing databases, and need more genetic data to annotate. These annotation ratios were higher than floral transcriptome of one orchid, Cymbidium ensifolium, which mapped to public protein databases with a ratio of 41.3% [17]. According to these comparisons, both Paphiopedilum and Cymbidium orchids may contain many unknown genes and pathways, and need more genetic data to annotate. The E-value distribution of the top hits in the Nr database showed that 42.98% and 48.78% of the two libraries mapped sequences have strong homology (smaller than 1.0E-50), respectively, whereas 57.02% and 51.22% of the two libraries homologous sequences ranged between 1.0E-5 to 1.0E-49, respectively (Figure 2A). The species distribution of the best match results for each library sequences was shown in Figure 2B. Among these, the sequences showed the highest homology with Vitis vinifera (33.15% of PCL and 34.46% of PHL unigenes), followed by Oryza sativa Japonica Group (9.12% and 9.03%), Populus trichocarpa (7.69% and 7.37%), Sorghum bicolor (5.65% and 5.73%), Glycine max (5.64% and 5.24%), and Brachypodium distachyon (4.72% and 4.76%) (Figure 2B).
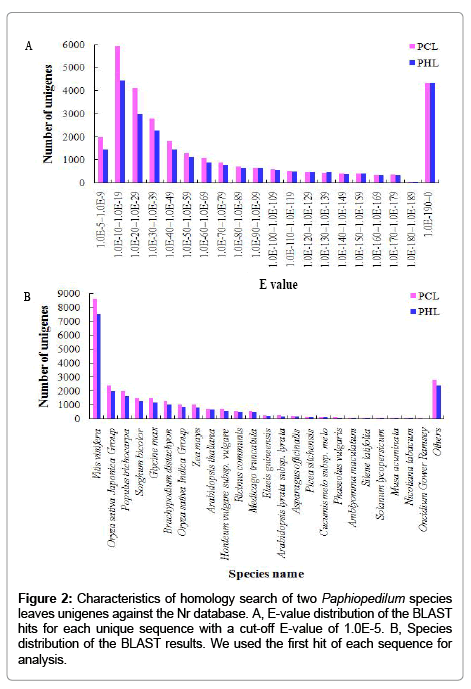
Figure 2: Characteristics of homology search of two Paphiopedilum species leaves unigenes against the Nr database. A, E-value distribution of the BLAST hits for each unique sequence with a cut-off E-value of 1.0E-5. B, Species distribution of the BLAST results. We used the first hit of each sequence for analysis.
GO assignments
The transcripts of the two libraries were assigned GO terms based on BLAST matches in Nr database by using Blast2GO. In total, 17,500 annotated unigenes of PCL and 14,548 annotated unigenes of PHL were further classified into functional 57 GO terms (Figure 3). GO assignments were divided into three main categories: biological process, cellular component, and molecular function. Predicted proteins assigned to biological process were mainly associated with metabolic process (14.73% annotated unigenes of PCL and 14.83% annotated unigenes of PHL), cellular process (13.02% and 13.26%), singleorganism process (3.84% and 3.79%), biological regulation (2.11% and 2.00%) and response to stimulus (2.00% and 1.95%) (Figure 3). Those assigned to cellular component were mainly related with cell (6.99% and 6.98%), cell part (6.99% and 6.98%), organelle (4.86% and 4.83%) and membrane (3.55% and 3.66%) (Figure 3). Finally, those assigned to molecular function were mainly linked to binding (12.89% and 13.12%), catalytic activity (10.55% and 10.59%), transporter activity (0.97% and 0.99%), structural molecule activity (0.49% and 0.46%) and electron carrier activity (0.35% and 0.28%) (Figure 3).
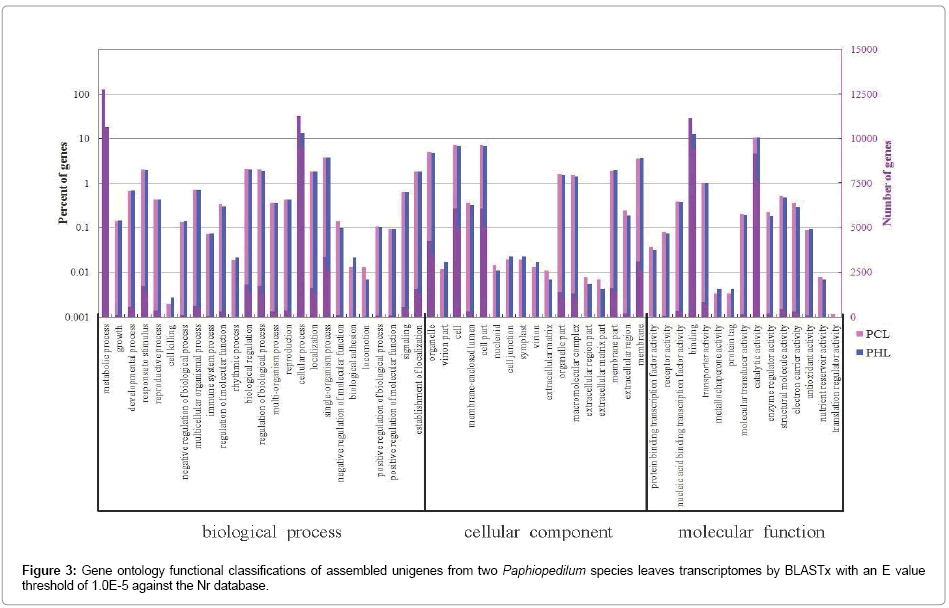
Figure 3: Gene ontology functional classifications of assembled unigenes from two Paphiopedilum species leaves transcriptomes by BLASTx with an E value threshold of 1.0E-5 against the Nr database.
COG classification
The assembled unigenes of the two leaves libraries were assigned to the appropriate COG clusters, respectively. A total of 10,986 unigenes of PCL (16.0%) and 10,077 unigenes of PHL (18.5%) were annotated in the COG database, respectively (Table 3). These COG classifications were grouped into at least 25 functional categories. As shown in Figure 4, the largest category was signal transduction mechanisms (4,880 unigenes of PCL and 4,389 unigenes of PHL), followed by posttranslational modification, protein turnover and chaperones (3,638 and 3,262), general function prediction only (3,279 and 3,093), RNA processing and modification (1,741 and 1,820), and intracellular trafficking, secretion, and vesicular transport (1,818 and 1,706).
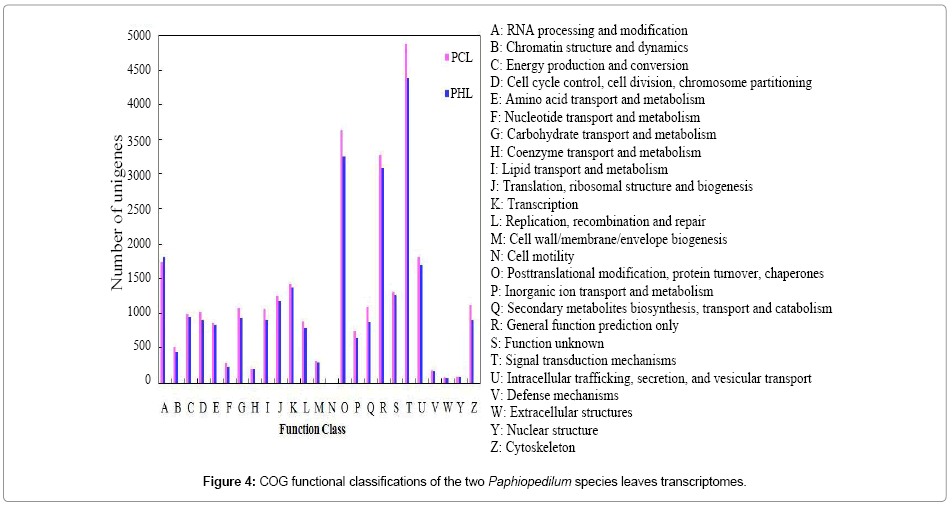
Figure 4: COG functional classifications of the two Paphiopedilum species leaves transcriptomes.
KEGG pathway analysis
To identify the biological pathways that were involved in two Paphiopedilum species leaves formation, we mapped all the unigenes of PCL and PHL to the KEGG database, respectively. In total, 15,096 annotated unigenes of PCL (22.0%) and 12,440 annotated unigenes of PHL (22.9%) were assigned to 256 and 257 KEGG pathways, respectively (Table S1). The 10 most representative pathways were metabolic pathways (767 KOs for PCL and 754 KOs for PHL), biosynthesis of secondary metabolites (338 and 328 KOs), microbial metabolism in diverse environments (125 and 129 KOs), ribosome (121 and 120 KOs), spliceosome (99 and 100 KOs), RNA transport (90 and 92 KOs), purine metabolism (83 and 80 KOs), oxidative phosphorylation (77 and 81 KOs), protein processing in endoplasmic reticulum (75 and 73 KOs), and pyrimidine metabolism (69 and 70 KOs) (Table 4).
| Pathway ID | Pathway description | Mapped KO | ALL pathway KO | Unigene number |
|---|---|---|---|---|
| PCL | ||||
| ko01100 | Metabolic pathways | 767 | 2067 | 1889 |
| ko01110 | Biosynthesis of secondary metabolites | 338 | 720 | 946 |
| ko01120 | Microbial metabolism in diverse environments | 125 | 720 | 406 |
| ko03010 | Ribosome | 121 | 142 | 252 |
| ko03040 | Spliceosome | 99 | 115 | 184 |
| ko03013 | RNA transport | 90 | 134 | 177 |
| ko00230 | Purine metabolism | 83 | 237 | 183 |
| ko00190 | Oxidative phosphorylation | 77 | 206 | 159 |
| ko04141 | Protein processing in endoplasmic reticulum | 75 | 137 | 197 |
| ko00240 | Pyrimidine metabolism | 69 | 150 | 253 |
| PHL | ||||
| ko01100 | Metabolic pathways | 754 | 2067 | 1529 |
| ko01110 | Biosynthesis of secondary metabolites | 328 | 720 | 731 |
| ko01120 | Microbial metabolism in diverse environments | 129 | 720 | 367 |
| ko03010 | Ribosome | 120 | 142 | 217 |
| ko03040 | Spliceosome | 100 | 115 | 173 |
| ko03013 | RNA transport | 92 | 134 | 183 |
| ko00190 | Oxidative phosphorylation | 81 | 206 | 136 |
| ko00230 | Purine metabolism | 80 | 237 | 140 |
| ko04141 | Protein processing in endoplasmic reticulum | 73 | 137 | 159 |
| ko00240 | Pyrimidine metabolism | 70 | 150 | 211 |
Table 4: Number of KEGG orthologs (KO) in pathways with top mapped KOs for the two Paphiopedilum species leaves ranscriptomes.
Gene expression pattern analysis
On the basis of the applied criteria for DEGs (|log2Ratio|≥1 and FDR<0.001), variations in gene expression were identified based on comparison of PCL with PHL. Totally, 1,544 significantly DEGs were screened, of which 675 were up-regulated and 869 were down-regulated (Figure 5). These DEGs and their expression patterns were presented in Table S2. The results indicated that there was overall difference in differentially expressed transcriptional level between Paphiopedilum green leaves and tessellated leaves.
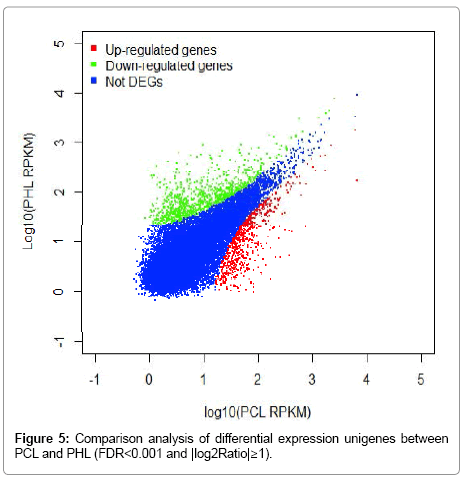
Figure 5: Comparison analysis of differential expression unigenes between PCL and PHL (FDR<0.001 and |log2Ratio|≥1).
Compared with PHL, PCL had significant difference in leaf morphology. These specific traits may be controlled by genes. According to GO annotation, KEGG pathway annotation, and RPKM expression of genes, 67 protein-coding unigenes showed significantly expressed between PCL and PHL(|log2Ratio|≥ 5), which were analyzed by cluster analysis (Figure 6).
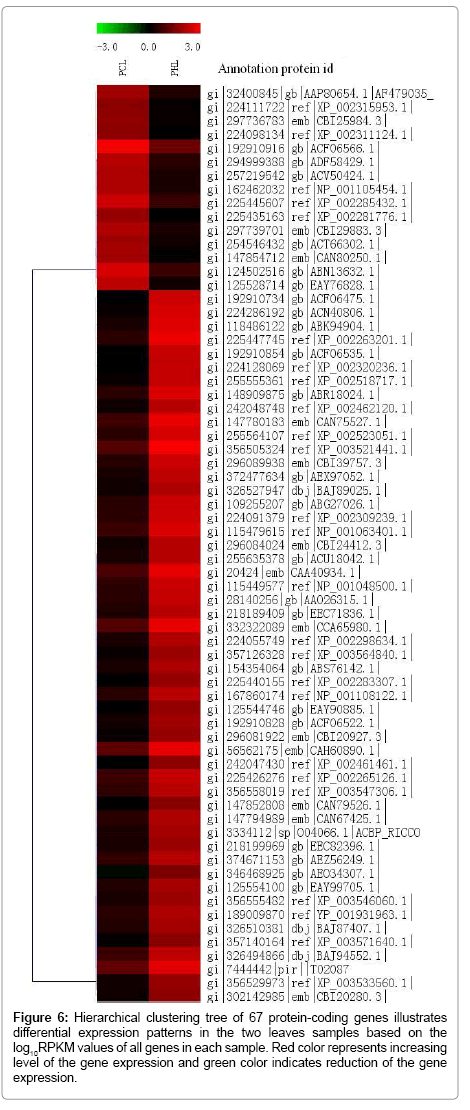
Figure 6: CHierarchical clustering tree of 67 protein-coding genes illustrates differential expression patterns in the two leaves samples based on the log10RPKM values of all genes in each sample. Red color represents increasing level of the gene expression and green color indicates reduction of the gene expression.
As shown in Table 5, we found 21 GO terms that were significantly enriched in PCL vs PHL, including 7 terms of biological processes, 5 terms of cellular components, and 9 terms of molecular functions. Of these GO terms, the biological processes of enriched DEGs mainly focused on DNA integration (GO:0015074; P value=1.41E-07), translation (GO:0006412; P value=0.03355), RNA-dependent DNA replication (GO:0006278; P value=0.00332), and transmembrane transport (GO:0055085; P value=3.05E-05). Interestingly, we found that the cellular components of enriched DEGs mainly related to chloroplast (GO:0009507; P value=0.00176), ribosome (GO:0005840; P value=0.01353), chloroplast envelope (GO:0009941; P value=0.00935), chloroplast thylakoid membrane (GO:0009535; P value=0.03088), and extracellular region (GO:0005576; P value=0.03125). The molecular functions mainly concentrated on ATP binding (GO:0003723; P value=0.03998), nucleic acid binding (GO:0003676; P value=0.00515), RNA binding (GO:0003723; P value=0.03998), structural constituent of ribosome (GO:0003735; P value=0.02370), RNA-directed DNA polymerase activity (GO:0003964; P value=0.003326), and transferase activity, transferring hexosyl groups (GO:0016758; P value=0.00183).
| GO ID | GO_terms | Up-regulated genes | Down-regulated genes | Corrected P value |
|---|---|---|---|---|
| biological_process | ||||
| GO:0015074 | DNA integration | 38 | 5 | 1.41E-07 |
| GO:0055085 | transmembrane transport | 15 | 0 | 3.05E-05 |
| GO:0006278 | RNA-dependent DNA replication | 23 | 7 | 0.00332689 |
| GO:0042545 | cell wall modification | 0 | 6 | 0.015625 |
| GO:0006412 | translation | 25 | 12 | 0.03355244 |
| GO:0043086 | negative regulation of catalytic activity | 2 | 9 | 0.03857422 |
| GO:0006730 | one-carbon metabolic process | 1 | 7 | 0.0390625 |
| cellular_component | ||||
| GO:0009507 | chloroplast | 36 | 14 | 0.0017692 |
| GO:0009941 | chloroplast envelope | 19 | 6 | 0.00935531 |
| GO:0005840 | ribosome | 23 | 9 | 0.01353099 |
| GO:0009535 | chloroplast thylakoid membrane | 13 | 4 | 0.03088379 |
| GO:0005576 | extracellular region | 0 | 5 | 0.03125 |
| molecular_function | ||||
| GO:0016758 | transferase activity, transferring hexosyl groups | 12 | 1 | 0.00183105 |
| GO:0003964 | RNA-directed DNA polymerase activity | 23 | 7 | 0.00332689 |
| GO:0003676 | nucleic acid binding | 42 | 20 | 0.0051524 |
| GO:0045330 | aspartyl esterase activity | 0 | 6 | 0.015625 |
| GO:0030599 | pectinesterase activity | 1 | 8 | 0.02148438 |
| GO:0004857 | enzyme inhibitor activity | 1 | 8 | 0.02148438 |
| GO:0003735 | structural constituent of ribosome | 26 | 12 | 0.0237027 |
| GO:0005524 | ATP binding | 70 | 47 | 0.03378818 |
| GO:0003723 | RNA binding | 30 | 16 | 0.03998606 |
Table 5: GO enrichment analysis of significantly DEGs between PCL and PHL (P<0.05).
Additionally, our study found a total of significant differences in 6 pathways, including microbial metabolism in diverse environments (ko01120; P value=0.01045), ribosome (ko03010; P value=0.02881), alcoholism (ko05034; P value=0.04904), pyruvate metabolism (ko00620; P value=0.00738), oxidative phosphorylation (ko00190; P value=0.00634), and proteasome (ko03050; P value=0.03125) (Table 6). For example, in pyruvate metabolism pathway, two genes encoding phosphoenolpyruvate carboxylase showed significant higher expression in PHL than those in PCL (Table 7). Furthermore, two other genes involved in the pyruvate metabolism pathway, i.e., acetyl-CoA carboxylase and aldehyde dehydrogenase, were also identified as having stronger expression in PHL than in PCL (Table 7). On the contrary, two genes encoding biotin carboxyl carrier protein subunit and cytosolic pyruvate kinase, respectively, were found to be more strongly expressed in PCL than in PHL (Table 7). These results suggest that the differences of Paphiopedilum green leaves and tessellated leaves were partially determined by the DEGs in the pyruvate metabolism pathway.
| Pathway ID | Pathway name | Up-regulated genes | Down-regulated genes | Corrected P value |
|---|---|---|---|---|
| ko00190 | Oxidative phosphorylation | 1 | 10 | 0.006347656 |
| ko00620 | Pyruvate metabolism | 2 | 12 | 0.007385254 |
| ko01120 | Microbial metabolism in diverse environments | 18 | 37 | 0.010454818 |
| ko03010 | Ribosome | 11 | 24 | 0.02881672 |
| ko03050 | Proteasome | 0 | 5 | 0.03125 |
| ko05034 | Alcoholism | 12 | 4 | 0.049041748 |
Table 6: KEGG enrichment analysis of significantly DEGs between PCL and PHL (P<0.05).
| Differential unigene pair | Log2 ratio | P-value | Protein description |
|---|---|---|---|
| PCL_contig_18010-PHL_contig_2581 | -4.1210 | 1.78E-30 | predicted protein [Populus trichocarpa] (XP_002332745.1) |
| PCL_contig_7465-PHL_contig_5595 | -3.7563 | 4.29E-30 | predicted protein [Populus trichocarpa] (XP_002314435.1) |
| PCL_contig_4036-PHL_contig_22 | -2.1233 | 5.14E-28 | phosphoenolpyruvate carboxylase [Ricinus communis] (ABR29877.1) |
| PCL First_Contig1586-PHL_contig_6570 | -4.2942 | 6.11E-17 | hypothetical protein SORBIDRAFT_02g025790 [Sorghum bicolor](XP_002462451.1) |
| PCL_contig_1903-PHL_contig_699 | -1.5164 | 5.94E-14 | phosphoenolpyruvate carboxylase [Dendrobium officinale] (AEG78834.1) |
| PCL_contig_4694-PHL_contig_988 | -1.5554 | 6.89E-09 | acetyl-CoA carboxylase [Elaeis guineensis] (ABF74732.1) |
| PCL_contig_537-PHL_contig_35 | -1.0768 | 2.14E-07 | PREDICTED: acetyl-CoA carboxylase 1-like [Vitis vinifera] (XP_002285808.1) |
| PCL_contig_43554-PHL First_Contig517 | -4.2695 | 5.59E-07 | predicted protein [Hordeum vulgare subsp. vulgare] (BAJ97979.1) |
| PCL_contig_3750-PHL_contig_6767 | -2.2395 | 1.70E-06 | NADP-malic enzyme [Aloe arborescens] (BAA24950.1) |
| PCL_contig_7852-First_Contig10 | -1.4078 | 2.30E-06 | predicted protein [Populus trichocarpa] (XP_002302483.1) |
| PCL_contig_3385-PHL_contig_110 | -1.1450 | 2.41E-06 | Aldehyde dehydrogenase family 3 member H1 [Oryza sativa] (NP_001065921.1) |
| PCL_contig_68327-PHL_contig_11399 | -4.3069 | 3.23E-06 | predicted protein [Hordeum vulgare subsp. vulgare] (BAJ92168.1) |
| PCL_contig_2948-PHL_contig_22166 | 3.4319 | 1.71E-10 | biotin carboxyl carrier protein subunit [Jatropha curcas] (ACT33948.1) |
| PCL_contig_13175-PHL_contig_11946 | 1.8721 | 5.11E-05 | Pyruvate kinase, cytosolic isozyme [Oryza sativa] (NP_001042731.1) |
Table 7: Pyruvate metabolism enrichment analysis of DEGs from the comparisons of PCL with PHL.
Validation of RNA-seq based on gene expression by qRT-PCR
To verify the expression of genes in our Illumina data, 8 genes associated with chloroplast, chloroplast thylakoid membrane, and other molecular function and biological process were selected for qRT-PCR analyses. Based on genes expression profiles (Figure7), we found that 2 unigenes encoding light-harvesting complex (LHC) and pyrophosphate-energized vacuolar membrane proton pump 1-like (PVMPP1), respectively, showed significant higher expression levels in PHL than in PCL, whereas 1 unigene encoding gamma tonoplast intrinsic protein (TIP) displayed obvious lower transcripts in PHL than in PCL. Furthermore, 5 unigenes encoding chloroplastic-like phosphoribulokinase (PRK), chlorophyll a-b binding protein CP24 10A (CBP), ATP-dependent zinc metalloprotease FTSH (FTSH), pseudoresponse regulator 5 (PRR5) and chlorophyllase 1 (Chl 1), respectively, also showed higher expression levels in PHL than in PCL (Figure 7). These expression results of 8 genes in Paphiopedilum green leaves and tessellated leaves were consistent with the Illumina data, further supporting the accuracy of the Illumina results (Figure 7).
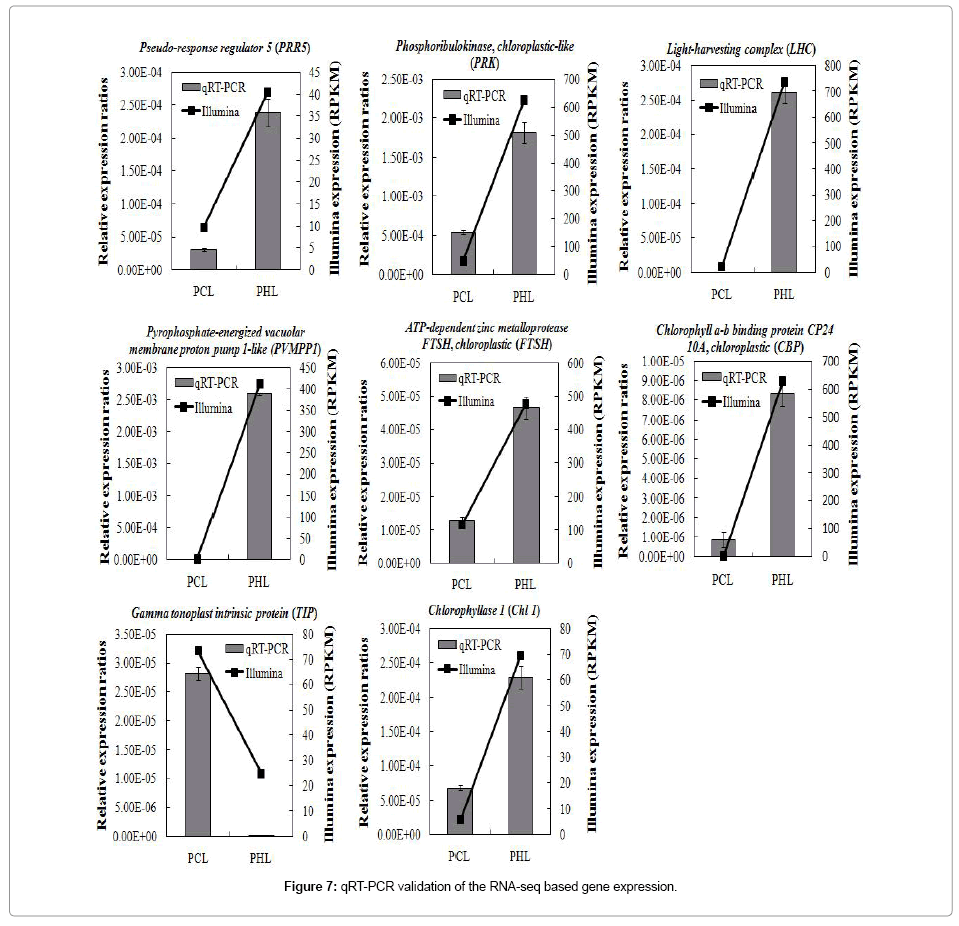
Figure 7: qRT-PCR validation of the RNA-seq based gene expression.
Leaf internal structure observation
For morphology study of the two Paphiopedilum species leaves, only some representative data were shown, because the micrographs of the replicates were similar. The morphology of the two Paphiopedilum species leaves differed in leaf thickness and structure of the mesophyll (Figure 8). Between one and two layers of palisade cells could be found incompact range in P. concolor, whereas between three and four layers of of palisade cells closely and firmly arranged together in P. hirsutissimum (Figure 8).
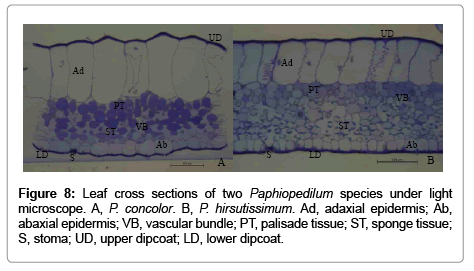
Figure 8: Leaf cross sections of two Paphiopedilum species under light microscope. A, P. concolor. B, P. hirsutissimum. Ad, adaxial epidermis; Ab, abaxial epidermis; VB, vascular bundle; PT, palisade tissue; ST, sponge tissue; S, stoma; UD, upper dipcoat; LD, lower dipcoat.
For TEM study of the two Paphiopedilum species leaves, the mesophyll cells from the two Paphiopedilum species showed normal chloroplasts, although the extracellular region, cytoplasm, thylakoid and accumulation of starch in chloroplasts varied (Figure 9). Compared with metabolic accumulation in cytoplasm in palisade and sponge cells of P. hirsutissimum, there was obviously more denser accumulation in cytoplasm in both mesophyll cells of P. concolor (Figure 9A-D). The extracellular regions of palisade cells of P. concolor covered with dense hairlike projections, compared to those in P. hirsutissimum, but generally they did not have hairy projections (Figure 9A,C). Both grana and stroma thylakoids might be narrower and looser in the chloroplasts of P. concolor as compared to those in the chloroplasts of P. hirsutissimum (Figure 9G-H). In addition, only the chloroplasts of P. hirsutissimum could be found swarms of small granules in thylakoid membrane (Figure 9G-H).
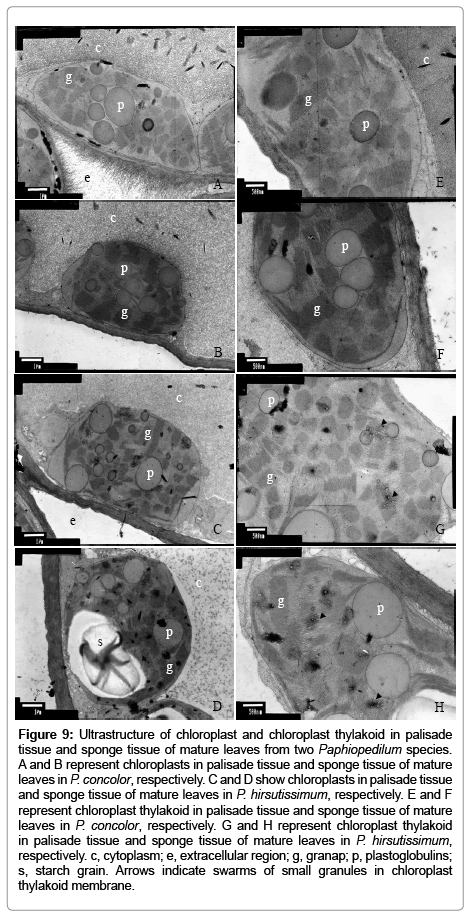
Figure 9: Ultrastructure of chloroplast and chloroplast thylakoid in palisade tissue and sponge tissue of mature leaves from two Paphiopedilum species. A and B represent chloroplasts in palisade tissue and sponge tissue of mature leaves in P. concolor, respectively. C and D show chloroplasts in palisade tissue and sponge tissue of mature leaves in P. hirsutissimum, respectively. E and F represent chloroplast thylakoid in palisade tissue and sponge tissue of mature leaves in P. concolor, respectively. G and H represent chloroplast thylakoid in palisade tissue and sponge tissue of mature leaves in P. hirsutissimum, respectively. c, cytoplasm; e, extracellular region; g, granap; p, plastoglobulins; s, starch grain. Arrows indicate swarms of small granules in chloroplast thylakoid membrane.
EST-SSR markers identification and characterization
SSR markers are very useful molecular markers for the construction of genetic maps, genetic relationship and resources diversity analysis. In this study, a total of 8,523 potential EST-SSR markers were identified from 7,805 unique sequences from the two libraries, including di-, tri-, tetra-, penta-, and hexa-nucleotide motifs (Table 8). Of these, 377 and 308 sequences from PCL and PHL, respectively, contained more than 1 EST-SSR (Table 8). The EST-SSRs included 3,353 (71.15%) and 2,647 (69.45%) di-nucleotide motifs from PCL and PHL, respectively, followed by tri-nucleotide motifs (1,245, 26.42%; 1,090, 28.60%), tetranucleotide motifs (50, 1.06%; 29, 0.76%), hexa-nucleotide motifs (23, 0.48%; 16, 0.41%) and penta-nucleotide motifs (12, 0.25%; 6, 0.15%) (Table 8). The most abundant repeat type was (AG/CT), followed by (GA/TC), (AT/TA), (CA/TG) and (CCG/CGG) for the two leaves samples, respectively (Table 8). Additionally, based on the potential 8,523 SSRs, 4,390 primer pairs from 3,441 SSRs in PCL and 3,474 primer pairs from 2,769 SSRs in PHL, were successfully designed using BatchPrimer3 (Table S3).
| Sample | PCL | PHL |
|---|---|---|
| Number of unigenes containing SSRs | 4,319 | 3,486 |
| Di-nucleotide | 3,353 | 2,647 |
| AG/CT | 1,303 | 1,109 |
| GA/TC | 1,264 | 995 |
| AT/TA | 496 | 364 |
| CA/TG | 160 | 88 |
| AC/GT | 113 | 85 |
| CG/GC | 17 | 6 |
| Tri-nucleotide | 1,245 | 1,090 |
| CCG/CGG | 127 | 96 |
| GCC/GGC | 91 | 90 |
| GGA/TCC | 82 | 76 |
| CGC/GCG | 80 | 63 |
| TTC/GAA | 77 | 90 |
| CTC/GAG | 73 | 89 |
| Tetra-nucleotide | 50 | 29 |
| Penta-nucleotide | 12 | 6 |
| Hexa-nucleotide | 23 | 16 |
| Number of unigenes containing more than 1 SSRs | 377 | 308 |
| Total number of identified SSRs | 4,712 | 3,811 |
| Number of unique sequences containing SSRs with sufficient flanking sequences for PCR primer design |
3,441 | 2,769 |
| Number of primer pairs designed | 4,390 | 3,474 |
Table 8: Summary of microsatellite marker identification in the two Paphiopedilum species leaves unigenes.
In this study, using Illumina HiSeqTM 2000 sequencing, two distinct phenotypes leaves of Paphiopedilum orchids were sequenced, and generated 3.54 and 2.98 Gb of clean sequence data, respectively (Table 2). These sequences produced longer unigenes (mean 844 bp for PCL and 874 bp for PHL, respectively) than those assembled in the previous studies, such as radish (820 bp) [29] and sesame (629 bp) [30]. These unigenes were used for BLASTx and annotation against public protein databases like Nr, Swiss-prot, COG and KEGG. Totally, 32,025 unigenes of PCL and 26,411 unigenes of PHL were identified through BLASTx searches, and 53.4% unigenes of PCL and 51.4% unigenes of PHL had no homologues in public protein databases, respectively (Table 3). These results may indicate that Paphiopedilum tessellated and green leaves contain many unique genes that control respective leaves formation.
Previous studies reported that transcriptome analysis based on NGS technologies allows quantitative comparisons of gene expression across multiple species [31,32]. In this study, the transcriptomes of Paphiopedilum green leaves and tessellated leaves were assessed. Hierarchical clustering of the 67 protein-coding genes revealed that the differentially co-expressed genes existence in the two different phenotypes leaves (Figure 6). The resulting GO enrichment analyses indicated that most of DEGs assigned to cellular component were associated with chloroplast (GO:0009507), chloroplast envelope (GO:0009941), and chloroplast thylakoid membrane (GO:0009535). Of these DEGs, 36 up-regulated and 14 down-regulated genes were related with chloroplast, 19 up-regulated and 6 down-regulated genes were involved in chloroplast envelope, and 13 up-regulated and 4 down-regulated genes were associated with chloroplast thylakoid membrane (Table 5). We further investigated the expression of several genes associated with chloroplast in PCL and PHL. For examples, the expression of both LHC and PVMPP1 showed significant higher expression levels in PHL than in PCL, whereas TIP displayed obvious lower transcripts in PHL than in PCL (Figure 7). LHC proteins of plants and eukaryotic microalgae, located in the thylakoid membrane of the chloroplasts, are of paramount importance for balancing lightharvesting versus intracellular energy utilization to survive everchanging environmental conditions and can form light-harvesting pigment protein complexes [33]. The energy-dependent transport of solutes across the vacuolar membrane (tonoplast) of plant cells is driven by two H+ pumps: a vacuolar (V-type) H(+)-ATPase (EC 3.6.1.3) and a H(+)-translocating (pyrophosphate-energized) inorganic pyrophosphatase (H(+)-PPase; EC 3.6.1.1). In Arabidopsis thaliana, the H(+)-PPase, like the V-type H(+)-ATPase, is abundant and ubiquitous in the vacuolar membranes of plant cells, and both enzymes make a substantial contribution to the transtonoplast H(+)-electrochemical potential difference [34]. The tonoplast contains an abundant intrinsic protein with six membrane-spanning domains that is encoded by a small gene family. In A. thaliana, the expression pattern of gamma-TIP is correlated with cell enlargement [35]. Therefore, it is tempting to speculate that LHC and PVMPP1, and TIP may positively and negatively participate in regulation of the Paphiopedilum green leaves formation to survive in ever-changing environmental conditions, respectively; however, these situations were vice versa in Paphiopedilum tessellated leaves. Additionally, PRK, CBP, FTSH, PRR5, and Chl 1 showed obvious higher expression levels in PHL than in PCL (Figure 7). The significance expression of these five genes in PHL remains unclear, and it is worth to investigate further.
We also investigated the internal structure of two Paphiopedilum species leaves (Figure 8 and 9). These observations revealed that the differences of palisade cells arrangement, chloroplast, thylakoid membrane, cytoplasm, and extracellular region existed between PCL and PHL. Based on gene expression results and morphology observation findings, we suggest that chloroplast, thylakoid membrane, cytoplasm, extracellular region and nucleus related genes may play important roles in Paphiopedilum tessellated and green leaves characteristic formation.
In the current study, 8,523 potential EST-SSR markers were identified from the two phenotypes Paphiopedilum leaves transcriptomes, and 6.35% unigene sequences possessed SSRs (Table 8). The SSR frequency in present study was consistent with the range of frequencies reported for other plant species, such as Sesamum indicum [30]. Di-nucleotide motifs were the most frequent SSR motif type. This finding was consistent with the results reported for sesame, sugar beet, cabbage, soybean, sunflower and grape [30,36] whereas trinucleotide motifs were the most abundant SSRs in radish, rice, wheat and barley [29,37]. Among the di-nucleotide repeats, AG/CT was the most abundant motif in our data (Table 5). This finding was consistent with the results reported for other plant species [29,31]. Among the tri -nucleotide motifs, the most frequent motifs was CCG/CGG in our data, whereas AAG/CTT was the most frequent motifs in other plant species, such as radish, sesame and peanut [29,30,38].
In conclusion, using Illumina HiSeqTM 2000 sequencing, we generated more than 6.5 Gb clean paired-end reads, comprising 122,875 unigenes from two different Paphiopedilum species leaves transcriptomes. These data provide a rich resource for comparative genomic studies for plant species. These unigenes were used for BLASTx and annotation against public databases, such as Nr, Swissprot, COG, and KEGG. In total, 58,436 unigenes were annotated through BLAST searches and about 47.5% of the total unigenes had homologues in the known databases. Both transcript differences analysis and leaf internal morphology observation between the two phenotypes leaves demonstrated that chloroplast, cytoplasm, thylakoid membrane, and nucleus related genes probably played critical roles in regulation of tessellated and green leaves formation in Paphiopedilum. A large number of SSRs were identified, and thousands of SSR primer pairs were designed in each leaf transcriptome. These EST-SSR markers and primers will enable the construction of a genetic linkage map, quantitative trait loci mapping and marker-assisted studies. The availability of leaves transciptomic data for Paphiopedilum orchids will accelarate genes and genomes studies on functional regulation leaf traits formation at molecular level.
There is no conflict of interest.
Conceived the experiments: FBL. Designed and performed the experiments: DML. Analyzed the data: DML HQY. Contributed reagents/materials/analysis tools: DML CYZ GFZ FBL. Drafted the manuscript: DML.
This work was financially supported by Guangzhou Municipal Science and Technology Project (No. 12C14071654) and Guangdong Academy of Agricultural Sciences Fund (No. 201019).