International Journal of Physical Medicine & Rehabilitation
Open Access
ISSN: 2329-9096
ISSN: 2329-9096
Research Article - (2022)
Background: The neurotropic B vitamins such as thiamine (B1), pyridoxine (B6), and cobalamin (B12) play a pivotal role in the maintenance of neuronal viability and contribute essentially to a healthy nervous system. Furthermore, it is well recognised that deficiencies in neurotropic B vitamins can lead to a variety of neurological conditions and peripheral neuropathies. However, to date, the effect of B vitamin depletion on modulation of genes and cellular pathways has not been fully assessed.
Materials and Methods: In this current study we used RNA sequencing and transcriptomic analysis to investigate gene expression changes in primary cultures of mouse Dorsal Root Ganglion (mDRG) neurons in response to neurotropic B vitamin depletion. Gene Ontology (GO) enrichment analysis identified significant changes in pathways and processes associated with energy metabolism and neuronal death when comparing mDRG neurons grown in optimal conditions supplemented with vitamins B1, B6, B12 to vitamin B free medium lacking these B vitamins.
Results: In total 161 genes were differentially regulated after 3 days in vitamin B free medium. This number increased to 735 genes differentially regulated after 6 days in vitamin B free medium. We also found activation of certain prosurvival pathways, presumably as compensatory mechanisms to B vitamin depletion. A complex induction of prosurvival and pro-death pathways therefore appears to be responsible for ultimately determining the fate of neurons.
Conclusion: Taken together, our study identifies gene expression changes and the involvement of pathways potentially linked to mDRG neurodegeneration occurring in response to depletion of neurotropic B vitamins.
mDRG neurons; Neurodegeneration; Transcriptome; Vitamin B depletion; Neurotropic B vitamins
Neurotropic B vitamins (B1, B6, B12) play an essential role in preserving the overall health of the peripheral and central nervous system [1-3]. Vitamin B1 (thiamine) is extensively involved in the synthesis of glucose-derived neurotransmitters and provides energy to nerve cells as a cofactor in the conversion of carbohydrates to energy [4]. Vitamin B1 is also involved in maintenance of nerve membrane function, acts as an antioxidant, thereby protecting nerves from oxidative damage, and is a key factor in nerve conduction velocity [3,5–9]. Vitamin B6 (pyridoxine) is involved as a coenzyme in one-carbon unit generation and homocysteine metabolism but also in the synthesis of neurotransmitters such as dopamine, Gamma Aminobutyric Acid (GABA), and 5-hydroxytryptamine (5-HT) [3,10,11]. Vitamin B12 (cobalamin) has two active forms in human cells, Methyl Cobalamin (MeCbl) and Adenosyl Cobalamin (AdoCbl). MeCbl acts as a coenzyme for the conversion of homocysteine to methionine. Methionine then acts as a methyl-donor for processes such as the synthesis of myelin, 5-HT, dopamine, noradrenaline, DNA and phospholipids [3,12,13]. AdoCbl is a coenzyme for the conversion of L-methylmalonyl-CoA into succinyl-CoA, an essential intermediate of the citric acid cycle [14].
Deficiencies in neurotropic B vitamins have been linked to a variety of neurological conditions such as lack of coordination, depression, and peripheral neuropathies [1,2,15–17]. More specifically, deficiency in vitamin B1 has been linked to beriberi [18], neuronal mitochondria dysfunction [19] and cell stress [4,20,21]. Deficiency in vitamin B6 has been linked to neurodevelopmental conditions [22,23], and vitamin B12 deficiency has been linked to peripheral neuropathy [1] and swelling of myelinated neurons, resulting in demyelination and cell death [24]. Taken in combination, it appears that the dual role of neurotropic B vitamins in energy metabolism and neurotransmitter synthesis means that neuronal health, and peripheral and central nervous system (PNS and CNS, respectively) function may be particularly sensitive to B vitamin deficiencies [2].
In this current study, we assess the requirement of vitamins B1, B6, and B12 to support axonal outgrowth in healthy peripheral neurons. We determine that removal of these neurotropic B vitamins results in a time-dependent slowing of axonal growth followed by degeneration of the neuronal population. Subsequently, using Next- Generation Sequencing (NGS), we assessed the gene expressional profile of mDRGs in the presence and absence of neurotropic B vitamins. Differential gene expression analysis identified sets of genes deregulated in response to B vitamin deficiency. These genes and associated pathways may be linked to the neurodegeneration response occurring due to depletion of neurotropic B vitamins.
Preparation of neurobasal medium with and without B vitamins
Neurobasal medium lacking vitamin B1, vitamin B6, and vitamin B12 was prepared by Life Technologies GmbH (Darmstadt, Germany). Individual and/or combinations of vitamin B1, B6, or B12 were added to this Neurobasal medium as indicated in the text. “Optimal” medium was similar to the concentration of B vitamins present in standard Neurobasal cell culture medium and contained 40 µM vitamin B1, 20 µM vitamin B6, and 0.4 µM vitamin B12. “Vitamin B free” medium contained no vitamin B1, B6, or B12 (all other vitamins were contained) and was used to assess the effects of B1, B6, and B12 depletion. For experiments requiring individual or combinations of specific B vitamins, cells were first plated in vitamin B free medium and then B vitamins added to give the final concentration as indicated in the text.
Preparation of mouse dorsal root ganglion neurons
Cultures of dorsal Root Ganglion neurons (DRGs) were prepared from E12.5 mouse embryos (strain C57Bl/6J). Briefly, pregnant female mice were euthanized, embryos removed and spinal cords with attached DRGs were dissected and centrifuged at 500 g for 1 min. Cells were dissociated using 1 ml 0.25% trypsin/EDTA with constant agitation at 37°C for 30 min. Cells were again centrifuged, resuspended in vitamin B free Neurobasal medium and filtered to remove debris, before being added to cell culture plates. Cellular imaging experiments were performed in 96-well plates using a cell density of 5,000 cells/well, whilst RNA sequencing experiments were performed in 24-well plates at a density of 100,000 cells per well. This cell density was required to provide suitable biomass for RNA sequencing. Two hours after adding the mDRGs to the cell culture plates, additional medium was added to each well generate the final required concentration of B vitamins. Plates with mDRG cells were incubated at 37°C and 5% CO2 for up to 6 days. Each independent experiment was performed in separate weeks using a different culture preparation, and the number of well replicates is indicated in the text and figure legends.
Quantitative analysis of axonal length and cell body area
Automated quantification of axonal length and cell body area was performed using the IncuCyte S3 Live Cell Analysis System with the NeuroTrack analysis software package (Sartorius, Göttingen, Germany). Quantification of axonal outgrowth was generated automatically and represented graphically as neurite length (mm) normalised to total area of the cell bodies. Since mDRG cell bodies often clustered together, thereby making it difficult to perform an accurate count of the actual number of cells, the total area of cell bodies (cell body cluster per mm2) was instead used as a quantitative readout of cell number per image field. In total, data from nine image fields was collected per well.
Immunocytochemistry beta-III tubulin staining
The mDRGs were washed with cold Phosphate Buffered Saline (PBS) and then fixed in 1% paraformaldehyde (PFA)/sucrose for 10 min. After fixation, cells were immunostained using neuronspecific beta-III tubulin mouse (Tuj1) IgG2A primary antibody (Bio-Techne GmbH, Wiesbaden, Germany; MAB1195, 1:5,000) and goat anti-mouse Alexa 647 secondary antibody (Thermo Fisher Scientific, Waltham, MA, USA; A-21236, 1:2,000). DAPI (1:2,000) was used to stain nuclei. Automated image acquisition was conducted using the Opera Phenix High Content Screening system (PerkinElmer Inc., Waltham, MA, USA) with a 20 x water immersion objective (Olympus, Tokio, Japan; NA 1.15, pixel size: 0.32 µm).
RNA collection and preparation
Cells were harvested for RNA extraction and library preparation according to the following steps: medium was removed, cells washed 1x with PBS and lysed by addition of RLT lysis buffer (RNeasy Mini Kit; Qiagen, Hilden, Germany) containing 1% ß-mercaptoethanol. RNA quality was assessed by RNA chip analysis using an RNA Nano Kit and Agilent 2100 Bioanalyzer (both Agilent Technologies, Santa Clara, CA, USA).
Library preparation
Libraries of RNA derived from mDRGs were prepared by using the TruSeq Stranded mRNA (messenger RNA) Sample Preparation Kit (Illumina, San Diego, CA, USA) according to the manufacturer’s instructions. This kit converts sample mRNA into a cDNA (complementary DNA). Poly-A containing mRNA molecules were purified using poly-T oligo attached magnetic beads. The mRNA was then fragmented using divalent cations under elevated temperature and the cleaved RNA fragments copied into first strand cDNA using reverse transcriptase and random primers. Strand specificity was achieved by replacing dTTP (deoxythymidine triphosphate) with dUTP (deoxyuridine, triphosphate) in the Second Strand Marking Mix, followed by second strand cDNA synthesis using DNA polymerase I and RNase H. The products were bead purified and enriched via PCR to create the final cDNA library.
Sequencing and transcriptomic data evaluation
For transcriptomic data evaluation, library preparations derived from mDRGs grown in different B vitamin conditions were submitted for DNA sequencing (CeGaT GmbH, Tübingen, Germany) with the following sequencing parameters: NovaSeq 6000, S1 Flow Cell, 100 cycles. Data sets were mapped against Mus musculus databases (Genome Assembly GRCm38). All data sets had a high quality (e.g. gene body coverage indicate no trace of RNA degradation) and were suitable for analysis in PanHunter platform (Evotec SE, Hamburg, Germany). Principle Component Analysis (PCA) on the 500 most variable genes (sample variance) was used to explore overall gene expression similarities between data sets. Differential gene expression analysis was performed using DESeq2 [25]. P-values were adjusted to control for the False Discovery Rate (FDR) using the Benjamini & Hochberg procedure [26]. Genes were deemed statistically significant with an FDR<0.01 and absolute fold change>2. Furthermore, genes were filtered for a minimum CPM (counts per million) of 5 in denominator samples. Subsequent Gene Ontology Enrichment analysis was performed with information from the emphGene Ontology database on the resulting genes using topGO with a significance threshold of p<0.001. Enriched WikiPathways (Mus musculus, Mm) were reported using a threshold of 0.001.
Live cell studies of axonal outgrowth
Mouse DRGs were grown for 6 days in vitro (DiV) in optimal supplemented vitamin B Neurobasal medium, or vitamin B free Neurobasal medium and axonal outgrowth and cell body number were monitored by live cell imaging. Axonal length increased in an approximate linear fashion over the 6-day period for cells in optimal Neurobasal conditions (Figure 1). In contrast, from around 72-96 h onwards lower growth rates and axonal degeneration was observed in mDRGs maintained in vitamin B free medium (Figure 1). This lower growth rate could be readily observed under phase contrast images (Figures 2 and 3), plus accompanying Supplementary video). To normalise results between mDRG preparations, values at 72 h (DiV3) and 138 h (DiV6) were expressed relative to values at 24 h (DiV1) within each culture (Figures 4 and 5). Statistical analysis of variance (one-way ANOVA) showed that the amount of axonal outgrowth at DiV 3 under vitamin B free conditions was not significantly different from optimal vitamin B conditions (Figure 4). However, comparison at DiV 6 showed a marked and significant reduction in the amount of axonal outgrowth. This was manifest as a 7.1 ± 1.3 fold increase in axonal length between DiV 1 and DiV 6 in optimal conditions, compared to a 3.1 ± 1.5 fold increase in axonal length in vitamin B free conditions. This equates to a 55% reduction in the amount of axonal growth at DiV 6 (n=3, P ≤ 0.001, data from three independent experiments), (Figure 5). In addition to the decrease in axonal length, growth of mDRGs in vitamin B free Neurobasal medium for 6 days also appeared to induce a degeneration response in the neuronal cell bodies. This could be approximated by comparing the total area of cell bodies in the collected image fields for optimal and vitamin B free Neurobasal medium. In these current experiments, culturing mDRG neurons in vitamin B free Neurobasal medium for 6 DiV resulted in a 36% ± 3% reduction in total cell body area (n=3, P<0.01).

Figure 1: mDRG axonal outgrowth in the presence (Optimal) or
absence of neurotropic B vitamins (Vitamin B free). Time-course
of increases in neurite (axonal) length in mDRGs was measured in
real time with an Incucyte S3 using 20x magnification. Sample rate
was one image every 6 h, and 9 image field were captured per well.
Neurite length measurements were calculated using Neurotrack
software (Sartorius) and normalised to the total area of cell bodies per
image field. Cells were incubated in optimal Neurobasal medium or
Neurobasal medium lacking vitamins B1, B6, or B12 (vitamin B free). 
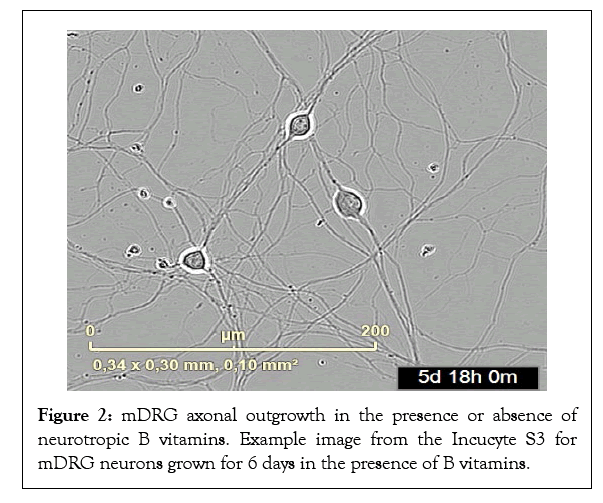
Figure 2: mDRG axonal outgrowth in the presence or absence of neurotropic B vitamins. Example image from the Incucyte S3 for mDRG neurons grown for 6 days in the presence of B vitamins.
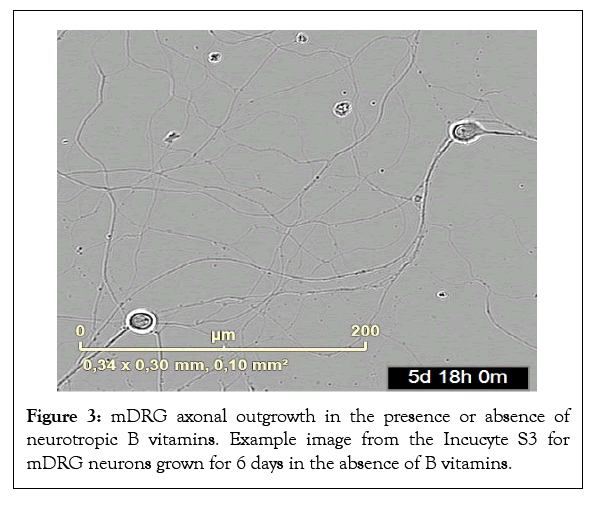
Figure 3: mDRG axonal outgrowth in the presence or absence of neurotropic B vitamins. Example image from the Incucyte S3 for mDRG neurons grown for 6 days in the absence of B vitamins.
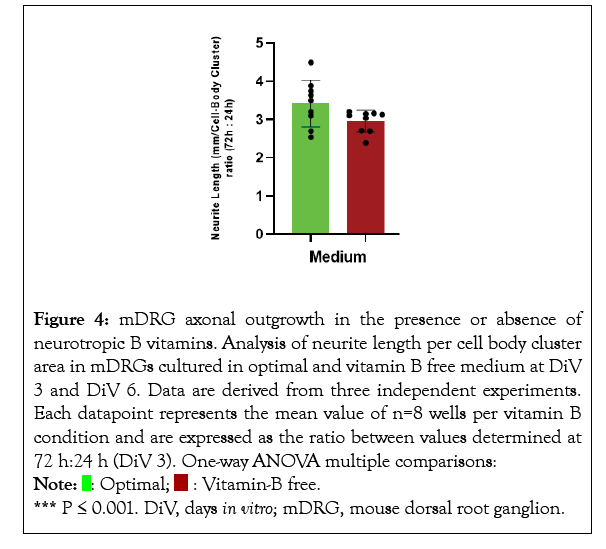
Figure 4: mDRG axonal outgrowth in the presence or absence of
neurotropic B vitamins. Analysis of neurite length per cell body cluster
area in mDRGs cultured in optimal and vitamin B free medium at DiV
3 and DiV 6. Data are derived from three independent experiments.
Each datapoint represents the mean value of n=8 wells per vitamin B
condition and are expressed as the ratio between values determined at
72 h:24 h (DiV 3). One-way ANOVA multiple comparisons:  *** P ≤ 0.001. DiV, days in vitro; mDRG, mouse dorsal root ganglion.
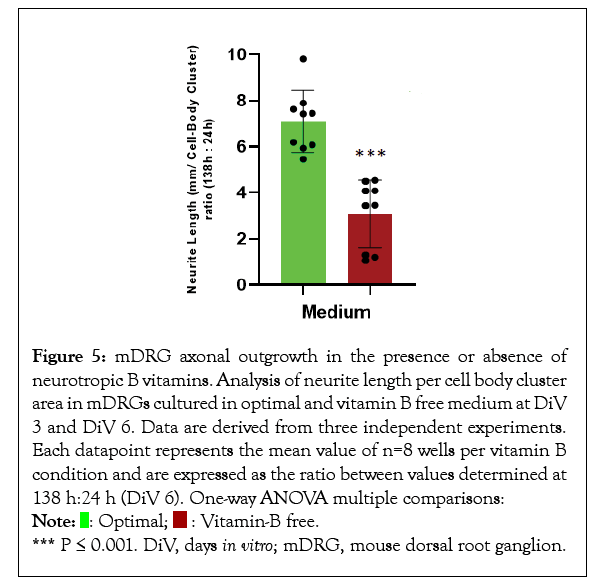
Figure 5: mDRG axonal outgrowth in the presence or absence of
neurotropic B vitamins. Analysis of neurite length per cell body cluster
area in mDRGs cultured in optimal and vitamin B free medium at DiV
3 and DiV 6. Data are derived from three independent experiments.
Each datapoint represents the mean value of n=8 wells per vitamin B
condition and are expressed as the ratio between values determined at
138 h:24 h (DiV 6). One-way ANOVA multiple comparisons:  *** P ≤ 0.001. DiV, days in vitro; mDRG, mouse dorsal root ganglion.
Finally, to assess the health of the underlying beta-tubulin network necessary for supporting axonal outgrowth, mDRG neurons at DiV 6 were fixed and stained for beta-III tubulin. As demonstrated in Figures 6 and 7, mDRG neurons grown in vitamin B free conditions showed a punctate beta-tubulin staining indicative of a degenerating axonal network [27]. Taken together, these data show that removing the neurotropic B vitamins results in a time-dependent slowing of axonal outgrowth, a weakening of the tubular network and the onset of a cellular degeneration response. Findings suggest that vitamins B1, B6, and B12 support neuronal cell viability, neurite growth and nerve cell network formation of healthy mouse DRG neurons and are, thus, essential for neuronal cell fitness and the maintenance of a healthy nerve function.
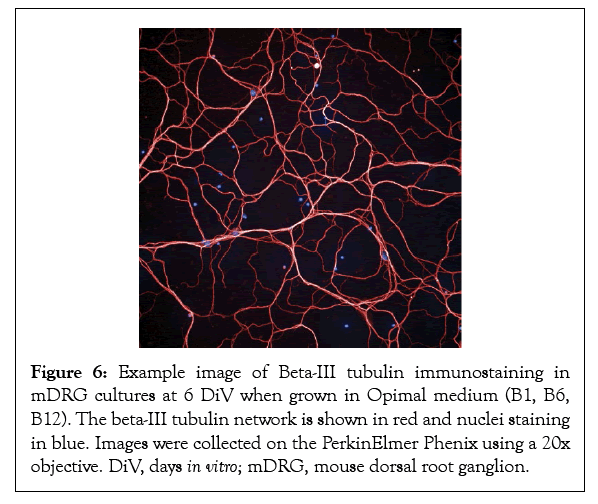
Figure 6: Example image of Beta-III tubulin immunostaining in mDRG cultures at 6 DiV when grown in Opimal medium (B1, B6, B12). The beta-III tubulin network is shown in red and nuclei staining in blue. Images were collected on the PerkinElmer Phenix using a 20x objective. DiV, days in vitro; mDRG, mouse dorsal root ganglion.
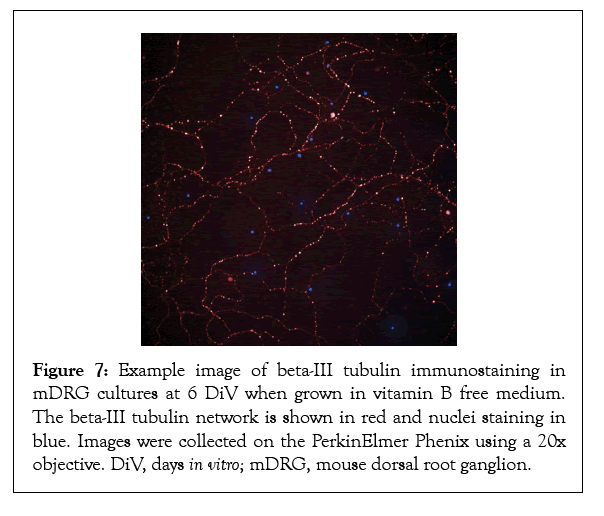
Figure 7: Example image of beta-III tubulin immunostaining in mDRG cultures at 6 DiV when grown in vitamin B free medium. The beta-III tubulin network is shown in red and nuclei staining in blue. Images were collected on the PerkinElmer Phenix using a 20x objective. DiV, days in vitro; mDRG, mouse dorsal root ganglion.
RNA deep sequencing and transcriptome analysis
Mouse DRGs were grown for 3 and 6 DiV in vitamin B free and optimal supplemented vitamin B medium. To ensure sufficient cellular biomass, mDRGs were cultured at a density of 100,000 cells/ well in 24-well culture plates. All other conditions were identical to those described in 3.1 for axonal outgrowth measurements. Cell health was confirmed prior to collection of mRNA by collecting images using the Incucyte S3; however, measurements of axonal area were not feasible due to the higher density of the network in these cultures (data not shown). At the end of the culture period, cell samples were processed as described in 2.2 and sequenced at a depth of approximately 20 million reads. Two separate experiments were conducted from different mouse preparations and the combined results were analysed using Evotec’s in-house transcriptome analysis platform PanHunter.
Using the criteria for statistical analysis described in 2.7, growth of mDRG neurons in medium containing no vitamin B1, B6, or B12 (vitamin B free medium) showed a clear and significantly different gene expression pattern when compared to mDRG neurons grown in optimal B vitamin conditions (Figures 8 and 9). Principal Component Analysis (PCA) of the 500 most differentially regulated genes demonstrated that sample replicates within and between experiments grouped closely together, indicating good reproducibility within the experiment. Minimal vitamin B media consisted of vitamin B free neurobasal medium supplemented with 100 nM vitamin B1, 60 nM vitamin B6, and 0.5 nM vitamin B12. Optimal vitamin B media consisted of vitamin B free neurobasal medium supplemented with 40 µM vitamin B1, 20 µM vitamin B6, and 0.4 µM vitamin B12. (Figure 8). Both the presence or absence of neurotropic B vitamins and the age of the cultures were strong drivers of differential gene expression. Interestingly, reducing the vitamin B content to minimal levels (see Figure 9 legend for details) did not significantly alter gene expression relative to optimal B vitamin conditions (Figure 8). This suggests that complete removal of vitamins B1, B6, and B12 was required to initiate gene expression changes over the time frame of this study. In total, 161 genes were significantly differentially expressed in cells grown in vitamin B free media for 3 days (out of a total of 36,989 measured genes) (Supplementary Table 1). By DiV 6, this number had increased to 735 genes (Supplementary Table 1). The majority of genes differentially regulated at DiV 3 were also differentially regulated at DiV 6 (124 genes), (Figure 9), suggesting that these may be key to the initial effect of B vitamin removal (Supplementary Table 2).
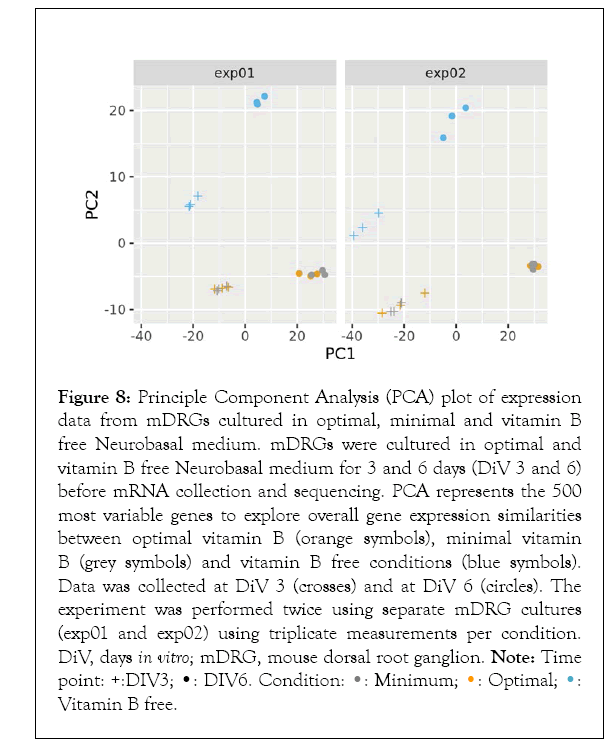
Figure 8: Principle Component Analysis (PCA) plot of expression
data from mDRGs cultured in optimal, minimal and vitamin B
free Neurobasal medium. mDRGs were cultured in optimal and
vitamin B free Neurobasal medium for 3 and 6 days (DiV 3 and 6)
before mRNA collection and sequencing. PCA represents the 500
most variable genes to explore overall gene expression similarities
between optimal vitamin B (orange symbols), minimal vitamin
B (grey symbols) and vitamin B free conditions (blue symbols).
Data was collected at DiV 3 (crosses) and at DiV 6 (circles). The
experiment was performed twice using separate mDRG cultures
(exp01 and exp02) using triplicate measurements per condition.
DiV, days in vitro; mDRG, mouse dorsal root ganglion. Note: Time Vitamin B free.
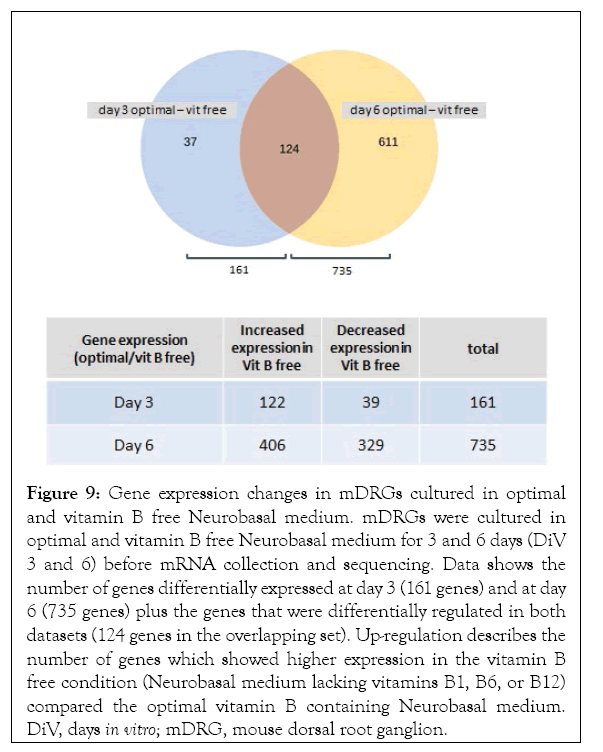
Figure 9: Gene expression changes in mDRGs cultured in optimal and vitamin B free Neurobasal medium. mDRGs were cultured in optimal and vitamin B free Neurobasal medium for 3 and 6 days (DiV 3 and 6) before mRNA collection and sequencing. Data shows the number of genes differentially expressed at day 3 (161 genes) and at day 6 (735 genes) plus the genes that were differentially regulated in both datasets (124 genes in the overlapping set). Up-regulation describes the number of genes which showed higher expression in the vitamin B free condition (Neurobasal medium lacking vitamins B1, B6, or B12) compared the optimal vitamin B containing Neurobasal medium. DiV, days in vitro; mDRG, mouse dorsal root ganglion.
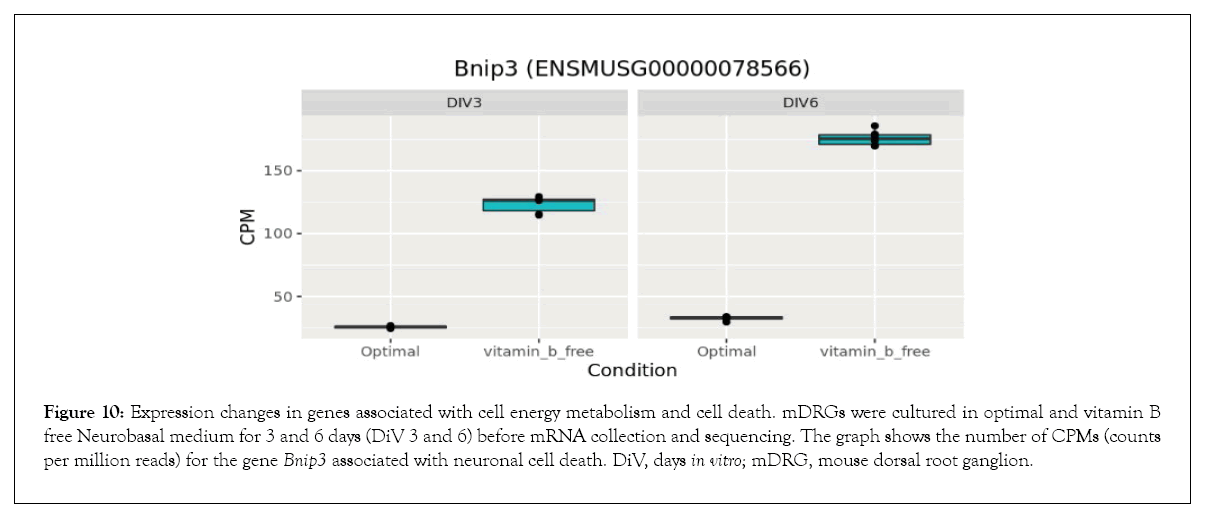
Figure 10: Expression changes in genes associated with cell energy metabolism and cell death. mDRGs were cultured in optimal and vitamin B free Neurobasal medium for 3 and 6 days (DiV 3 and 6) before mRNA collection and sequencing. The graph shows the number of CPMs (counts per million reads) for the gene Bnip3 associated with neuronal cell death. DiV, days in vitro; mDRG, mouse dorsal root ganglion.
Bioinformatics-based Gene Ontology (GO) enrichment analysis was performed to identify which biological processes would be most affected by the observed gene expression changes in the overlapping dataset between DiV 3 and 6 (optimal vs. vitamin B free), (Table 1 and Supplementary Table 3). Included in this list of affected biological processes are those associated with neuronal death and those related to the energetics (Table 1). Interestingly, amongst the set of neuronal death proteins was Bnip3 (a BCL2 interacting protein) which was significantly upregulated in mDRGs grown in vitamin B free medium (Figure 10 and Table 2). Also observed was the upregulation of Fam162a (Figure 11) and Ddit3 and Bbc3 (BCL2 binding component 3) are p53-regulated genes which have pro-apoptotic function. Sesn2 (Sestrin 2), a pro-survival stress-induced protein, is known to be upregulated in response to (Figure 12). As described in more detail below, upregulation of this and other proteins in this set may be linked to the neurodegeneration response observed in response to withdrawal of vitamins B1, B6, B12. Regarding changes in energetic pathways, the expression of a number of proteins involved in glycolysis and gluconeogenesis were increased in this dataset. These proteins included the rate limiting enzyme hexokinase 2 (Hk2), (Figure 13 and Table 2) and aldolases A and C (Aldoa and Aldoc, respectively) (Figures 14 and 15) (Table 2).
| ID | Name | Collection | no. of genes | Down in vitamin b free | Up in vitamin b free |
|---|---|---|---|---|---|
| WP157 | Glycolysis and Gluconeogenesis | Wiki pathways (Mm) | 49 | 0 | 9 |
| GO:0071456 | cellular response to hypoxia | GO BP | 128 | 1 | 11 |
| GO:0006090 | pyruvate metabolic process | GO BP | 98 | 0 | 9 |
| GO:0006096 | glycolytic process | GO BP | 72 | 0 | 7 |
| GO:0005996 | monosaccharide metabolic process | GO BP | 215 | 1 | 8 |
| GO:0030388 | fructose 1,6-bisphosphate metabolic process | GO BP | 10 | 0 | 3 |
| GO:0019318 | hexose metabolic process | GO BP | 200 | 1 | 7 |
| GO:0009892 | negative regulation of metabolic process | GO BP | 1545 | 2 | 22 |
| GO:0045892 | negative regulation of transcription, DNA templated | GO BP | 1006 | 1 | 17 |
| GO:0000122 | negative regulation of transcription by RNA polymerase II | GO BP | 750 | 1 | 14 |
| GO:0070997 | neuron death | GO BP | 376 | 0 | 10 |
| GO:0050812 | regulation of acyl-CoA biosynthetic process | GO BP | 5 | 0 | 2 |
| GO:0060948 | cardiac vascular smooth muscle cell development | GO BP | 5 | 0 | 2 |
| GO:0036003 | positive regulation of transcription from RNA polymerase II promoter in response to stress | GO BP | 22 | 0 | 3 |
| GO:0048878 | chemical homeostasis | GO BP | 868 | 3 | 13 |
| GO:0015850 | organic hydroxy compound transport | GO BP | 145 | 4 | 2 |
| GO:0000820 | regulation of glutamine family amino acid metabolic process | GO BP | 6 | 1 | 1 |
| GO:0035795 | negative regulation of mitochondrial membrane permeability | GO BP | 6 | 0 | 2 |
| GO:1990440 | positive regulation of transcription from RNA polymerase II promoter in response to endoplasmic reticulum stress | GO BP | 6 | 0 | 2 |
| GO:0051402 | neuron apoptotic process | GO BP | 270 | 0 | 8 |
Table 1: Gene Ontology enrichment analysis. mDRG neurons were cultured in the presence and absence of the neurotropic B vitamins: B1, B6 and B12. After 3 and 6 DiV mDRGs were collected, the mRNA was collected and sequenced. Genes that demonstrated significant differential regulation at both day 3 and day 6 were subjected to gene ontology enrichment analysis. The following conditions were used to define statistical significance: FDR<0.01, absolute fold change >2, minimum CPM=5. The number of up or downregulated genes is indicated in the table as are the total number of genes associated with that Gene Ontology (GO) or Wiki-Pathway (WP). CPM, counts per million; DiV, days in vitro; FDR, false discovery rate; mDRG, mouse dorsal root ganglion.
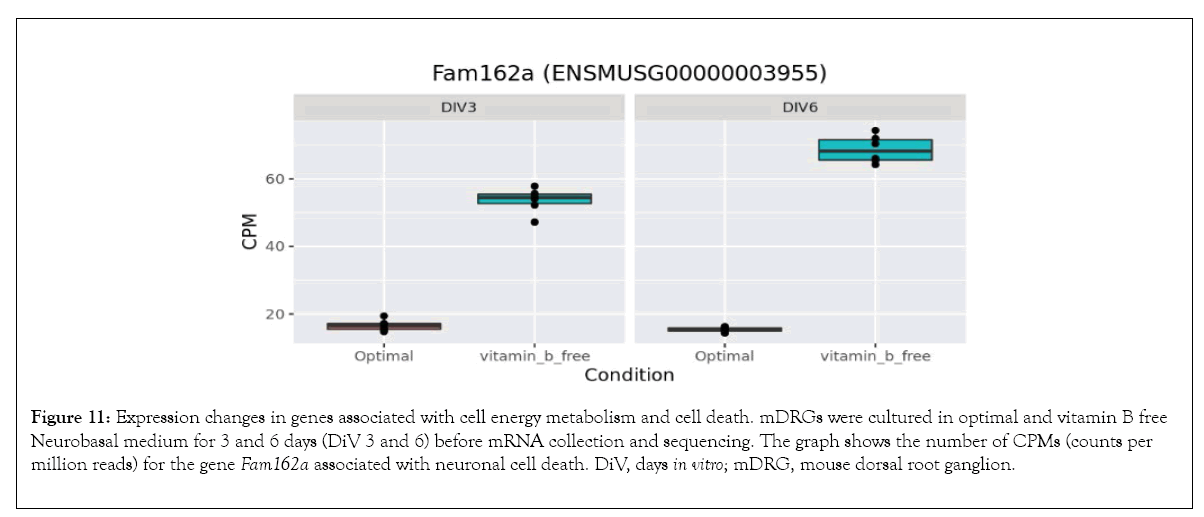
Figure 11: Expression changes in genes associated with cell energy metabolism and cell death. mDRGs were cultured in optimal and vitamin B free Neurobasal medium for 3 and 6 days (DiV 3 and 6) before mRNA collection and sequencing. The graph shows the number of CPMs (counts per million reads) for the gene Fam162a associated with neuronal cell death. DiV, days in vitro; mDRG, mouse dorsal root ganglion.
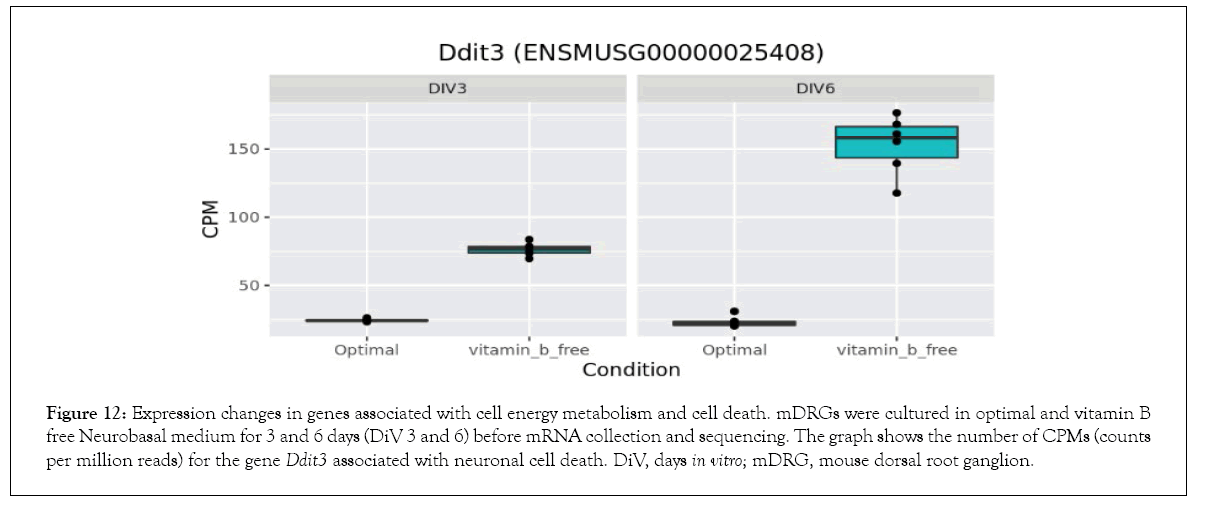
Figure 12: Expression changes in genes associated with cell energy metabolism and cell death. mDRGs were cultured in optimal and vitamin B free Neurobasal medium for 3 and 6 days (DiV 3 and 6) before mRNA collection and sequencing. The graph shows the number of CPMs (counts per million reads) for the gene Ddit3 associated with neuronal cell death. DiV, days in vitro; mDRG, mouse dorsal root ganglion.
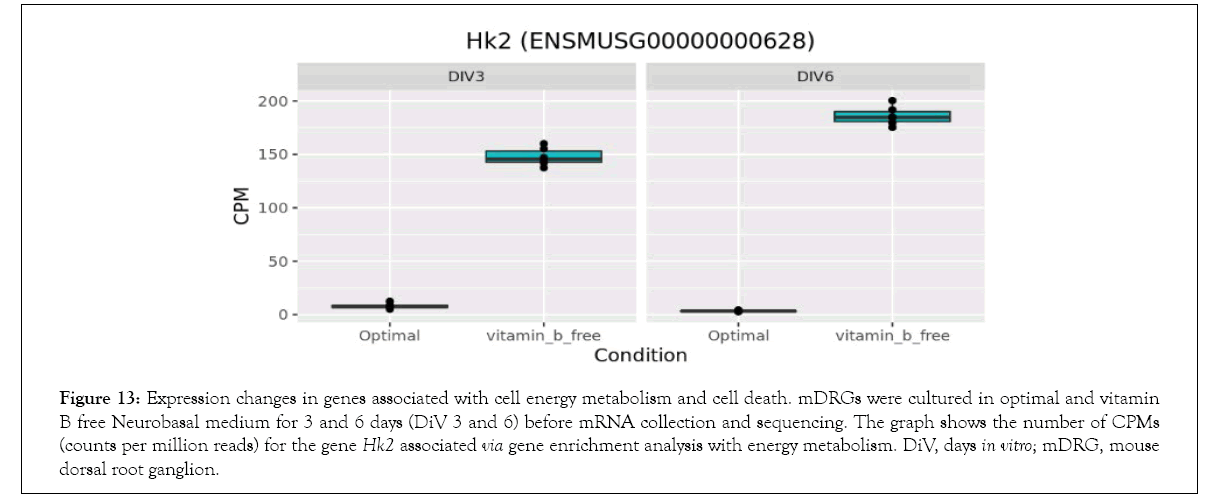
Figure 13: Expression changes in genes associated with cell energy metabolism and cell death. mDRGs were cultured in optimal and vitamin B free Neurobasal medium for 3 and 6 days (DiV 3 and 6) before mRNA collection and sequencing. The graph shows the number of CPMs (counts per million reads) for the gene Hk2 associated via gene enrichment analysis with energy metabolism. DiV, days in vitro; mDRG, mouse dorsal root ganglion.
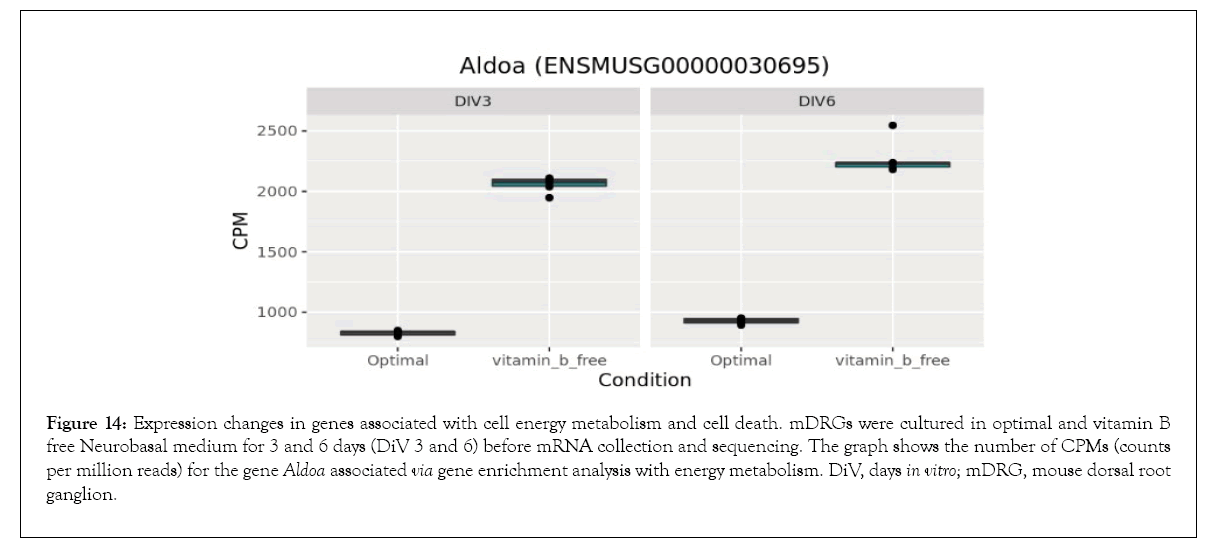
Figure 14: Expression changes in genes associated with cell energy metabolism and cell death. mDRGs were cultured in optimal and vitamin B free Neurobasal medium for 3 and 6 days (DiV 3 and 6) before mRNA collection and sequencing. The graph shows the number of CPMs (counts per million reads) for the gene Aldoa associated via gene enrichment analysis with energy metabolism. DiV, days in vitro; mDRG, mouse dorsal root ganglion.
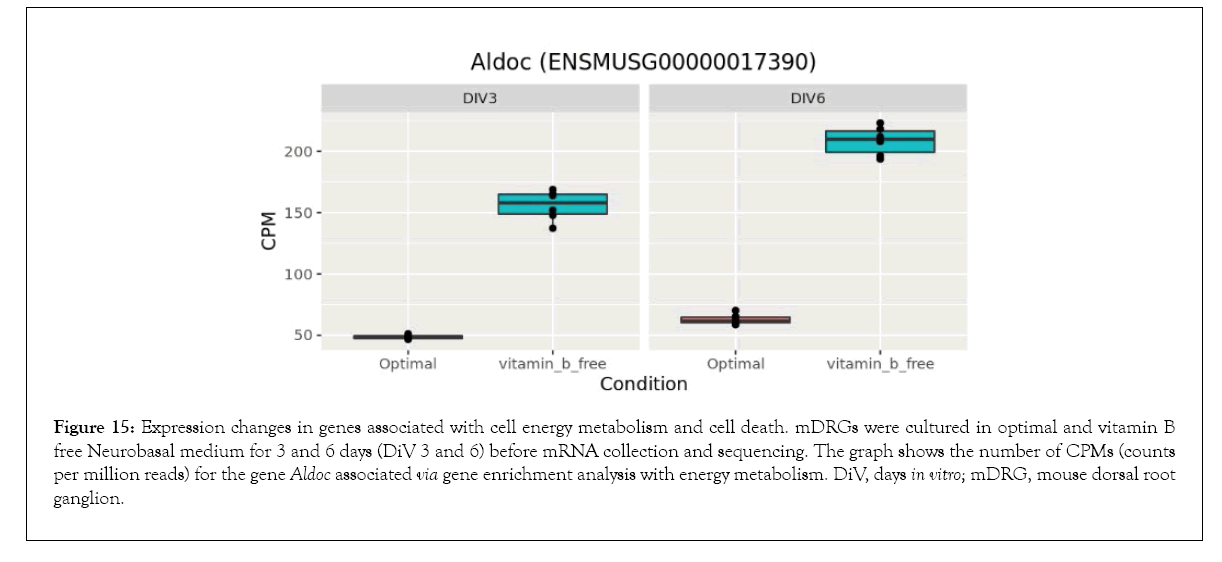
Figure 15: Expression changes in genes associated with cell energy metabolism and cell death. mDRGs were cultured in optimal and vitamin B free Neurobasal medium for 3 and 6 days (DiV 3 and 6) before mRNA collection and sequencing. The graph shows the number of CPMs (counts per million reads) for the gene Aldoc associated via gene enrichment analysis with energy metabolism. DiV, days in vitro; mDRG, mouse dorsal root ganglion.
As described above, the longer incubation time in vitamin B free media (6 days as opposed to 3 days) resulted in a much greater number of differentially expressed genes (>700) compared to cells grown in media containing optimal vitamin B levels. In addition to the glycolysis and gluconeogenesis pathway already discussed above, enrichment analysis also identified the p53 signalling pathway to be significantly affected at 6 DiV (see Supplementary Table 4). The p53 signalling pathway regulates a complex array of downstream events including apoptosis, autophagy, and metabolism (Kastenhuber and Lowe). In total, 11 genes from the p53 pathway were identified as being differentially expressed by culturing in the absence of neurotropic B vitamins (Table 2). As can be seen from Figures 16-18, removal of vitamin B1, B6, and B12 increased gene expression at certain nodes of the p53 pathway (e.g. Bbc3 and Sesn2), (Figures 16 and 17) and decreased gene expression at other p53 pathway nodes (e.g. Perp), (Figure 18). As discussed in more detail below, Perp (p53 apoptosis effector related to PMP22) hypoxia and energy deficiency, and observed upregulation may indicate activation of a pathway to reduce the harmful effect of vitamin B depletion.
| Neuronal death | Expression in vitamin B free | Glycolysis and Gluconeogenesis pathway | Expression in vitamin B free | p53 pathway | Expression in vitamin B free |
|---|---|---|---|---|---|
| Fam162a | ↑ | Hk2 | ↑ | Ccnd2 | ↑ |
| Vegfa | ↑ | Pgam1 | ↑ | Ccne1 | ↑ |
| Ddit3 | ↑ | Aldoc | ↑ | Bbc3 | ↑ |
| Snca | ↑ | Pfkl | ↑ | Perp | ↓ |
| Mt1 | ↑ | Tpi1 | ↑ | Igfbp3 | ↑ |
| Sncb | ↑ | Slc2a1 | ↑ | Gtse1 | ↑ |
| Wfs1 | ↑ | Aldoa | ↑ | Pmaip1 | ↑ |
| Bnip3 | ↑ | Pkm | ↑ | Pidd1 | ↑ |
| Ddit4 | ↑ | Pgk1 | ↑ | Sesn2 | ↑ |
| Slc7a11 | ↑ | Ldha | ↑ | Ccnd3 | ↑ |
| Eno1 | ↑ | Gadd45a | ↑ |
Table 2: Regulation of genes associated with neuronal death, energy metabolism and the p53 pathway. Specific genes identified from within the gene ontology enrichment analysis for the DiV 3 and 6 overlapping data set (neuronal death and glycolysis and gluconeogenesis) and the DiV 6 data set (p53 pathway). Upward arrows indicate an increased expression in mDRG neurons cultured in the absence of neurotropic B vitamins compared to optimal medium. Downward arrows indicate decreased expression in mDRG neurons cultured in the absence of neurotropic B vitamins compared to optimal medium. DiV, days in vitro; mDRG, mouse dorsal root ganglion.
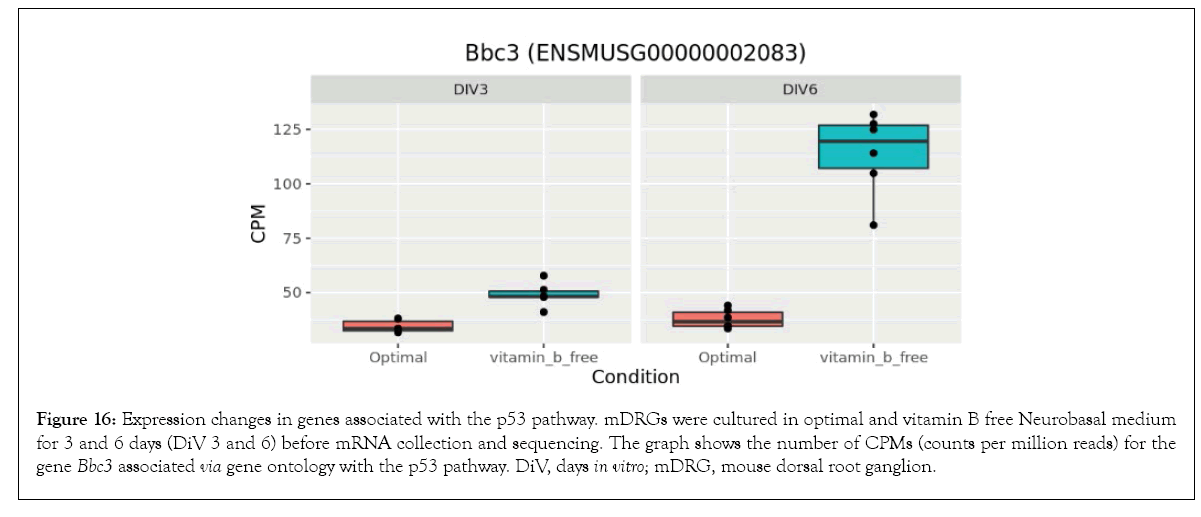
Figure 16: Expression changes in genes associated with the p53 pathway. mDRGs were cultured in optimal and vitamin B free Neurobasal medium for 3 and 6 days (DiV 3 and 6) before mRNA collection and sequencing. The graph shows the number of CPMs (counts per million reads) for the gene Bbc3 associated via gene ontology with the p53 pathway. DiV, days in vitro; mDRG, mouse dorsal root ganglion.
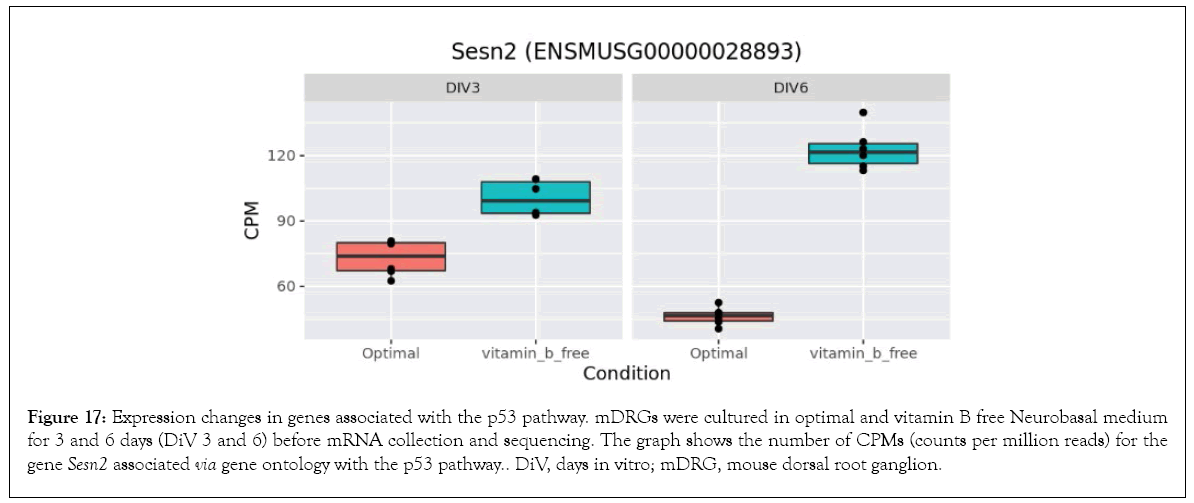
Figure 17: Expression changes in genes associated with the p53 pathway. mDRGs were cultured in optimal and vitamin B free Neurobasal medium for 3 and 6 days (DiV 3 and 6) before mRNA collection and sequencing. The graph shows the number of CPMs (counts per million reads) for the gene Sesn2 associated via gene ontology with the p53 pathway. DiV, days in vitro; mDRG, mouse dorsal root ganglion.
Mouse DRG axonal outgrowth showed a clear dependency on the continued presence of the neurotropic vitamins B1, B6, and B12. During the initial first 3 days of culturing prior removal of the neurotropic B vitamins, no significant effect on the rate of axonal outgrowth was seen. However, from 3 days onwards, a progressive slowing in the rate of outgrowth was observed and this was accompanied by perturbations in the beta-tubulin microtubular network in the axons and degeneration of cell bodies. Here, it should be stated that the mDRG culture system represents a simplified model to investigate the effects of B vitamin depletion. Importantly, this model enables the investigation of direct effects of B vitamin depletion on neurons; however, the culture system lacks the complexity seen within the CNS and PNS and will not take into account effects of B vitamin depletion on e.g. astrocytes, microglia, or the maintenance of myelin sheaths to support action potential propagation along axons. However, although the roles of individual B vitamins (B1, B6 and B12) were not tested in this current study, there is significant literature evidence from animal studies and different culture models which suggest that individual deficiencies of these neurotropic B vitamins negatively impact nerve health. Hence, vitamin B1 deficiency leads to the generation of Reactive Oxygen Species (ROS) and results in severe inefficiencies in mitochondrial function leading to selective neuronal cell death [19] and induces an Endoplasmic Reticulum (ER) stress response in rodent neurons [20] and in human induced Pluripotent Stem Cell (iPSC) derived neurons [21]. Similar effects of vitamin B1 deficiency, otherwise known as Thiamine Deficiency (TD), have also been noted in vivo [4]. Here, animal models have shown a close relationship between TD, oxidative stress and the initiation of neurodegenerative changes [28–30]. TD-induced oxidative stress in rats leads to the accumulation of a thiamine diphosphate oxidized inactive form [28], and findings in thiamine deficient rodents suggest that increased formation of free radicals during acute symptomatic stages of TD and increased lactic acidosis and extracellular glutamate concentrations may contribute to neural tissue lesions and structural nerve damage [30,31]. Although the method of vitamin B depletion in this current study differs from these reports (removal of B vitamins from the culture medium as opposed to inhibiting vitamin B1 uptake using amprolium), it seems likely that similar pathways will be involved, namely: 1) mitochondrial impairment leading to a decreased axonal outgrowth, 2) oxidative and ER stress, resulting in induction of genes associated with the Unfolded Protein Response (UPR), and 3) apoptosis [4,20,21]. In respect of vitamin B6, data from animal studies demonstrate that pyridoxine deficiency facilitates neuronal death in the hippocampus by significantly increasing homocysteine levels in the serum and lipid peroxidation in the brain and reducing proliferating cells and neuroblasts [32,33], leads to significantly lower GABA levels leading to neuronal damage [34] and enhances noradrenergic signalling resulting in behavioural impairments [35]. In animal studies, vitamin B12 deficiency shows a loss of myelin in the axonal tracts with inflammation [36] and supplemented vitamin B12 plays a protective role against the axonal degeneration and subsequent loss of myelinated fibres [37].
In a N1E-115 dopaminergic cell model, it has been demonstrated that vitamin B12 deficiency activates endoplasmic reticulum stress pathways with increased pro-apoptotic markers and decreases cellular proliferation through reduced expression of SIRT1, a transcription factor involved in fundamental cellular processes such as apoptosis, metabolism, differentiation and cell cycle arrest [38]. Therefore, although not tested in the current study, it seems likely that vitamins B1, B6, and B12 all play a significant role in maintaining a healthy nervous system.
Despite the interest in the role of vitamin B1 and other neurotropic B vitamins on neuronal health and the actual use of vitamin B1 deficiency treatments to model age-related neurodegenerative disorders [4], to the authors’ knowledge no systematic nonbiased approach has been performed to examine genome-wide expression changes occurring during periods of vitamin B1/B6/ B12 deficiency. In this current study, no effect on gene expression was observed by substantially reducing the concentrations of neurotropic B vitamins from optimal levels (B1: 40 µM, B6: 20 µM, B12: 0.4 µM) to minimal levels (B1: 0.1 µM, B6: 0.06 µM, B12: 0.5 nM) (Figure 8). In contrast, complete removal of neurotropic B vitamins led to widespread changes in gene expression both at DiV 3 and, to a greater extent, at DiV 6. Therefore, in agreement with the axonal outgrowth studies, complete removal of the neurotropic B vitamins was required to induce gene expression changes within the time frame examined in this current study. Important to the data obtained was that the cells grown for RNA deep sequencing did not show any overt signs of degeneration even after 6 days in vitamin B free media. This would imply that the gene expression changes observed here are not secondary to a late stage, unregulated, degeneration response but are instead related to the absence and gradual depletion of cellular levels of vitamins B1, B6, and B12.
Figure 18: Expression changes in genes associated with the p53 pathway. mDRGs were cultured in optimal and vitamin B free Neurobasal medium for 3 and 6 days (DiV 3 and 6) before mRNA collection and sequencing. The graph shows the number of CPMs (counts per million reads) for the gene Perp associated via gene ontology with the p53 pathway. DiV, days in vitro; mDRG, mouse dorsal root ganglion.
As discussed above, neurotropic B vitamins play an important role in metabolic pathways as cofactors and coenzymes [3,39] and, in the case of vitamin B1, to glucose metabolism in particular [4]. This may be key to the neurodegenerative effects of neurotropic B vitamin deficiency, as a reduction in glucose metabolism is apparent in neurodegenerative diseases [40] and in insulin deficiency diseases linked to cognitive impairment [41]. Supporting the link of B vitamins to metabolic and energetic pathways, this current study identified gene enrichment in numerous pathways associated with glycolysis, pyruvate metabolism, and the tricarboxylic acid (TCA) cycle. Of particular significance was the upregulation of Hexokinase 2 (Hk2) under the vitamin B free conditions. This gene is involved in the phosphorylation of glucose to glucose-6- phosphate, an initial rate limiting step in glycolysis. Upregulation of Hk2 promotes neuronal survival by enhancing glycolysis [42] and it therefore seems likely that the observed increase in Hk2 in this current study is a compensatory mechanism to counteract the reduction in glucose metabolism caused by vitamin B1 depletion. Similar increases in the glycolytic enzymes Aldoa and Aldoc plus other energy metabolism associated genes were also observed in the vitamin B free condition, suggesting that vitamin B depletion may induce a general upregulation of neuronal energy metabolism.
In vitro studies identified an activation of caspase-dependent apoptotic pathways as being responsible for neuronal cell death in response to vitamin B1 depletion [20]. Therefore, identification of gene expression changes associated with neurodegeneration and in particular those associated with apoptosis may prove important for identifying key upstream regulators of this process. As indicated in Tables 1 and 2, a number of genes associated with neurodegeneration are upregulated in response to neurotropic B vitamin withdrawal. Of particular note in this set is Bnip3, a member of the pro-apoptotic BH3-only domain family of BCL2 proteins. Upregulation of this protein during periods of hypoxia has been shown to induce mitochondrial permeability transition and neuronal cell death in mouse primary neurons [43]. The enhanced Bnip3 expression appears to be caused by an increased activity of the transcription factors FoxO and HIF-1 α, which leads to an increase in Bnip3 in the mitochondrial outer membrane [43]. The progressive accumulation of Bnip3 seen in this current study is therefore likely to drive mDRGs towards a pro-apoptotic phenotype. In addition, our data indicates the involvement of other pro-apoptotic signalling pathways. Firstly, Fam162a, a known hypoxia-induced gene [44] which encodes the protein HGTD, is upregulated at 3 and 6 days. HGTD is a pro-apoptotic protein which localises to the mitochondrial membrane and induces mitochondrial membrane permeability transition [44]. Secondly, Ddit 3, a known key mediator of the ER stress response [45], is upregulated at 3 days and more strongly at 6 days. Under periods of ER stress, Ddit3, a transcription factor also known as CHOP, downregulates pro-survival BCL2 proteins and upregulates expression of the pro-apoptotic protein BIM, thereby causing mitochondrial permeabilisation [46]. In models of optic nerve injury, Ddit3 appears to drive retinal ganglion cell death [47]. Therefore, the data presented here suggests that depletion of the neurotropic B vitamins activates multiple nodes within the apoptotic cell death pathway, and these factors may ultimately contribute to the demise of the mDRG neurons.
At the 6 day time-point, our data also demonstrated enrichment in the p53 signalling pathway. The protein p53 is a regulator of transcription, most notably as a tumour suppressor via the induction of pro-apoptotic programs [48]. However, p53 and associated pathways are now recognised to be involved in multiple neuronal cell death pathways [49]. Upon B vitamin depletion in this current study, differential effects on pro-apoptotic p53-regulated genes were observed. Perp (p53 apoptosis effector related to PMP22) was downregulated (Figure 18), whilst Bbc3 (BCL2 binding component 3), (Figure 16) and Pmaip1 (phorbol-12-myristate-13-acetate-induced protein 1, not shown) were upregulated in cells treated with vitamin B free medium. Therefore, the response to B vitamin depletion appears complex in this gene set, and it may be the resulting balance of pro-survival and pro-death pathways which ultimately decides the fate of individual cells. In support of this, Sesn2 (Sestrin 2), a pro-survival protein known to be upregulated in response to hypoxia, energy deficiency and ER stress is also upregulated in this current study in cells grown in the absence of B vitamins (Figure 17) and may therefore be a mechanism to reduce the harmful effect of vitamin B depletion [50].
Enrichment analysis highlighted a number of genes and potential pathways involved in the neurotropic vitamin B depletion response in mDRG neurons. These include a number of genes associated with neurodegeneration and apoptosis. Pro-survival pathways, including a widespread upregulation of genes associated with energy metabolism, were also activated during vitamin B depletion presumably as compensatory mechanisms. Therefore, a complex interplay between pro-survival and pro-death pathways appears to be responsible for ultimately determining the fate of the neurons. In this current study, no detailed mechanistic analysis has been done to clarify the effect of each individual neurotropic B vitamin on gene expression and nerve degeneration. However, our data suggests that this would be an interesting area for further investigation in order to identify which combination of these genes is critical for determining the fate of these neurons during periods of B vitamin depletion.
In summary, our results demonstrated that the absence of neurotropic B vitamins (B1, B6, B12) results in a timedependent slowing of axonal growth followed by a progressive neurodegeneration of primary cultures of mDRG neurons and is a driver of differential gene expression. The time of onset of the degeneration response varied between cultures but appeared to begin 3-4 days after B vitamin removal. Our findings present for the first time a systematic non-biased approach to examine genome-wide expression changes occurring during periods of B vitamin deficiency. These data identified gene expression changes and the involvement of pathways potentially linked to mDRG neurodegeneration occurring in response to depletion of neurotropic B vitamins and activation of certain pro-survival pathways, presumably as compensatory mechanisms. Therefore, depletion of neurotropic B vitamins appears to initiate a complex gene expression profile which ultimately determines the fate of the neurons.
The authors would like to thank Markus Ketelhot and Christina Gabrysiak (Evotec SE) for sharing their expertise with mDRG culture techniques.
This work was funded by P&G Health Germany GmbH. P&G Health was involved in the study design, interpretation of data, writing of the report and the decision to submit the article for publication.
The authors of Evotec SE, Kenneth W. Young, Niels Banek, Leonie Martens, Natalie Daluege, Nikisha Carty, Sebastian Schmeier including Markus Ketelhot and Christina Gabrysiak declare no competing interest. With competing interests Oltea Trutz and Patrizia Bohnhorst who are employees of P&G Health Germany GmbH.
[CrossRef] [Google Scholar] [PubMed]
[CrossRef] [Google Scholar] [PubMed]
[CrossRef] [Google Scholar] [PubMed]
[CrossRef] [Google Scholar] [PubMed]
[CrossRef] [Google Scholar] [PubMed]
[CrossRef] [Google Scholar] [PubMed]
[CrossRef] [Google Scholar] [PubMed]
[CrossRef] [Google Scholar] [PubMed]
[CrossRef] [Google Scholar] [PubMed]
[CrossRef] [Google Scholar] [PubMed]
[CrossRef] [Google Scholar] [PubMed]
[CrossRef] [Google Scholar] [PubMed]
[CrossRef] [Google Scholar] [PubMed]
[CrossRef] [Google Scholar] [PubMed]
[Google Scholar] [PubMed]
[CrossRef] [Google Scholar] [PubMed]
[CrossRef] [Google Scholar] [PubMed]
[CrossRef] [Google Scholar] [PubMed]
[CrossRef] [Google Scholar] [PubMed]
[CrossRef] [Google Scholar] [PubMed]
[CrossRef] [Google Scholar] [PubMed]
[CrossRef] [Google Scholar] [PubMed]
[CrossRef] [Google Scholar] [PubMed]
[CrossRef] [Google Scholar] [PubMed]
[CrossRef] [Google Scholar] [PubMed]
[CrossRef] [Google Scholar] [PubMed]
[CrossRef] [Google Scholar] [PubMed]
[CrossRef] [Google Scholar] [PubMed]
[CrossRef] [Google Scholar] [PubMed]
[CrossRef] [Google Scholar] [PubMed]
[CrossRef] [Google Scholar] [PubMed]
[CrossRef] [Google Scholar] [PubMed]
[CrossRef] [Google Scholar] [PubMed]
[CrossRef] [Google Scholar] [PubMed]
[CrossRef] [Google Scholar] [PubMed]
[CrossRef] [Google Scholar] [PubMed]
[CrossRef] [Google Scholar] [PubMed]
[CrossRef] [Google Scholar] [PubMed]
[CrossRef] [Google Scholar] [PubMed]
[CrossRef] [Google Scholar] [PubMed]
[CrossRef] [Google Scholar] [PubMed]
[CrossRef] [Google Scholar] [PubMed]
[CrossRef] [Google Scholar] [PubMed]
[CrossRef] [Google Scholar] [PubMed]
[CrossRef] [Google Scholar] [PubMed]
[CrossRef] [Google Scholar] [PubMed]
[Google Scholar] [PubMed]
[CrossRef] [Google Scholar] [PubMed]
Citation: Banek N, Martens L, Daluege N, Carty N, Schmeiera S, Trutzb O, et al. (2022) Transcriptome Changes and Neuronal Degeneration in an In Vitro Model of B Vitamin Depletion. Int J Phys Med Rehabil.S18.001.
Received: 12-Jul-2022, Manuscript No. JPMR-22-18327; Editor assigned: 15-Jul-2022, Pre QC No. JPMR-22-18327 (PQ); Reviewed: 04-Aug-2022, QC No. JPMR-22-18327; Revised: 11-Aug-2022, Manuscript No. JPMR-22-18327 (R); Published: 22-Aug-2022 , DOI: 10.35248/2329-9096.22.S18.002
Copyright: © 2022 Banek N, et al. This is an open-access article distributed under the terms of the Creative Commons Attribution License, which permits unrestricted use, distribution, and reproduction in any medium, provided the original author and source are credited.
Sources of funding : This work was funded by P&G Health Germany GmbH. P&G Health was involved in the study design, interpretation of data, writing of the report and the decision to submit the article for publication.