
Journal of Clinical and Cellular Immunology
Open Access
ISSN: 2155-9899

ISSN: 2155-9899
Research Article - (2020)Volume 11, Issue 1
The Hippo pathway plays a regulatory role on inflammation and cell death and proliferation. Here we described a relationship between Hippo pathway components and inflammation in healthy subjects. The plasma levels of cytokines and chemokines were used to define their inflammatory profile and classify them as normal, high and low producers of cytokines. Leukocytes from healthy subjects with inflammatory profile expressed the highest levels of MSTS1/MST2, SAV1, LATS1/LATS2, MOB1A/MOB1B and YAP genes. The group that overexpressed Hippo pathway-related genes secreted more IFN-ϒ and IFN-α2.
Hippo pathway; Inflammatory process; Healthy subjects; Cytokines; Chemokines
IL: Interleukin; IFN: Interferon; LATS1/LATS2: Large tumor suppressor kinase 1/2; MCP-1: Monocyte chemoattractant protein-1; MIP: Macrophage inflammatory protein; MOB1A/ MOB1B: MOB kinase activator 1A/1B; MST1/MST2: Mammalian STE20-like protein kinase 1/2; SAV1: Protein salvador homolog 1, TAZ: Tafazzin protein; TEAD: TEA domain transcription; TGF-β: Transforming growth factor β; TNF-α: Tumor necrosis factor α; TLR: Toll-like receptor; YAP: Yesassociated protein.
The Hippo signaling pathway mediates tumor suppression and regulation of cell cycle and apoptosis. This pathway was first reported on Drosophila melanogaster, and it is also present and well-conserved in mammals [1], in which it is finely regulated by numerous signals – named as regulatory components – that mediate activation or inhibition, such as cell polarity, cell-cell contact, oxidative stress, and some hormones like insulin, glucagon, epinephrine, and follicle-stimulating hormone [2-9].
are MST1/MST2 kinases (mammalian STE20-like protein kinase 1/2) and their adapter protein SAV1 (protein salvador homolog 1), LATS1/LATS2 kinases (large tumor suppressor kinase 1/2) and their adapter proteins MOB1A/MOB1B (MOB kinase activator 1A/1B), and the transcription coactivators YAP (yes-associated protein) and TAZ (tafazzin protein). Activation of this pathway is marked by regulatory signals that modulate phosphorylation of MST1/MST2 and SAV1. The active form of MST1/MST2 phosphorylates and activates LATS1/LATS2 and MOB1A/ MOB1B. The active form of LATS1/LATS2 phosphorylates and activates YAP and TAZ that interact with the protein complex 14.3.3 in cytoplasm; such interaction retains YAP and TAZ in the cytoplasm and degrades them by ubiquitination (Figure 1) [2,10]. When the Hippo pathway is inactive, YAP and TAZ migrate to the cell nucleus and mainly interact with the TEAD1-4 (TEA domain transcription) family transcription factors that activate expression of target genes that control cell proliferation and resistance to cell death, such as AXL (AXL receptor tyrosine kinase), BIRC5 (baculoviral IAP repeat containing 5), CTGF (connective tissue growth factor), CYR61 (cysteine-rich angiogenic inducer 61), FGF1 (fibroblast growth factor 1), GLI2 (GLI family zinc finger 2), IGFBP3 (insulin-like growth factor binding protein 3), and ITGB2 (integrin subunit β2) (Figure 1) [10,11].
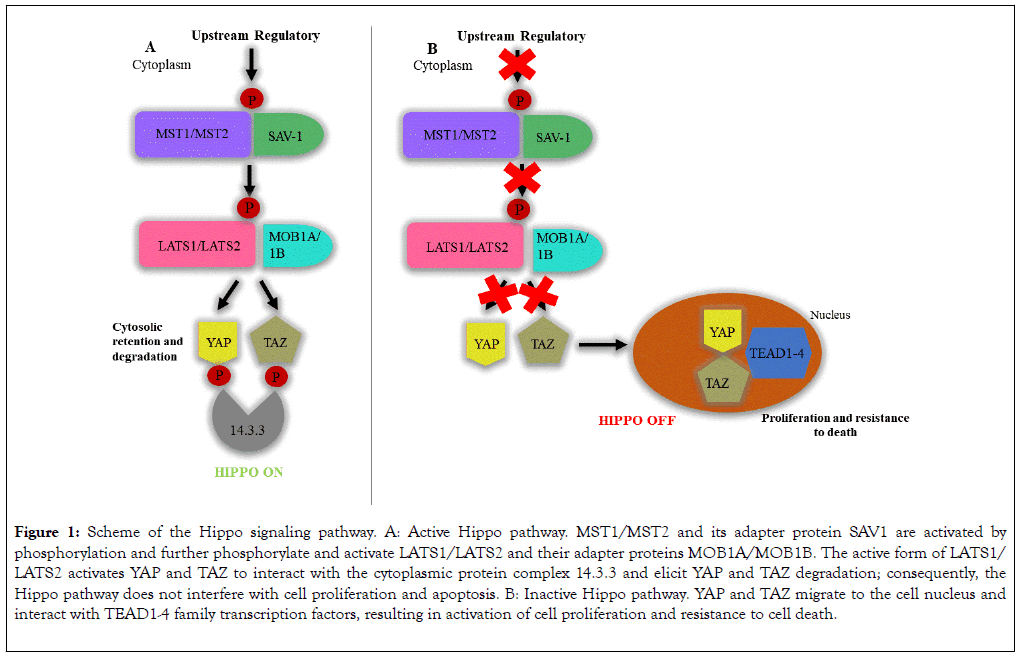
Figure 1. Scheme of the Hippo signaling pathway. A: Active Hippo pathway. MST1/MST2 and its adapter protein SAV1 are activated by phosphorylation and further phosphorylate and activate LATS1/LATS2 and their adapter proteins MOB1A/MOB1B. The active form of LATS1/ LATS2 activates YAP and TAZ to interact with the cytoplasmic protein complex 14.3.3 and elicit YAP and TAZ degradation; consequently, the Hippo pathway does not interfere with cell proliferation and apoptosis. B: Inactive Hippo pathway. YAP and TAZ migrate to the cell nucleus and interact with TEAD1-4 family transcription factors, resulting in activation of cell proliferation and resistance to cell death.
Hence, when the Hippo pathway is inactive, the YAP and TAZ availability in the cell nucleus increase to promote transcription of anti-apoptotic genes and genes that control cell proliferation. Such deregulation is found in neoplasias [10,12]. In addition to participating in the control of cell life and death, the Hippo pathway seems to play relevant roles on inflammatory processes, as well as on downmodulation of T-cells in viral, bacterial, and fungal infections [13-16] and autoimmune processes [17]. Participation of the Hippo pathway in the immune response is illustrated in the report that MST1/MST2 deficiency in mice cause hypoplasia of lymphoid organs and deficient migration of T-cells [17,18]. In addition, MST1 and MST2 can be activated by Toll-like receptors (TLR) viathe MyD88 (Mycobacterium tuberculosis)-dependent pathway during Escherichia coli infection, resulting in increased production of reactive oxygen species and bactericidal activity of phagocytic cells [19].
MST1/MST2 can also mediate chemokine production. For instance, TLR2 is activated in inflammation during Mycobacterium tuberculosis infection of macrophages and elicits an immune response mediated by activation of IRAK-1/IRAK-4 (interleukin-1 receptor-associated kinase 1/4) kinases, which activate MST1/MST2; MST1/MST2, in its turn, modulate production of CXCL1/CXCL2 (C-X-C motif chemokine ligand 1/2) chemokines by stimulating IRF-3 (interferon regulatory factor 3) [20]. The relevance of such molecules to inflammation is clear in the report that MST2-knockout mice produce less proinflammatory cytokines and CCL2 (C-C motif chemokine ligand 2) chemokines in the retinal detachment inflammation model [21]. Peripheral T lymphocyte counts are decreased in healthy and LATS1/LATS2-double knockout mice when compared with wild-type mice [22]. Inflammatory cytokines like tumor necrosis factor α (TNF-α) and interleukin 1β (IL-1β) also elicit YAP/TAZ degradation in osteoarthritis [23] and dampen the interference of the Hippo pathway in transcription of important genes for cell proliferation and apoptosis.
The abovementioned reports evidence the interaction of the Hippo pathway proteins, MST1/MST2, LATS1/LATS2, and YAP/TAZ with the inflammatory process and function of effector cells of the immune response in different animal and disease models [13-23]. Considering the existence of a potential relationship between cytokines/chemokines and Hippo pathway components, the present study examined whether the cytokine production profile is associated with the expression levels of Hippo pathway components in healthy subjects.
All the subjects signed the informed consent form before blood collection. The Ethics Committee for Human Research of Faculdade de Ciências Farmacêuticas de Ribeirão Preto and Hospital das Clínicas da Faculdade de Medicina de Ribeirão Preto, Universidade de São Paulo, Ribeirão Preto, São Paulo, Brazil approved the study protocol (CAAE number 02515618.6.0000.5403).
Subjects
Leukocytes and plasma were obtained from peripheral blood of 33 healthy subjects – 42% men and 58% women – with ages ranging from 31 to 83 years (median of 56 years-old), and with no signs or symptoms of chronic diseases, neoplasms, autoimmune or infectious diseases at least two weeks before blood collection. All the subjects worked at the Ribeirão Preto Campus of the University of São Paulo, Brazil.
Blood samples
Peripheral blood was collected by venipuncture in the forearm of 33 healthy subjects, using EDTA tubes (Vacutainer®; Becton, Dickinson and Company). The plasma samples were obtained by centrifugation at 400 g for 10 min, at 4°C (Eppendorf 5810R Centrifugue) and the cell fraction was used to isolate leukocytes. The plasma samples were stored at -80 °C until analysis and the leukocytes were frozen in Trizol® solution (Invitrogen Life Technologies) for the gene expression assay.
Isolation of peripheral blood leukocytes
Leukocytes were isolated from peripheral blood using the Haes- Steril method (Voluven, Fresenius Kabi). Briefly, four parts of blood and one part of Haes-Steril solution were placed into a 50mL Falcon tube and allowed to stand for 90 min at room temperature for plasma decanting. After centrifugation at 400 g for 15 min, at room temperature, the leukocyte-rich supernatant layer was collected and suspended in phosphate buffer saline (PBS). An aliquot of cell suspension was mixed with 0.4% Trypan blue dye solution (Sigma-Aldrich) and counted in the Neubauer chamber to determine the cell viability. Ten million leukocytes were stored in Trizol® solution at -80°C until gene expression analyses.
RNA extraction and cDNA synthesis
Ten million leukocytes were lysed in Trizol® solution for RNA extraction. Ten μL of glycogen were added to the cell lysate, and The precipitate was washed with cold 70% ethanol solution and centrifuged at 12,000 g for 15 min, at 4°C. The supernatant was discarded and the samples were dried and suspended in RNAsefree water. The RNA concentration was quantified in the NanoVue Spectrophotometer (GE Healthcare) set at 260 nm.
The High Capacity Reverse Transcription Kit® (Applied Biosystems) was used for complementary DNA (cDNA) synthesis according to the manufacturer’s instructions. One μg of RNA was used for the cDNA synthesis under the conditions of 10 min at 25°C for annealing and 2 h at 37°C for extension.
Quantification of gene expression by real-time PCR
The StepOnePlus (ThermoFisher) apparatus was used to quantify the Hippo pathway gene expression. The qPCR reaction was prepared using the leukocyte cDNA samples and the TaqMan gene expression assay kit® (Applied Biosystems). The probes used for target gene quantification (Hippo pathway members) are listed in Table 1.
| Gene | Probes Code |
|---|---|
| MST1 | Hs00360684_m1 |
| MST2 | Hs00169491_m1 |
| SAV1 | Hs00560416_m1 |
| LATS1 | Hs00177987_m1 |
| LATS2 | Hs00324396_m1 |
| MOB1A | Hs00217172_m1 |
| MOB1B | Hs01397675_m1 |
| TAZ | Hs00794094_m1 |
| YAP | Hs00371735_m1 |
| GAPDH | Hs99999905_m1 |
| β-ACTIN | 4326315E |
Table 1: Target genes and probes used for quantification of gene expression by real-time PCR.
Quantification of cytokines and chemokines by the multiplex assay
The customized multiplex assay kit (16-plex, EMD Millipore Corporation) was used to quantify the plasma levels of GM-CSF (granulocyte-macrophage colony-stimulating factor), IFN (interferon)- α, IFN-ϒ, IL-1β, IL-4, IL-5, IL-6, IL-10, IL-12p70, IL-17A, IP-10 (interferon-inducible protein-10), MCP-1 (monocyte chemoattractant protein-1), MIP (macrophage inflammatory protein)-1α, MIP-1β, RANTES (regulated on activation, normal T cell expressed and secreted), and TNF-α. The fluorescence was recorded using a fluorescent bead-based plate reader (Luminex1 MAGPIX1 System; Luminex Corporation, TX, USA). Data were analyzed with the aid of the Milliplex Analyst software v3.5 (Millipore; VigeneTech Inc., Boston, MA, USA) and used to plot a three-parameter logistic curve.
Unsupervised clustering
Consensus Cluster Plus Bioconductor package was used to perform k-means clustering with euclidean distance metric and average linkage algorithm [24]. Thirty-three samples and 24 genes were used as input and K1 and K2 clusters were identified. The R package Complex Heatmap was used to visualize the data as a heat map [25].
Statistical analysis
The cytokine concentrations were used to calculate the 25 and 75 percentiles for each cytokine, using the software Prism 5.0 (GraphPad Software). The resulting percentile data were gathered in a diagram with black, gray, and white scale using Microsoft Excel (Microsoft Office 2016, Las Vegas, USA), where the colors respectively indicated that the concentration of a given cytokine was >75 percentile, < 25 percentile, and between 25 and 75 percentiles.
IFN-α2, IFN-ϒ, IL-1β, IL-6, IL-12p70, IL-17A, MCP-1, MIP-1α, MIP-1β and TNF-α [26–28] were considered as the most relevant inflammatory cytokines/chemokines in the set analyzed herein. The population of healthy individuals was divided in three groups according to the plasma levels of such most relevant cytokines: normal, low, and high producers. High producers had plasma concentrations of four or more inflammatory cytokines >75 percentile, while low producers had plasma concentrations of four or more inflammatory cytokines <25 percentile. All the subjects who did not fulfill these criteria were considered as normal producers, i.e. their plasma cytokine concentrations fitted the reference range between 25 and 75 percentiles.
The Mann-Whitney test was used to compare (i) The expression levels of Hippo pathway genes in normal, low, and high producers of cytokines; (ii) The plasma levels of cytokines, IFN- α2 and INF-ϒ between groups K1 and K2 (determined by the consensus clustering analysis). p<0.05 was considered as statistically significant.
Differential pro-inflammatory cytokine profiles in healthy subjects
To compare the cytokine production profile of the 33 subjects, data were gathered in a diagram with black (>75 percentile), gray (<25 percentile), and white scale (>25 and <75 percentile). The subjects were divided into three groups according to the plasma levels of the most relevant inflammatory cytokines (IFN-α2, IFN-ϒ, IL-1β, IL-6, IL-12p70, IL-17A, MCP-1, MIP-1α, MIP-1β, and TNF-α): 18 (54.5%), 6 (18.2%), and 9 (27.3%) subjects were classified as normal, low, and high producers of cytokines, respectively (Figure 2).
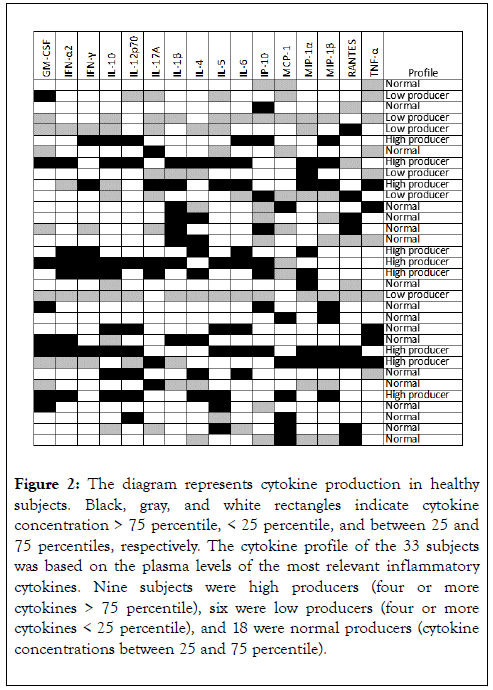
Figure 2. The diagram represents cytokine production in healthy subjects. Black, gray, and white rectangles indicate cytokine concentration > 75 percentile, < 25 percentile, and between 25 and 75 percentiles, respectively. The cytokine profile of the 33 subjects was based on the plasma levels of the most relevant inflammatory cytokines. Nine subjects were high producers (four or more cytokines > 75 percentile), six were low producers (four or more cytokines < 25 percentile), and 18 were normal producers (cytokine concentrations between 25 and 75 percentile).
High producers of cytokines exhibit increased expression of LATS1/LAT2, MOB1A/MOB1B, MST1/MST2, SAV1 and YAP
Leukocytes isolated from peripheral blood of high producers of cytokines exhibited increased expression of the gene MST1 when compared with leukocytes from low (p=0.0406) and normal producers (p=0.0027). Leukocytes from high producers had increased expression of the genes LATS1, LATS2, MOB1A, MOB1B, MST2, SAV1, and YAP than leukocytes from normal producers (p=0.0027, p=0.0335, p=0.0263, p=0.0091, p=0.0472, p=0.0232, and p=0.0376, respectively) (Figure 3 and Table 2).
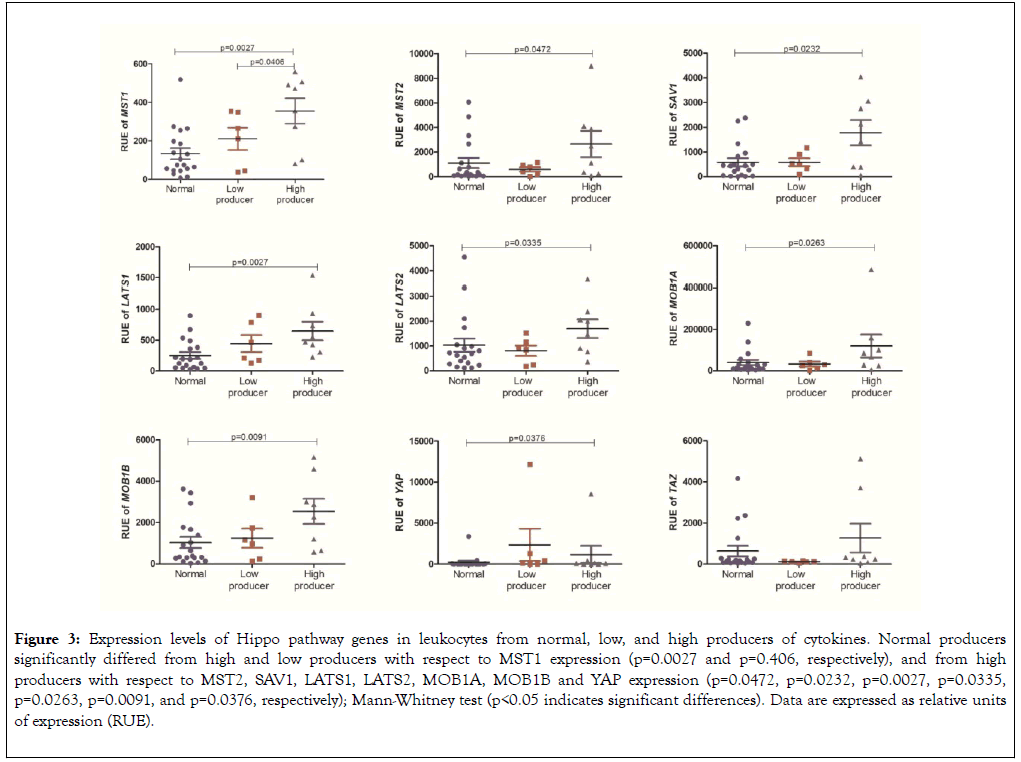
Figure 3. Expression levels of Hippo pathway genes in leukocytes from normal, low, and high producers of cytokines. Normal producers significantly differed from high and low producers with respect to MST1 expression (p=0.0027 and p=0.406, respectively), and from high producers with respect to MST2, SAV1, LATS1, LATS2, MOB1A, MOB1B and YAP expression (p=0.0472, p=0.0232, p=0.0027, p=0.0335, p=0.0263, p=0.0091, and p=0.0376, respectively); Mann-Whitney test (p<0.05 indicates significant differences). Data are expressed as relative units of expression (RUE).
| Gene | Normal producer (a) | Low producer (b) | High producer (c) | p value (a × b) | p value (a × c) | p value (b × c) |
|---|---|---|---|---|---|---|
| Median | ||||||
| MST1 | 74.57 | 238.6 | 414.2 | 0.1327 | 0.0027 | 0.0406 |
| MST2 | 163.6 | 601.4 | 1792 | 0.2943 | 0.0472 | 0.1142 |
| SAV1 | 437.8 | 513.4 | 1776 | 0.1781 | 0.0232 | 0.1142 |
| LATS1 | 188.1 | 340.1 | 510.3 | 0.0674 | 0.0027 | 0.1412 |
| LATS2 | 688 | 867.7 | 1734 | 0.4119 | 0.0335 | 0.0539 |
| MOB1A | 20043 | 27965 | 76162 | 0.3396 | 0.0263 | 0.1142 |
| MOB1B | 380.9 | 1074 | 2576 | 0.3166 | 0.0091 | 0.0906 |
| YAP | 9.353 | 287.2 | 91.65 | 0.0857 | 0.0376 | 0.3773 |
| TAZ | 160.2 | 111.4 | 282.8 | 0.1781 | 0.1161 | 0.0539 |
Table 2: Comparative analysis of the expression levels of Hippo pathway genes in normal, low, and high producers of cytokines. High producers had leukocyte MST1 expression levels greater than those of low and normal producers, as well as MST2, SAV1, LATS1, LATS2, MOB1A, MOB1B and YAP expression levels greater than those of normal producers.
Subjects who overexpress Hippo-related genes have high plasma levels of IFN-ϒ and IFN-α2
We used data from quantification of plasma cytokines and gene expression in leukocytes to perform clusterization analysis by Heatmap. This analysis split the healthy subjects into two groups: K1 (Hippo Low expression) composed of 25 subjects (indicated in the left lower corner) and K2 (Hippo High expression) composed of 8 subjects (indicated in the right lower corner). Based on clusterization analysis, groups K1 and K2 had similar plasma levels of the anti-inflammatory cytokines IL-4 and IL-10 (Figure 4). Compared with group K1, group K2 had increased expression levels of Hippo pathway genes and increased plasma levels of IFN-γ and IFN-α2 (Figures 4 and 5).
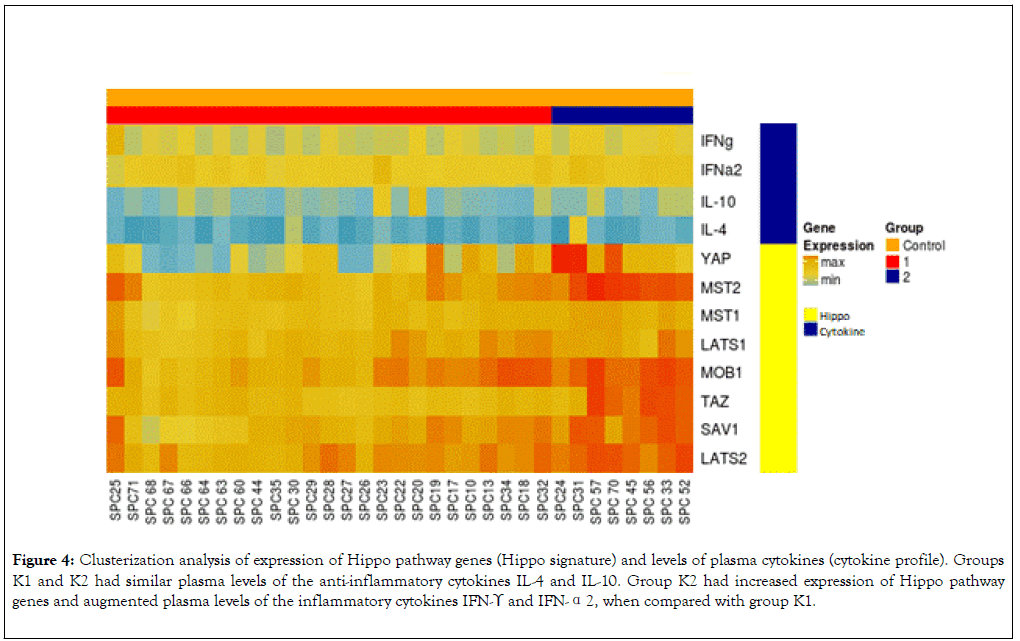
Figure 4. Clusterization analysis of expression of Hippo pathway genes (Hippo signature) and levels of plasma cytokines (cytokine profile). Groups K1 and K2 had similar plasma levels of the anti-inflammatory cytokines IL-4 and IL-10. Group K2 had increased expression of Hippo pathway genes and augmented plasma levels of the inflammatory cytokines IFN-ϒ and IFN-α2, when compared with group K1.
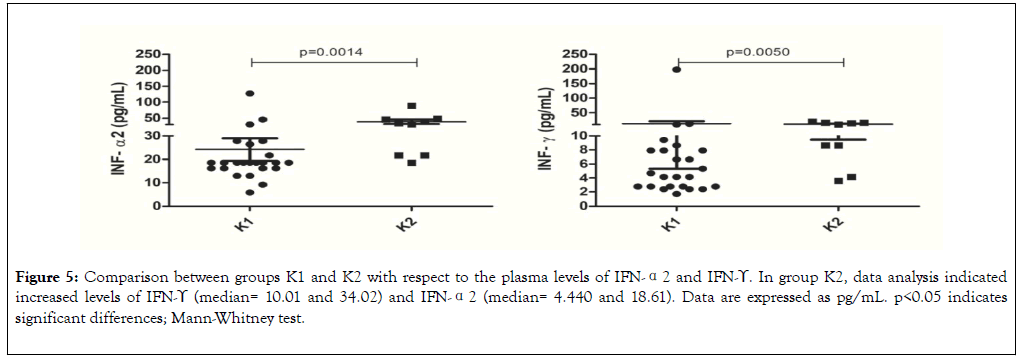
Figure 5. Comparison between groups K1 and K2 with respect to the plasma levels of IFN-α2 and IFN-ϒ. In group K2, data analysis indicated increased levels of IFN-ϒ (median= 10.01 and 34.02) and IFN-α2 (median= 4.440 and 18.61). Data are expressed as pg/mL. p<0.05 indicates significant differences; Mann-Whitney test.
Considering that the Hippo pathway seems to regulate inflammation, this study aims to address whether it participates in the production of inflammatory cytokines and chemokines in healthy subjects. Some research groups have reported that healthy subjects may display an inflammatory profile, but they did not investigate whether it was associated with increased gene expression of Hippo pathway components [29-31].
In healthy subjects, the inflammatory markers C-reactive protein, fibrinogen, and white blood cell counts are positively associated with the plasma metabolites cortisol, pregnanediol glucuronide and lactate, respectively [29]. The dissaccharide 3’- sialyllactose is an urine metabolite positively associated with the three inflammatory markers in healthy subjects [29]. Subjects who were apparently healthy and self-evaluated their health conditions as excellent had high levels of C-reactive protein [30]. Serum levels of IL-17 and eotaxin in healthy subjects tend to increase as a function of age [31]. The findings of the present study indicate that the inflammatory profile of healthy subjects is also related to the increased expression of Hippo pathway genes.
The Hippo signaling pathway plays a vital role in the control of cell proliferation, differentiation, and survival processes [32–34]. The MST1 gene is a key member of the Hippo pathway that is widely expressed in human cells [35]. MST1 is located at chromosome 20q11 [36], while MST2 is located at chromosome 8q22.2 in humans [37]. The lack of MST1 gene expression is associated with immunodeficiency and increased susceptibility to bacterial, fungal, and viral infections. Patients with MST1 dysfunction have deficient T-cell maturation, traffic, responsiveness, and viability [16,38-40].
MST1/MST2 participate in innate immune response against bacteria and viruses through phagocytosis and production of reactive oxygen species and cytokines [41]. MST1/MST2- deficient mice undergoing lipopolysaccharide-induced endotoxemic shock are more susceptible to death [42], indicating that such proteins participate in macrophagemediated immune response. MST1 gene-knockout mice have decreased T-cell proliferation and IL-12 production and increased T-cell apoptosis [43]. MST1 phosphorylation levels are augmented in brain tissues of rats with neuron death and inflammatory reaction [44]. Knocking-out the MST1 gene in the same experimental model lowers the inflammation level [44]. In addition, the double MST1 and MST2 knockout in hepatocytes induces tumorigenesis, MCP-1 expression, and infiltration of M1 and M2 macrophages [45]. In a murine model of Helicobacter pylori infection, MST1-deficient neutrophils do not migrate to inflamed muscle venules, suggesting that MST1 also participates in neutrophil migration [46]. Altogether, these reports indicate that MST1/MST2 play important roles in the physiological immune function and in the inflammatory response. Our findings demonstrated that high producers of cytokines had increased expression of MST1 and MST2 genes when compared with normal producers, corroborating literature data about the relationship between MST1 and MST2 and the inflammatory response.
SAV1 is the adapter protein of MST1/MST2 codified by the SAV1 gene located at chromosome 14 (14q22.1). The literature reports that SAV1 is related to gene suppression in neoplasias but not to inflammation. SAV1 is down regulated in high-grade clear cell renal carcinoma [47], pancreatic ductal adenocarcinoma [48], and rectal colon cancer [49]. Our findings suggest that SAV1 is associated with inflammatory processes because SAV1 gene expression was increased in high producers of cytokines, as compared with normal producers.
In addition to MST1 and MST2, the components LATS1 and LATS2 are kinases codified by tumor suppressor genes located at chromosomes 6q25.1 and 13q12.11, respectively [50]. Tumor cells present in three murine models – B16-OVA melanoma, SCC7 head and neck squamous cell cancer, and 4T1 breast cancer – isolated from LATS1/LATS2-double knockout mice secrete high amounts of nucleic acid-rich extracellular vesicles that trigger signaling vianucleic acid-sensitive TLRs, which elicit production of type I IFN (IFN-α and IFN-β). Such response stimulates antigen cross-presentation, dendritic cell maturation, and expansion of T-cytotoxic lymphocyte population. In contrast to what was expected, these cells had weak tumorigenic capacity in LATS1/LATS2 knockout mice when compared with wild-type mice [51], indicating that the immune response overcomes the tumor potential [51,52], and that LATS1 and LATS2 gene knockout induces an inflammatory response. The fact that the increased LATS1 and LATS2 gene expression correlated with the enhanced production of proinflammatory cytokines and chemokines in the present study indicates that the inflammatory roles that LATS1 and LATS2 play vary across the cell type, especially whether they are tumor or healthy cells.
The increased production of IL-6 and TNF-α in LATS1- deficient peritoneal macrophages exposed to the oligodeoxynucleotide CpG indicates that LATS1 down modulates production of these cytokines [53]. There is a new signaling pathway between LATS1 and TGF-β (transforming growth factor β) in mammary epithelial cells, in which LATS1 suppresses TGF-β-induced transcription and cell cycle arrest, and TGF-β induces LATS1 degradation vianegative feedback [54]. These reports are not in line with our findings that leukocytes from high producers of cytokines expressed LATS1 more strongly than the normal producers, indicating that LATS1 play other roles in the inflammatory process.
The adapter proteins from LATS1/LATS2 and MOB1A/ MOB1B are codified by the genes MOB1A and MOB1B located at chromosomes 2 (2p13.11) and 4 (4q13.3), respectively [55]. Such proteins act on cell division and are essential for centriole re-joining after telophase in HeLa cells [56]. Treatment with a TGF-β inhibitor restores cell differentiation in intestinal secretory cells from MOB1A/MOB1B-double knockout mice with defective cell differentiation, indicating that MOB1A/ MOB1B regulate TGF-β signaling [57]. To date, there are few reports on the relationship between MOB1A/MOB1B and inflammation. Our data demonstrated that the MOB1A and MOB1B genes were more strongly expressed in high producers of cytokines than in normal producers, suggesting that these genes are related to inflammation.
The YAP1 gene that codifies the protein YAP1 is located at chromosome 11 (11q13) [58]. Migration of U937 macrophages is increased towards three tumor liver cell lines – HepG2, Bel-7402 and SMMC-7721 – that express high levels of YAP, as demonstrated using a co-culture technique. It is possible that IL-6 released by tumor cells induces macrophage recruitment through activation of the STAT3 (signal transducer and activator of transcription 3) pathway [59]. YAP¬-knockout MDA-MB-231 breast cancer cells can mitigate IL-6-induced migration and invasion of malignant cells [60]. Although literature reports have suggested that YAP is related to the inflammatory process in cancer, our findings indicate that YAP can also act on inflammatory processes in healthy subjects.
The present study found that healthy subjects who expressed Hippo pathway genes the most strongly also released the highest amounts of the inflammatory cytokines IFN-ϒ and IFN-α2, which are important to control tumor growth and fight against intracellular pathogens [61]. Several authors have reported the role that the two cytokines play in the physiopathology of different diseases, but not in healthy subjects. These molecules play relevant roles in viral infections by human immunodeficiency virus [62], human papillomavirus virus [63], hepatitis B virus [63], and hepatitis C virus [64], in bacterial infections by Listeria monocytogenes [65] and Mycobacterium [66], and in cancer such as breast [67], hepatocellular [68], and colorectal cancer [69]. IFN-ϒ raises the levels of Daxx (deathassociated protein 6) in rat microglia; Daxx complexes with the Hippo pathway component MST1 to promote its homodimerization and activation [70], indicating that MST1 mediates IFN-ϒ-induced apoptosis in microglia.
In summary, the present study demonstrated that healthy subjects who expressed Hippo pathway genes the most strongly produced more IFN-ϒ and IFN-α2, indicating that high expression of Hippo pathway components can be associated with production of these cytokines in healthy subjects. Considering the aforementioned report on the relationship between MST1 and Daxx [70], we hypothesize that activation of Hippo pathway components are associated with the effect of these cytokines on the activation of other proteins like Daxx. Our findings point to the existence of an interaction between the inflammatory cytokines IFN-ϒ and IFN-α2 and expression of the Hippo pathway genes under physiological conditions.
Healthy subjects differentially express genes encoding Hippo pathway components. High expression levels of Hippo pathway genes are associated with high plasma levels of the cytokines IFN-ϒ and IFN-α2. High producers of inflammatory cytokines express the genes MST1, MST2, SAV1, LATS1, LATS2, MOB1A, MOB1B, and YAP more strongly than normal producers of cytokines.
Disclosure
The authors have no conflicts of interest to disclose.
Acknowledgment
The authors thank to the Brazilian funding agencies São Paulo Research Foundation (FAPESP; grants n. 2014/04234-9, 2018/01756-5, 2018/00583-0, 2018/19714-7, 2019/14928-1 and 2020/01650-2), the National Council for Scientific and Technological Development (CNPq), and Coordination for the Improvement of Higher Education Personnel (Capes; Financing Code 001).
Citation: Sciescia B, Tognon R, Nunes NS, Malta TM, Frantz FG, Castro FA, et al. (2020) Type I and II Interferon are Associated with High Expression of the Hippo Pathway Family Members. J Clin Cell Immunol. 10:585. doi: 10.35248/2155-9899.20.11:585.
Received: 20-Jan-2020 Accepted: 04-Feb-2020 Published: 11-Feb-2020 , DOI: 10.35248/2155-9899.20.11.585
Copyright: © 2020 Sciescia B, et al. This is an open-access article distributed under the terms of the Creative Commons Attribution License, which permits unrestricted use, distribution, and reproduction in any medium, provided the original author and source are credited.
Sources of funding : The authors thank to the Brazilian funding agencies São Paulo Research Foundation (FAPESP; grants n. 2014/04234-9, 2018/01756-5, 2018/00583-0, 2018/19714-7), the National Council for Scientific and Technological Development (CNPq), and Coordination for the Improvement of Higher Education Personnel (Capes; Financing Code 001).