Fisheries and Aquaculture Journal
Open Access
ISSN: 2150-3508
ISSN: 2150-3508
Research Article - (2018) Volume 9, Issue 3
Keywords: Stocking density; Litopenaeus vannamei ; Sand pond; Plastics mulch
The southern coastal area of Purworejo Regency of Central Java is an area of sand and clay soil that is categorized as marginal and less productive [1]. Sand dunes have characteristics of sandy texture, the slightly neutral acid of pH (5.7-7.0), low conductivity (DHL) (24-532 μ mho cm-1), and water permeability at 5 cm h-1 to ease water passing [2]. People use sand dune for subsistence as agricultural land, livestock and fishery. Agricultural activities are cultivated with seasonal commodity crops such as vegetables and fruits that require little irrigation. In the area of the available water enough to do rice field with short-term growth period (110 days -130 days). Livestock activities are limited to chickens and ducks farming that are the relatively small amount. The income of farmers and ranchers is low that they have not been able to improve the welfare of their families.
At the beginning of 2010, several community groups began to utilize the coastal area of Purworejo for shrimp farming. They learn shrimp cultivation techniques that have been successfully done on the coast of Kulonprogo district with similar land conditions. Shrimp farming technique applied in the sand field is by coating the mulch plastic on the surface of the pond to retain the water. Pond construction consists of dug sand to form the ponds and then the bottom of the pond covered with mulch plastic sheet to retain the water. Since 2013 the shrimp farming on sand dunes has expanded along the southern coastal areas of Central Java. Currently estimated that there are about 1100 units pond size between 1000 m2-4500 m2 cultivated by the community [3,4].
The white shrimp farming on the southern coastal of Purworejo district is generally related with a capital intensive business, therefore the community seeks individuals or groups to solve those capital problems. The technique of white shrimp cultivation is done intensively with the density of varied stocking, high protein preparation and no water changing during the rearing. The pond water source comes from the well water with the pipe in depth between 20 m -40 m, thus the water quality depends on the condition of the surrounding land. The water salinity gets higher along with the depth of excavation. However, if the wells are too deep, then the chemical composition of the water is getting out of balance with the sea water.
Shrimp farmers do the varying density, depending on personal experience and friends who have succeeded with white shrimp harvest. Some farmers do high stocking density to obtain high production and profit [4]. However, high density will use more resources, which have an adverse impact on the environment. In addition, the disposal of waste from siphon and crops directly to the area around the pond without further processing caused environmental damage, such as groundwater contamination and the environment around the ponds.
Well managed white shrimp farming can provide a good benefit and low ecological/ environmental impacts, thus, the sustainable farming can be obtained. Intensive shrimp farms are characterized by high stocking density [5-7], producing more waste, presenting enormous environmental risks. Application of different cultivation systems will affect stocking density [8]. Density is a parameter that can affect the growth and cultivation of aquaculture species [7,9,10] .
The optimum stocking density of penaeid shrimp has been widely reported although varied, such as Farfantepenaeus paulensis [11], Penaeus semisulcatus [12], P. indicus [13], Fenneropenaeus merguiensis [14] and P. monodon [15-19]. Stocking densities on white shrimp farming vary with diverse systems and cultivation ponds. Up to now, the optimum density of the white shrimp cultured in the sand field is not known yet. Therefore, this study was conducted to determine the effect of stocking density on the growth, survival rate and biomass of white shrimp in the sand ponds by using mulch plastic.
Ponds design
This research was conducted in August-October 2017 on the coastal of Keburuhan Village Ngombol District Purworejo Regency, Central Java Indonesia. The pond was used in this study was 3 × 4 × 1 m3 consisted of 9 units. Ponds were made by digging up to 1 m of sand, then on the bottom and sides of the ponds were covered with mulch plastic. Each pond was separated with a barrier made of sand-filled sacks. The ponds were filled with water up to a height of 80 cm.
The source of water came from ground surface water obtained by making a well which dug around the ponds. The good digs were made by injecting high-pressure water into the soil to a certain depth and then a 3-inch diameter pipe was inserted into the soil to a depth of ± 20 m to obtain a suitable salinity water source. Water was sucked using a 0.5 PK power pump and flowed directly to the pond. Each pond was equipped with a 1.5 HP electric powered aerator which powered from an 8.5 PK generator. The aerator was used to increase the supply of oxygen in the pond as the need for white shrimp.
Research design
The study was designed experimentally using a complete randomized design consisting of three stocking densities as treatments of (100, 200 and 300) shrimp m-2, each treatment repeated 3 times. The number of shrimp seeds stocked was 1200, 2400 and 3600 shrimps. Treatment ponds were determined randomly and then the chosen pond was labelled according to its group. Each pond was filled with water gradually to as high as 0.8 m using the depth sign. The water was given a 1 ppm chlorine solution on each pond for water sterilization. After that, all ponds were continuously aerated for 12 hours. Next, water was allowed to stand for 3 days without aeration. The water was given artificial fertilizer from a mixture of molasses, bran, and yeast to grow natural food. Each pond was given 1 liter of fertilizer, which was done 4 times before stocking (period of 14 days). During the fertilization, the pond was aerated for 3 hours to 4 hours.
Shrimp seeds were gained from Central Protein Prima hatchery which transported by land to the ponds area. Therefore, the seed should be acclimatized for 45 minutes before stocking. The seed used in this study is Post Larva stage (PL9). They were calculated manually according to the amount of density treatment. Then they were slowly put in the ponds. The feed used was commercial shrimp feed (Irawan®) contains 30% protein. The feed consisted of three forms namely powder (powder), crumbs (crumble) and pellets. Powdered and crumble feeds were given for shrimps of <2 g and pellets for shrimp >2 g. Vitamin C and omega protein were used for the shrimp feed mixes.
At the beginning of culture period, feeding was done by blind feeding until the age of 20 days. It was aimed to estimate the amount of feeding after shrimp weight increases. The amount of feed given at feeding was known from the sampling of shrimp weight each week on each treatment. The frequency of feeding was 4 times a day namely at 07.00, 11.00, 15.00 and 20.00. The feed first mixed with vitamin C (10 g of feed: 0.1 g of vitamin C) in the morning and omega protein (10 g feed: 0.1 g omega protein) in the afternoon and then added with enough water. Feed was given by spreading thoroughly the pond, especially on the edge of the pond. Water exchange was carried out periodically with 10% volume of each pond in order to maintain the quality of the water. The process of water exchanging was done together with the siphon process. This was done to reduce the content of organic materials in the bottom of the pond. Both processes were done after 25 days of shrimp and then continued for every week until the harvest time.
At the end of the study when the shrimp was 75 days old, the shrimp was harvested by drying the ponds. Then the shrimp was taken by using nets. After that, they were put into a plastic basket and sorted.
Parameters measurement
Observations were made on physical, chemical and biological parameters. Physical parameters of pond water were included the temperature and transparency. Water chemistry parameters were included the salinity, pH, dissolved oxygen (DO), nitrite-N, nitrate-N, ammonia-N and total organic matter. While the biological parameters were included the length and weight of shrimp, Physical parameters of water which measured daily were the temperature (mercury thermometer). It was conducted by dipping the thermometer into the water for 1 minute. The water transparency (Secchi disk) was performed in situ by inserting the Secchi disk to the extent still visible.
Water chemistry parameters consisted of salinity (Otago master handy refractometer), pH (pH Scan-Eutech Instruments) and DO (portable DO meter-Eutech Instruments) were measured in situ daily. Water chemistry parameters such as nitrite-N, nitrate-N, ammonia-N and total organic matter were measured every two weeks and analyzed in the laboratory using standard method [20]. The measurement of shrimp biology was done on the basis of measuring the length and weight parameters of the beginning and the end of shrimp cultured. Initial sampling began when the shrimp was 30 days old because the size was still relatively small. The next sampling was done every two weeks. The sampling was conducted by collecting 30 shrimp randomly from each pond by using a net. The sample then put into a small container and then aerated to keep the shrimp alive. The total length of the body was measured by using the rule (mm) namely the distance between rostrum and telson. The weight of shrimp was measured by using a digital scale of 0.01 g (Ohaus) [21]. The length and weight measurements were conducted alternately from each pond. After the measurements, the shrimp samples were returned to the ponds. At the end of the study, a total weight of shrimp biomass measurements was conducted from each pond.
Data collection
The data collected in this study were included the water physical and chemical parameters, and also the shrimp biological parameters. Physical data consisted of the mean values of temperature and water transparency. Chemical data were included the mean values of salinity, pH, dissolved oxygen, nitrate, nitrite, ammonia and TOM. Shrimp biological data consisted of an average length and weight of shrimp end and total shrimp biomass.
Data analysis
The data analyzed in this research consisted of physical and chemical parameters of water were temperature, brightness, salinity, pH DO, nitrate, nitrite, ammonia and total organic matter (TOM). While the shrimp biology parameters were daily growth, mean weight and final length, the composition of length and weight size, survival rate, feed conversion ratio (FCR) and biomass production.
Growth data were analyzed using the formula in Araneda et al. [22]. The growth rate of each stocking density treatment is a function of weight and time with the formula GR=Wt−WO/t, where GR is Growth Rate, Wt and WO is the final weight and the initial weight; and t is culture period. The relative length was calculated using the formula [23], relative length (RL)=lnLt−lnL0/t, where RL is relative length, Lt is an average length of shrimp at the end of the study, L0 is an average length of shrimp at the beginning of the study and t is the number of days since the start of the experiment. Survival Rate (SR,%) was analyzed according to the formula [24], SR=Nt/N0×100%, where SR is survival rate, N0 is live shrimp count, Nt is live at the end of culture. The feed conversion ratio (FCR) was determined at the end of the culture period by using the formula according to Zonneveld et al. [24], FCR=F/Bt+Bm)−B0, where FCR is feed conversion ratio, F is feed amount (g), Bt is shrimp biomass at the end of culture (g), Bm is dead shrimp biomass (g) and B0 is shrimp biomass at the beginning of the study (g). Biomass production follows the formula P=B/A, where P is productivity of pond (kg ha-1), B is biomass (kg), and A is pond area used (ha).
Statistical analysis
Physical and chemical data of water quality were analyzed descriptively presented in table form. The compositions of length and weight were also analyzed descriptively and shown in table form. The normality and homogeneity of the data were tested using Benferoni tests. Comparison of growth rate, survival rate (SR), feed conversion ratio (FCR) and biomass production in each treatment was analyzed using one way ANOVA with SPSS version 19 software. Duncan's advanced test was used when there was a difference between treatments (p<0.05). All data were presented in the mean ± standard deviation (SD) (n=3). The effect of stocking density on growth was estimated by single factor variance analysis. Nonlinear regression analysis was used to determine the relationship between stocking densities and growth rate.
Water quality parameters observed during the study were varied widely (Table 1). Water temperature ranged between 29.23°C -29.60°C and brightness were between 38.07 cm -39.636 cm. The results showed that there was no difference in temperature between the three treatments (p<0.05), while the brightness showed that the treatments 100 and 200 were significantly different, but they were not significantly different from the 300 (p<0.05) treatment. Salinity parameters ranged from 22.07 ppt -25.07 ppt, pH 7.96 to 7.99, dissolved oxygen (4.24-4.51) mgL-1, nitrite (1.35-1.96) mgL-1, nitrate (1.51-2.38) mgL-1, ammonia 1.63-2.49 mgL-1, and TOM (185.15-248.20) mgL-1. The results showed that salinity, pH, nitrite and nitrate parameters were not significantly different in the three treatments. While the parameter of dissolved oxygen (DO) and ammonia treatment 100 were significantly different with the treatments 200, 300 and the TOD treatment parameters were significantly different between treatments 100 and 200 (p<0.05).
| Parameters | Treatment shrimp m-2 | ||
|---|---|---|---|
| 100 | 200 | 300 | |
| Temperature (°C) | 29.23 ± 0.42a | 29.6 ± 0.35a | 28.7 ± 0.45a |
| Transparency (cm) | 39.63 ± 0.06a | 38.07 ± 0.81bc | 38.60 ± 0.53ac |
| Salinity (ppt) | 22.07 ± 2.72a | 25.07 ± 1.01a | 24.80 ± 1.38a |
| pH | 7.97 ± 0.04a | 7.99 ± 0.03a | 7.96 ± 0.02a |
| Dissolved oxygen (mg L-1) | 4.51 ± 0.08a | 4.24 ± 0.06b | 4.27 ± 0.05b |
| NO2 (mg L-1) | 1.67 ± 0.29a | 1.96 ± 0.06a | 1.35 ± 0.48a |
| NO3 (mg L-1) | 2.38 ± 0.37a | 1.51 ± 0.22a | 2.30 ± 0.61a |
| NH3 (mg L-1) | 0.53 ± 0.04a | 0.74 ± 0.02b | 0.77 ± 0.03b |
| Total Organic Matter (mg L-1) | 185.15 ± 24.34a | 188.83 ± 9.62a | 248.20 ± 18.84b |
Different letters indicate significant differences (p<0.05).
Table 1: The mean values of water quality parameters of white shrimp (L. vannamei ) on different stocking stocks in sand.
The results of the shrimp production performance analysis during the 75 day culture period were presented in Table 2. Daily growth observations on the 100 shrimp m-2 treatment were higher with an average of 0.153 g 2 weeks-1 and the lowest was 300 shrimp m-2, average 0.112 g 2 weeks-1. The growth rate was significantly different between the three treatments (p<0.05). The effect of density on the weight growth performance of the three treatments during the maintenance period was presented in Figure 1. The growth rate differentials for the three treatments were presented in Figure 2. The average final weight varied across all treatments. The mean value of the final treatment weight of 100 (12.93 g) was higher, compared to the treatment of 200 (10.18 g) and 300 (9.58 g) treatment. The mean final weight of treatment 100 was significantly different with the (200 and 300) shrimp m-2 treatments (p<0.05) (Table 2).
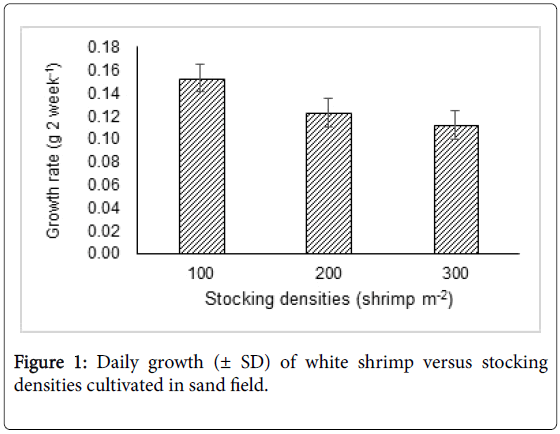
Figure 1: Daily growth (± SD) of white shrimp versus stocking densities cultivated in sand field.
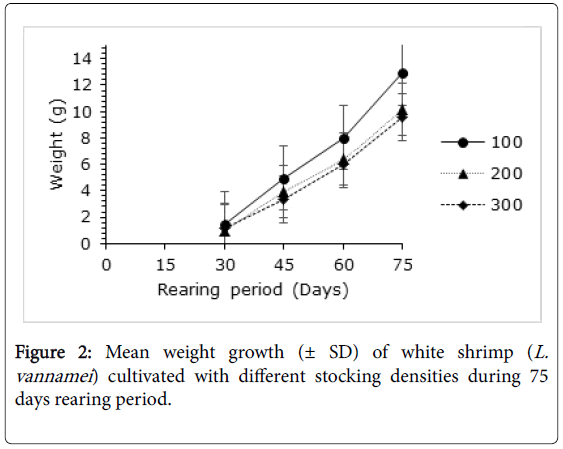
Figure 2: Mean weight growth (± SD) of white shrimp (L. vannamei ) cultivated with different stocking densities during 75 days rearing period.
| Parameters | 100 (shrimp m-2) | 200 (shrimp m-2) | 300 (shrimp m-2) |
|---|---|---|---|
| Daily growth (g day-1) | 0.1526 ± 0.011a | 0.1225 ± 0.08b | 0.1118 ± 0.006c |
| Final weight (g) | 12.93 ± 0.7a | 10.18 ± 0.66b | 9.58 ± 0.54c |
| Relative length (%) | 0.0084 ± 0.0004a | 0.0086 ± 0.0006a | 0.0079 ± 0.0003a |
| Final length (mm) | 12.94 ± 0.33a | 11.77 ± 0.32b | 11.58 ± 0.18b |
| Survival rate (%) | 96.54 ± 1.47a | 83.46 ± 5.72b | 64.98 ± 4.58c |
| Feed conversion ratio (FCR) | 1.00 ± 0.07a | 1.47 ± 0.005b | 2.00 ± 0.05c |
| Biomass Production (kg m-3) | 14.99 ±1.09a | 20.33 ± 0.14b | 22.37 ± 0.57c |
Different letters indicate significant differences (p<0.05).
Table 2: Final weights, daily growth, relative length, survival rate, FCR and white shrimp biomass production (L. vannamei ) in sand farms.
The result of growth calculation was relatively varied between the three treatments. The average value of the relative length of treatment 200 was higher that was 0.0086%, followed by 100 treatment that was 0.0084% and 300 treatments was 0.0079%. There was no relative length difference between the three treatments (p<0.05) (Table 2). The effect of the density on the weight growth performance of the three treatments during the maintenance period was presented in Figure 3. While the relative lengths of the three treatments were presented in Figure 4. The average growth of the final length varied across all treatments. The average treatment end length was 100 (12.94 cm) longer than the treatment 200 (11.77 cm) and the treatment was 300 (11.58 cm). The results showed that the mean of the final length was significantly different between the three treatments (p<0.05).
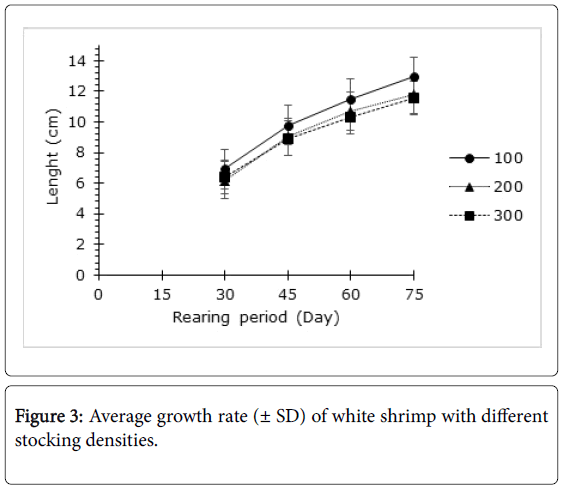
Figure 3: Average growth rate (± SD) of white shrimp with different stocking densities.
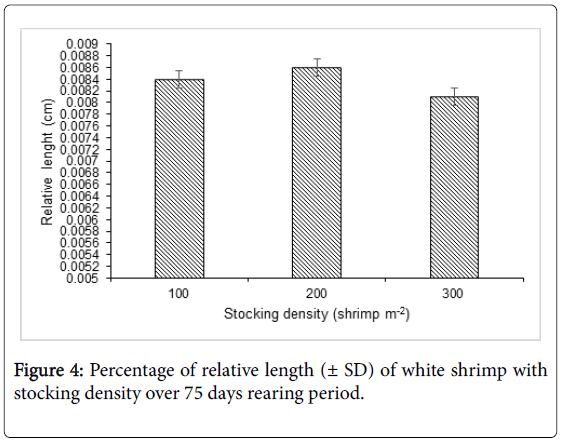
Figure 4: Percentage of relative length (± SD) of white shrimp with stocking density over 75 days rearing period.
The survival rate of white shrimp during the cultivation period varied between all treatments. The SR at treatment 100 (96.54%) was higher than the treatment of 200 (83.46%) and 300 treatment (64.98%) (Table 2). The results showed that the survival rate was significantly different between the three treatments (p<0.05). The value of the feed conversion ratio (FCR) during the culture period varied between the three treatments. The value of FCR increased with increasing shrimp density treatment. The smallest FCR value on the 100 treatment was 1.00 and the largest of the 300 treatment was 2.00 (Table 2). The results showed that FCR value was significantly different in all treatments (p<0.05).
The production of white shrimp biomass varied between the three treatments. Biomass tends to increase with increasing shrimp density. The lowest average biomass at the treatment of 100 was 14.99 kg m-3, and the highest in the 300 treatments was 22.37 kg m-3 (Table 2). The results showed that biomass production was significantly different between all treatments (p<0.05).
The composition of the length of the 75 day culture period varied greatly. The shrimp lengths were divided into three categories of small size classes (≤ 5.9 cm), medium (6.0 cm -10.9 cm) and large (≥ 11.0 cm) (Table 3). The percentage of length of the three treatments was dominated by the medium size category has treatment 100 (47.50%), treatment 200 (45.83%) and 300 treatments (57.50%). The composition of large sizes category at the treatment of 100 was 40.83%, the treatment of 200 by 30.0% and 300 treatments of 10.83%. While the composition of small size obtained in the treatment 300 (31.67%), treatment 200 (24.17%) and treatment 100 (11.67%) (Table 3).
| Size group (mm) | Treatment (n=120) | |||||
|---|---|---|---|---|---|---|
| 100 shrimps m-2 | % | 200 shrimps m-2 | % | 300 shrimps m-2 | % | |
| ≤ 5.9 | 14 | 11.67 | 41 | 24.17 | 38 | 31.67 |
| 6.0-10.9 | 57 | 47.50 | 55 | 45.83 | 69 | 57.50 |
| ≥ 11 | 49 | 40.83 | 24 | 30.00 | 13 | 10.83 |
Table 3: The composition of the number of individual shrimps and the percentage of the length group in each treatment.
The weight size composition during the 75 day culture period varied between the three treatments. The shrimp weight was divided into three categories of small size groups (≤ 1.39), moderate (1.4-10.9) and large (≥ 11.0) (Table 4). The percentage of weight size in the three treatments was dominated by medium size category that was treatment 100 (50%), treatment 200 (48.33%) and treatment 300 (46.67%). The composition of large size was more at treatment 100 (40.83%), treatment of 200 (26.67%) and treatment of 300s (19.17%). While the percentage of small size category more at treatment 300 is 34.17%, treatment 200 is 25%, and 100 is 9.17%, respectively (Table 4).
| Size groups (g) | Treatment (n=120) | |||||
|---|---|---|---|---|---|---|
| 100 shrimps m-2 | % | 200 shrimps m-2 | % | 300 shrimps m-2 | % | |
| ≤ 1.39 | 11 | 9.17 | 30 | 25 | 41 | 34.17 |
| 1.4-10.9 | 60 | 50 | 58 | 48.33 | 56 | 46.67 |
| ≥ 11.0 | 49 | 40.83 | 32 | 26.67 | 23 | 19.17 |
Table 4: The composition of the number of individuals and groups of shrimp weight size in each treatment.
Water quality during the study showed the values that can still be tolerated by white shrimp, except the total organic material (TOM) were relatively high. Physical and chemical parameters such as temperature, salinity, pH and DO tend to fluctuate (Table 1), although still within normal limits [25-27]. Nitrate, nitrite and ammonia concentrations increased over time, especially in high stocking densities, due to the increasing amount of feeding among stocking densities [9,28].
The results of this study indicated the performance of white shrimp that was cultured in the sand ponds using mulch plastic with high stocking density. Stocking densities play a very important role in the growth of aquatic organisms [8,22,29]. Growth rates in low densities are better than high densities (Figure 2) [14]. According to Araneda et al. [22,30] the rate of individual growth may slow and also rapidly, depending on the area of cultivation such as on marine, brackish and freshwater (low salinity). In addition, other factors were also contributed as the water temperatures [26,31] individual initial and final weight [22] and feed types [10].
Viewed from a range of water salinity, this study resided in a brackish water environment (Table 1). Williams et al. [32] have reported that the growth rate between (0.50-0.95) g week-1 at high salinity with 107 m-2 and 100 m-2 density is very different. Research conducted by Samocha et al. [33] in the indoor at low salinity gained growth rate between (2.20-2.31) g week-1 on L. vannamei , Sowers et al. [34] obtained a moderate growth rate of L. vannamei of (1.17-1.23) g weeks-1 on different salinity. Duy et al. [15] reported that at salinity 20 ppt -23 ppt with a density of 10 m-2 Penaeus monodon growth was slower than salinity 30 ppt -33 ppt.
Some researchers had used stocking density as a treatment to find out shrimp survival, although the stocking density used is relatively smaller when compared with the stocking stock used in this study (Table 2 and Figure 2). Suriya et al. [30] reported that densities of 65 and 85 shrimp m-2 obtained L. vannamei SR between 80%-90%. Sookying et al. [10] obtained L. vannamei survival rate between 45%-47% with 10 m-2 and 20 m-2 densities. While Gaber et al. [35] reported that densities of (5, 15 and 25) m-2 obtained P. semisulcatus survival rate between 51.60%-89.0%. Araneda et al. [28] reported that densities of 90 (76.1%), 130 (68.9%) and 180 (65.9%) shrimp m-2 obtained decreasing Penaeus vannamei survival rate with increasing stocking density. The same phenomenon appeared in this study by obtaining an increasingly decreasing SR with high stocking density (Table 2). Nevertheless, the survival rate in this study was better when viewed from the density applied and environmental conditions, especially water sources were quite limited.
The decline in growth and survival on shrimp culture and increased biomass production has been reported by Williams et al. [32,33,36-38]. Larger organisms are dominant to small organisms at feeding will trigger competition in place utilization, especially at high density. This shows that social interaction between individuals has an effect on inhibiting growth and survival especially in increasing population density conditions [28,39]. Although in this study the aspect of cannibalism was not observed, often shrimp is seen prey on other shrimp that have died. When compared to early stocking, the decrease in population density of individual shrimp, mortality aspects greatly affect the growth rate in the three densities with increasing space utilization [28,40]). Other aspects such as water chemical parameters also have a role in the growth of aquatic biota. Cheng et al. [41,42] reported that the accumulation of nitrite and ammonia affected the growth decline due to an increase in energy expenditure at the time of osmotic regulation.
Feed conversion rate (FCR) is one of the important parameters in penaeid culture. Feed consumption on shrimp is influenced by several parameters of water quality such as temperature. Babu et al. [43] reported that at relatively low temperatures feed consumption was slower than the high temperatures. Araneda et al. [22] also reported that white shrimp consumed better feed at 35°C with the density of 90 shrimp m-2, while the density 180 m-2 of feed consumption was lower. In this study, the FCR values differed between the low density and the high one (Table 1). However, the effect of temperature on the three treatments was relatively the same (Table 4).
Wahab et al. [44] reported that the influence of temperature on FCR has a varied pattern. In small shrimp, the effect of temperature is relatively small. Medium-sized shrimp, FCR at temperatures 27°C and 30°C are not different but significant high at 23°C. While the large shrimp FCR is lower at 27°C, FCR is greater at higher and lower temperatures. This shows that the growth efficiency has an optimum temperature that limits the increase in shrimp size. Increased shrimp size and decreased growth efficiency are more sensitive to temperature effect.
The composition of shrimp length and weight was dominated by medium group (Tables 3 and 4). The percentage of composition of the size was relatively the same in the three stocking densities. Nevertheless, the percentage of large category group sizes was found to be more common in low stocking densities. In contrast, the percentage of small size groups was found in high stocking densities. This shows that there is a denser stocking effect with shrimp size composition [39]. While research conducted by Wahab et al. [44] shows the effect of temperature on shrimp size P. vannamei . According to the shrimp with small size growth are at a good temperature >30°C with better FCR. Medium sized shrimp, optimized temperature equal 30°C. While the shrimp with a large size optimum temperature 27°C. It is further explained that shrimps have optimum temperature according to size and tend to decrease with increasing shrimp size.
The high amount of feeding resulting in increased stocking density directly also affected the amount of organic matter (Table 1). As result, increasing of feed residue, the rest of metabolism and excretion are high especially the organic matter content (TOM) [30,45]. Avnimelech et al. [46] suggests that the accumulation of excessive organic matter leads to anaerobic environmental conditions, the high demand for oxygen in the sediments, the deterioration of environmental quality which ultimately affects the low cultivation of growth response. Budiardi [6] reported that this condition affects the shrimp appetite so that growth is slower; consequently the final weight of the shrimp is smaller.
In this study, high density produced higher biomass production than the low one (Table 2). During the 75 days rearing period, high density (300 shrimp m-2) produced the highest biomass when compared with (100 and 200) shrimp m-2. However, low density had better growth rate, size composition, survival rate and FCR. In consideration to the area of the pond used in this study which categorized as marginal land and less productive [4], the growth of shrimp produced was very optimal and could be used as standard stocking for white shrimp farming in sand land using mulch. Some studies that have been done previously show that the biomass produced is higher with increased stocking density. Sookying et al. [10] obtained biomass with a stocking density of 17 shrimp m-2 (2660.8 kg ha-1), 26 shrimps m-2 (3052.8 kg ha-1), 35 shrimps m-2 (4612.5 kg ha-1) and 45 shrimp m-2 (6149.6 kg ha-1). Saraswaty et al. [47] reported with the density of 80 shrimp m-2 and 160 shrimps m-2 the biomass is 2000 kg ha-1 and 3560 kg ha-1. Kumar et al. [48] with densities of (20, 30, 40 and 50) shrimps m-2 obtained biomass of 2401.490 kg ha-1, 3434.496 kg ha-1, 4307.625 kg ha-1 and 4942.913 kg m-1 respectively.
Viewed from the economic aspect, the low density produced a relatively large size, those it has a high selling price compared to small shrimp size. Besides, the optimum stocking density can reduce the operational cost of cultivation especially feed and paddle wheel [4]. The low density also produces a small amount of shrimp waste compared with the high one [6,49,50]. The cultivation of white shrimp on sand land using mulch was well applied to utilize marginal land so that it becomes more productive. Application of aquaculture system in the sand area requires sustainable management [51]. Aquaculture management is mainly on the very limited aspect of water resources, by minimizing water changes during the cultivation period [9,18,35]. In addition, the management of eco-friendly cultivation waste by applying bioremediation system [51,52].
Stocking densities affected growth rate, survival rate, feed conversion ratio, and biomass production. Therefore, shrimp culture in the sand field can be applied with the stocking density of 100 and/or 200 shrimp m-2, viewed of the growth rate, survival rate, and FCR. Furthermore, the composition size of white shrimp in low density was greater than in high one. Low density can reduce operating costs and generate the good profit so that economically very profitable. In addition, with low density, the resulting waste is also relatively small. Those, the white shrimp culture in sand ponds using mulch plastic is advised to pay attention to water quality management, especially ammonia and organic materials and environmentally friendly waste management.
Thanks to all those who have helped so that this research can work well. The research was funded by the Ministry of Research, Technology and Higher Education of the Republic of Indonesia.