
Journal of Clinical Chemistry and Laboratory Medicine
Open Access
ISSN: 2736-6588

ISSN: 2736-6588
Research Article - (2020)Volume 3, Issue 1
Objective: The measurement of urinary Cystatin C (cyst-C) can be a very good way for early identifying newborns
predisposed to renal function impairment. PETIA, PENIA and EIA are the immunometric methods used for
quantitative determination of cyst-C in human biologic fluid but they have some interference and do not allow
realizing qualitative analysis. The present study performs a validation of Immunoblot SDS-PAGE for the analysis of
urinary cyst-C.
Methods: urines were collected from neonates of the nursey at S. Maria della Misericordia Hospital. Urinary cyst-C
was investigated by the SDS-PAGE electrophoresis, the immunoblot and the reading of optical density.
Results: the qualitative analysis showed two different molecular forms: a reactivity at about 70 KDa in all samples and
a reactivity at 13 KDa in a limited number of samples.
The coefficient of variation for assay precision was 10% and for assay accuracy was ± 10%; the detection limit was
0.009 ng/ μL and the calibration curve has a good linearity (range 0.02-0.3 ng/ μL). The stability of urinary cyst-C
was acceptable, even without the use of protease inhibitors, if the assay was performed on urine freshly recruited or
immediately after thawing the samples, stored for up to six months.
Conclusion: Immunoblot SDS-PAGE analysis is a valid method to obtain a qualitative and a quantitative analysis of
urinary cyst-C.
Urinary cystatin C; Neonates; Method validation; Immunoblot SDS-PAGE; Reading of densitometry; Qualitative and quantitative analysis
Cyst-C is a strongly basic endogenous cysteine proteinases inhibitor belonging to the type 2 cystatin superfamily [1-6]. The mature, active form of human cyst-C is a single non-glycosylated peptide chain consisting of 120 aminoacid residues, with a molecular mass of 13 KDa [7,8]; the cyst-C monomer is present in all human body fluids and it is produced at a constant rate by all karyocytes [9-12]. It is directly and freely filtrated from the blood into the glomerulus and is almost completely reabsorbed and catabolised in the proximal renal tubule [13-15]. The remaining cyst-C is eliminated in the urine and urinary cyst-C concentration are thus normally very low [16-18]. Tubular damage induces impairment of cyst-C reabsorption by the proximal renal tubule and, in addition glomerular alteration causes high molecular weight protein leakage which leads to competition with tubular uptake of cyst-C. Therefore, urinary cyst-C was considered to have the potency to detect both glomerular and proximal renal injury [9,19-21]. In fact, it is considered as a newly endogenous biomarker of kidney damage [9,19,22-25], which can be used to detect early as well as acute and chronic renal failure [26].
Despite the multitude of clinical data in literature about cyst-C as a renal functionality biomarker [9,19,20,21], cyst-C is not yet widely used as a biomarker because of a combination of factors, including the lack of scrutiny for its routine use in the laboratory tests, the lack of costs examination of these analysis and the failure to identify the time when making the determination of cyst-C [27]. The methods used for determination of cyst-C in human biologic fluid are particleenhanced turbidimetric immunoassay (PETIA), particleenhanced nephelometric immunoassay (PENIA) and enzyme immunoassay (EIA) or enzyme-linked immunoassay (ELISA) [26,28-35]. These approaches have a good accuracy and precision but they have some limitations: PETIA and PENIA are both sensitive to interference by lipemia, hemolysis and bilirubinemia and ELISA is relatively more expensive; additionally, all three methods do not allow realizing qualitative analysis.
In newborns urinary cyst-C can be considered as a surrogate of nephrons mass since an inverse statistically significant correlation was found between levels and volume to identify intrauterine growth retardation (IUGR) neonates at high risk of developing long term renal disease [36]; its measurement in the urine of newborns can be a very good way for early identifying those predisposed to renal function impairment and it is what pediatricians need to predict the glomerular and tubular function, renal mass and to select them for a promptly therapy which ensure to avoid long-term effects of kidney dysfunction on growth, tissue viability and quality of life [27].
Therefore, the purpose of this study was to validate Immunoblot SDS-PAGE as a qualitative and a quantitative method for the analysis of urinary cyst-C, through the realization of a calibration curve and the reading of densitometry with the program Image J.
Samples
One hundred and twenty urine samples were prospectively recruited from the newborn nurses at S. Maria della Misericordia Hospital from June 2014 to March 2015.
Morning urine samples were collected using a special bag collection device and then they were transferred to our laboratory and were tested by the measurement of urinary proteins, leukocytes and nitrite with a multiple test strip (Combi-Screen Plus, Analytican Biotechnology AG) to exclude urinary infections and/or proteinuria.
Lastly, the urine was centrifuged at 4°C for 30 minutes at 5000 rpm, aliquoted and stored in a -20°C freezer for Immunoblot SDS-PAGE analysis.
The present study adheres to World Medical Association Declaration of Helsinki regarding ethical conduct of research.
Urinary cyst-C assay
Urinary cyst-C was determined by Immunoblot SDS-PAGE and the reading of optical density by the program Image J.
The electrophoretic system used is the Mini-Protean Tetra Cell Biorad. The gel used is formed by 15% of polyacrylamide; 38 μl of sample and 12 μl of loading buffer were seeded into each well after, respectively, heating to 93°C for 4 min and cooling at 4°C for 10 minutes.
After blotting, the membrane was subjected to blocking with 5% milk powder in TBS-0.05% Tween 20 solution, followed by incubation overnight at 4°C with the primary antibody diluted 1:250 (mouse IgG anti cyst-C, Santa Cruz Biotechnology, Inc.).
The immunoreactivity was displayed by a subsequent incubation for 1 hour at RT with the secondary antibody conjugated with horseradish peroxidase, diluted 1: 2000 (anti-mouse IgG-HRP goat: sc-2005, Santa Cruz Biotechnology, Inc.). Protein bands can be detected exposing the sensitive plates for 2 minutes to signal emitted by chemiluminescent products to nitrocellulose. The chemiluminescent products were obtained by the presence of peroxidase enzyme substrate (Immunoblot Luminol Reagent: sc-2048, Santa Cruz Biotechnology, Inc.). Densitometry of the visible bands impressed on the autoradiographic plate was carried out with the Image J program and the cyst-C concentration was quantified as optical density through calibration curve.
Qualitative analytical validation
Cyst-C reactivity: Evaluation of cyst-C reactivity aimed to characterize size, molecular weight and conformation of the protein of interest and to assess the formation of aggregate or complexes.
LC−MS/MS analysis: The sample was digested following Barr et al method [37] with modifications. The sample (approximately 500 μg) was mixed with 8 M urea, 50 mM DTT and incubated for 1 h at 56 °C. 200 mM iodoacetamide was added to the mixture and incubated in the dark at 37 °C for 30 minutes. The mixture was subsequently diluted with 0.1 M Tris/HCl buffer and incubated with trypsin (20 μL of a 0.5 μg/μL solution) overnight with mild agitation. The digested peptide solution was terminated by adding 50 μL of 50% v/v formic acid in water. Sample was subsequently vortexed and centrifuged prior to LCMS/ MS analysis. The identification of the cyst-C tryptic unique peptides [38] was performed by UHPLC on Agilent Technologies 6540 UHD Accurate Mass Q-TOF LC/MS, 1290 Infinity Series.
Quantitative analytical validation
Assay precision: The assay precision was evaluated by three urine samples with different levels of cyst-C: high, medium and low cyst-C concentration. Each sample was replicate ten time in the same Immunoblot analysis and at different days for the intra- and the inter-assay coefficient of variation (CV), respectively.
The obtained CV values did not exceed 10%.
Analyte stability: Three urine samples with different levels of cyst-C (high, medium and low concentration) were analysed for cyst-C stability: for each one, four aliquots were stored at room temperature (RT) and four aliquots were stored at +4 °C for four days. All samples were measured fresh, just thawed and after 1 day, 2 days, 4 days of conservation in the manner described above; each sample was measured in triplicate.
Assay linearity: Linearity was tested by serial dilutions of cyst-C stock (Cyst-C Human E. Coli - BioVendor) in distilled water to obtain the following cyst-C amount per well: 0.06 ng/μL, 0.04 ng/μL, 0.02 ng/μL, 0.013 ng/μL, 0.007 ng/μL.
SDS-PAGE for assay linearity was repeated three times. The signals obtained on autoradiographic plates were measured by the program Image J, for the determination of optical density (Image Processing and Analysis in Java). The averages of measured values of optical density was plotted against ng of Cyst-C.
Lower limit of quantification (LoQ): To determine the lowest amount of cyst-C in urine that could be detected, we calculated the LoQ. Starting from a cyst-C stock solution (Cyst-C Human E. Coli, BioVendor) with concentration of 1mg/L, sample dilutions were made in distilled water to obtain the following cyst-C amount: 0.020 ng/μl, 0.016 ng/μl, 0.013 ng/μl, 0.09 ng/μl.
Each cyst-C diluted samples were measured in five different Immunoblot SDS-PAGE.
Antigen excess: The antigen excess was determined to identify the critical value of cyst-C amount beyond which it is observed the overlap of cyst-C bands amongst neighboring wells and so the linearity of the assay is lost. Cystatin C Human E. Coli (BioVendor) stock was diluted to obtain samples with decreasing cyst-C concentration.
Assay accuracy: To assess the accuracy yield, three samples with known amount of cyst-C were measured 5 times and through the calibration curve, obtained by three cyst-C samples of 0.2 ng/μl, 0.15 ng/μl and 0.05 ng/μl measured in the same run, was calculated the concentration of three samples. The averages of obtained values were compared with knowing of cyst-C and the difference between calculated and known values was expressed in percent.
The accuracy ± 10% was considered acceptable.
Qualitative analysis: The qualitative analysis has the aim to characterize size, molecular weight and conformation of the protein of interest and to assess the formation of aggregate or complexes of Cystatin C.
Statistical calculations: Statistical analysis and figures were performed by Excel 2010 (Microsoft Office). In the present study reference intervals used are in agreement with recommendations of The International Federation of Clinical Chemistry on the statistical treatment of reference values.
Quantitative variables were compared using Student ’ s t-test, carried out by GraphPad Prism software (GraphPad Software, San Diego, CA, USA); statistical significance was set at p<0.05.
The reading of optical density was made by the program Image J (Image Processing and Analysis in Java).
Qualitative analytical validation
Cyst-c reactivity by immunoblot: The Immunoblot SDS-PAGE qualitative analysis showed two different molecular forms: a reactivity at about 70 KDa in all samples and a reactivity at 13 KDa in a limited number of samples, shown in Figure 1.
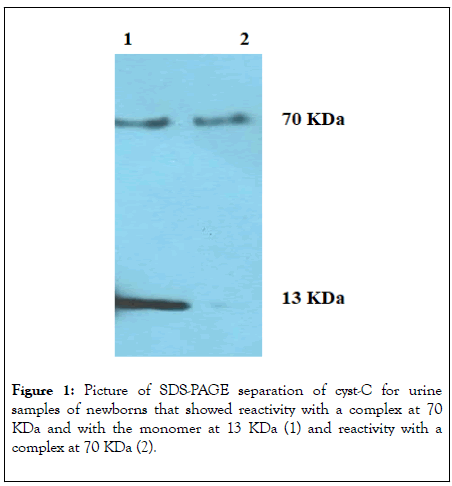
Figure 1: Picture of SDS-PAGE separation of cyst-C for urine samples of newborns that showed reactivity with a complex at 70 KDa and with the monomer at 13 KDa (1) and reactivity with a complex at 70 KDa (2).
A section of the present study assessed whether the presence of 70 KDa cyst-C complex was due to denaturant treatments and low pH or whether the complex represents a physiological conformation of cyst-C in newborns urine.
The Immunoblot SDS-PAGE analysis was carried out using different denaturing conditions: samples (1) not reduced with β-mercaptoethanol and unheated, (2) reduced with β- mercaptoethanol and unheated, (3) reduced with β- mercaptoethanol and heated, (4) denatured with urea, (5) heated at different temperatures and times, (6) not cooled at +4° C for 10 minutes, shown in Figures 2A and 2B.
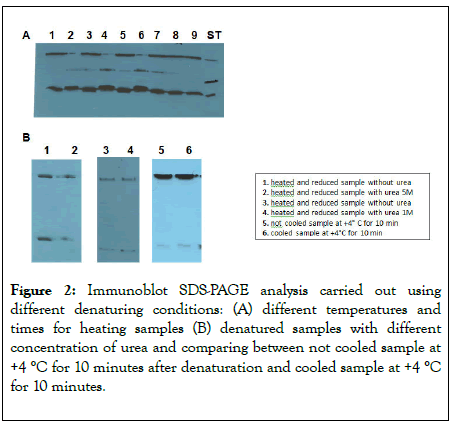
Figure 2: Immunoblot SDS-PAGE analysis carried out using different denaturing conditions: (A) different temperatures and times for heating samples (B) denatured samples with different concentration of urea and comparing between not cooled sample at +4 °C for 10 minutes after denaturation and cooled sample at +4 °C for 10 minutes.
The results obtained showed that the formation of the complex at about 70 KDa, in all samples, is not related to the denaturing conditions used but it is naturally present in the urine of newborns.
Cyst-C reactivity by LC−MS/MS: The 70 KDa fraction was investigated also by LC−MS/MS analysis, to verify that the reactivity at 70 KDa is due to the presence of cyst-C and not to an unspecific signal. In this complex, the presence of cyst-C has been unequivocally demonstrated by the identification of the cyst-C tryptic unique peptides [38] using Ultra High-Performance Liquid Cromatography (UHPLC) on Agilent Technologies 6540 UHD Accurate Mass Q-TOF LC/MS, 1290 Infinity Series, shown in Figures 3A and 3B.
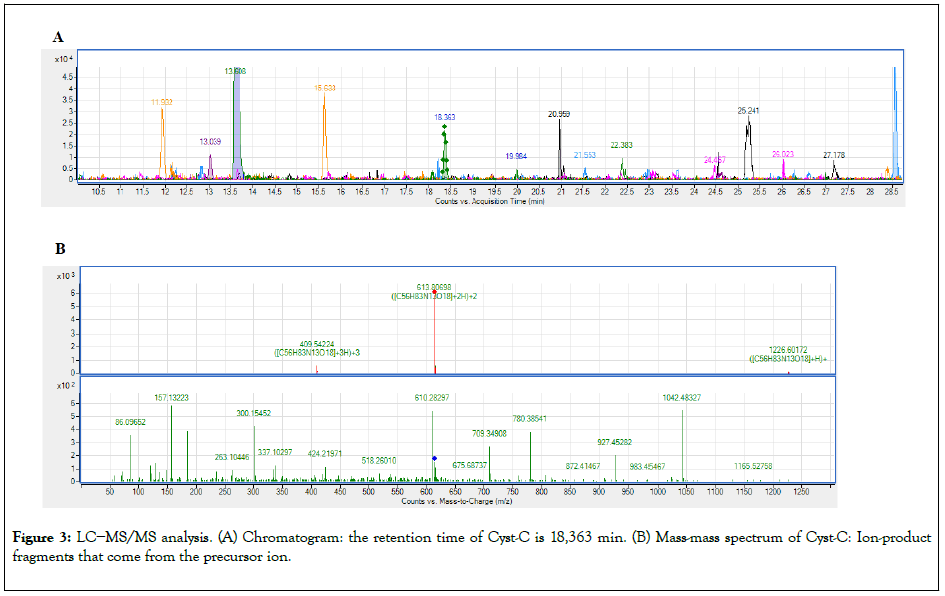
Figure 3: LC−MS/MS analysis. (A) Chromatogram: the retention time of Cyst-C is 18,363 min. (B) Mass-mass spectrum of Cyst-C: Ion-product fragments that come from the precursor ion.
Assay precision: The obtained CV values did not exceed 10%, so the precision of the method is acceptable, shown in Table 1.
| Mean concentration ( ng/µl ) | Intra-assay CV (%) | Inter-assay CV (%) |
|---|---|---|
| 0.048 | 2.74 | 3.34 |
| 0.076 | 2.02 | 3.03 |
| 0.093 | 2.33 | 3.44 |
Table 1: Assay precision for the Urine Cyst-C Assay. The Mean Value and CV for Three Urine Samples are Presented.
Analyte stability: Determination of cyst-C in freshly collected samples and in just thawed samples showed not statistically difference between cyst-C concentration measured, therefore the procedure used to store urine samples is an acceptable way to preserve samples from enzymatic degradation. Samples stored at +4°C for one day showed a loss of cyst-C concentration ranging between -84.72% and -78.22% and samples stored at room temperature for one day showed a loss of cyst-C concentration ranging between -87.07% and -82.05%. There was not a statistically significant difference between the decrease of cyst-C of samples stored at +4°C and that stored at room temperature, shown in Figure 4.
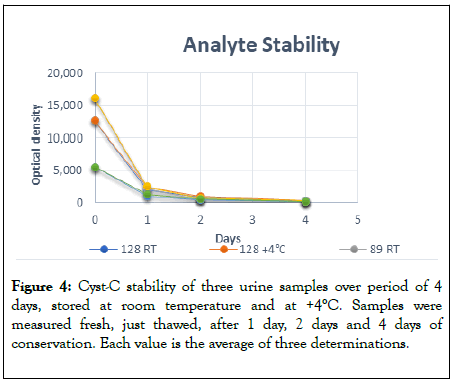
Figure 4: Cyst-C stability of three urine samples over period of 4 days, stored at room temperature and at +4°C. Samples were measured fresh, just thawed, after 1 day, 2 days and 4 days of conservation. Each value is the average of three determinations.
Due to the big loss of Cyst-C in the samples stored at 4°C, the measurement must be carried out immediately after thawing the sample.
Assay linearity: SDS-PAGE for serial dilutions of Cyst-C Human E. Coli (BioVendor) showed two different conformations of cyst-C: it was possible to observe monomeric and dimeric cyst-C at 13 KDa and at 26 KDa, respectively. In the present study, only the data relating to monomeric cyst-C will be processed, since they are of our interest, shown in Figure 5.
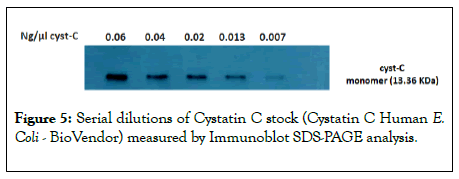
Figure 5: Serial dilutions of Cystatin C stock (Cystatin C Human E. Coli - BioVendor) measured by Immunoblot SDS-PAGE analysis.
SDS-PAGE was repeated three times and the calibration curve for cyst-C at 13 KDa was obtained by plotting the average of measured values of optical density against ng of monomeric cyst-C.
It had good linearity, with a regression of R2=0.98, shown in Figure 6.
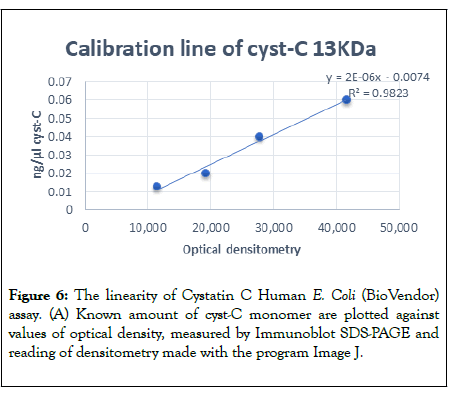
Figure 6: The linearity of Cystatin C Human E. Coli (BioVendor) assay. (A) Known amount of cyst-C monomer are plotted against values of optical density, measured by Immunoblot SDS-PAGE and reading of densitometry made with the program Image J.
Lower limit of quantification (LoQ):The lowest amount of monomeric cyst-C measurable in urine was 0.009 ng/µl. All results showed a CV less than 10%, shown in Table 2.
| ng monomeric cyst-C | Mean Optical Density monomeric Cystatin C | CV (%) |
|---|---|---|
| 0.02 | 14354 | 6.75 |
| 0.016 | 11643 | 7.22 |
| 0.013 | 7632 | 7.78 |
| 0.009 | 6707 | 8.12 |
Table 2: The Mean Concentration of ng of monomeric and dimeric Cystatin C and CV% for decreasing dilutions of Cystatin C samples.
Antigen excess: The image of the SDS-PAGE showed that amounts of cyst-C greater than 0.3 ng/µl caused an interference amongst bands of neighbors' wells. Therefore, it was impossible to accurately determine the optical density of each band with Mini-Protean Tetra Cell Biorad system. The linearity between optical density measured with the program Image J and ng of cyst-C was observed in all the amounts, including in 0.3 ng/µl of cyst-C.
Assay accuracy: The calibration curve of the cyst-C monomer showed a good level of linearity, with a regression of R2=0.98.
The known concentrations of cyst-C samples were 0.16 ng, 0.1 ng and 0.09 ng, and the values obtained with the measurement of optical density were 0.14 ng, 0.11 ng and 0.087ng. The accuracy is 87,5%, 110% and 97% respectively, shown in Figures 7A and 7B.
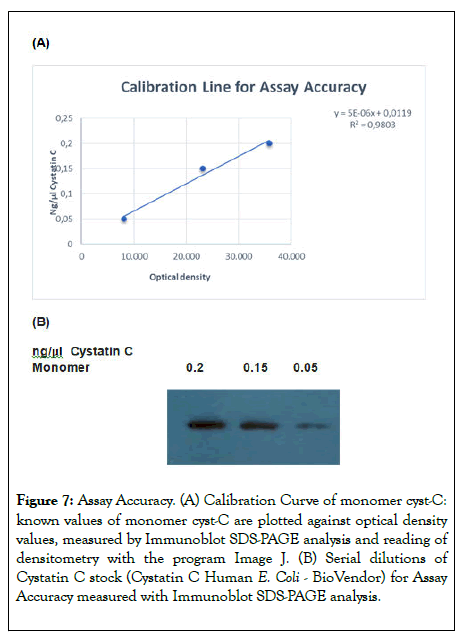
Figure 7: Assay Accuracy. (A) Calibration Curve of monomer cyst-C: known values of monomer cyst-C are plotted against optical density values, measured by Immunoblot SDS-PAGE analysis and reading of densitometry with the program Image J. (B) Serial dilutions of Cystatin C stock (Cystatin C Human E. Coli - BioVendor) for Assay Accuracy measured with Immunoblot SDS-PAGE analysis.
Chronic kidney disease is a major health problem worldwide with dramatically rising incidence and prevalence [39].
Cyst-C is a strongly basic secretory non-glycosylated protein produced at a constant rate in all nucleated cells [13]. Due to its low molecular weight (13.3 KDa), cyst-C is freely filtered in the kidney glomerulus with no retrieval back to the circulation. In proximal tubular cells, cyst-C is predominately reabsorbed and subsequently catabolized; therefore, in urine, the concentration of cyst-C is normally low and high levels reflect an abnormal reabsorption and degradation by tubular cells [9,16,24,25].
Many studies have shown that cyst-C can be used to detect kidney injury [19,40-44] and urinary cyst-C has been validated as a good reflection of the tubular function [9].
This study aims at expanding the diagnostic possibilities when evaluating kidney disease in the neonatal period.
Qualitative analytical validation: The qualitative analysis of cyst- C in the urine of newborns showed two different molecular forms: a reactivity at about 70 KDa in all samples and a reactivity at 13 KDa in a limited number of samples, shown above in Figure 1.
The reason why the reactivity at 13 KDa is present in only a few samples has been investigated in an already published paper and is not about the aim of this work [36].
Clearly, the band at 13 KDa indicates the presence of cyst-C as a monomer, while the band of 70 KDa cannot be completely characterized through the Immunoblot SDS-PAGE analysis. Literature data supports that cyst-C can forms dimers, tetramers and oligomers in conditions of low pH, high temperature and in the presence of denaturing agents [45-47]. Therefore, it was necessary to determine whether the formation of a cyst-C complex at about 70 KDa was due to the denaturing conditions to which the proteins were subjected prior to electrophoresis or whether the complex conformation was already present in the urine as a physiological conformation before denaturing occurred.
With this goal in mind, the Immunoblot SDS-PAGE analysis was carried out using different pre-treatment conditions of the samples, mentioned above.
The complex at about 70 KDa can be detected for the three following denaturing conditions: one unheated and not reduced sample (loading buffer without β -mercaptoethanol), one heated and not reduced sample (loading buffer without β- mercaptoethanol) and one heated and reduced sample (loading buffer with β -mercaptoethanol).
The heating time does not have any effect on the complex formation at about 70 KDa (Figure 2A): increasing the heating time from 4 minutes to 30 minutes, the reactivity continued to be observed.
Furthermore, the complex can be revealed both in the presence of different concentrations of urea and without any cooling of the samples at 4°C for 10 minutes (Figure 2B).
At temperatures of 30°C, 40°C, 50°C and 60°C, in the figure showing the Immunoblot SDS-PAGE analysis separation for urine samples the following were observed: the presence of the cyst-C complex at about 70 KDa, of monomeric cyst-C at 13 KDa and dimeric form of cyst-C at 26 KDa also. A similar behavior was detected for cyst-C E. Coli BioVendor, used as a positive control (Figure 2A).
Since the complex was observed also for decreasing temperature, we can suggest that, in contrast with the data included in the literature on the subject, the heating is not responsible for the formation of the complex at about 70 KDa.
Therefore, the formation of the complex at about 70 KDa is not related to the denaturing conditions used but it is naturally present in the urine of newborns.
This complex was investigated also by LC-MS/MS analysis, because no cyst-C aggregate with this molecular weight was known [27].
Therefore, the presence of cyst-C in the complex has been demonstrated through the identification of the cyst-C tryptic unique peptides [38] performed by Ultra High- Performance Liquid Cromatography (UHPLC) on Agilent Technologies 6540 UHD Accurate Mass Q-TOF LC/MS, 1290 Infinity Series [37] (Figure 3).
This analysis was carried out on 10 samples with reactivity at 70 KDa and 13 KDa and on 10 samples with reactivity only at 70 KDa.
In our SDS-PAGE, the molecular weight of about 70 KDa might coincide with the weight of pentameric cyst-C aggregate. Anyway, in the study of Mussap M about cyst-C conformations, no pentameric aggregates have been detected, suggesting that the only forms known were the dimeric and the tetrameric [27].
For this reason, we can speculate that our signal at 70 KDa indicated a protein complex in which cyst-C could be bound to another protein.
Further studies will be needed to investigate which molecules are part of the complex and first the types of Cathepsin (H, L and S) excluded from our study, should be investigated.
Quantitative analytical validation: All three samples with varying levels of Cyst-C showed an acceptable intra- and interassay CV of less than 10% (Table 1). Our results clearly show that this assay has a good level of precision, reproducibility and repeatability.
The precision of the Immunoblot SDS-PAGE method associated with the reading of optical density is comparable to that of EIA, ELISA, PENIA or PETIA, reported by various authors [9,48-49].
A good stability was observed in freshly collected urine samples or immediately after thawing. A decrease of cyst-C concentration was observed for samples stored for 1 day at +4 °C or at RT, showing not any statistically significant difference between them (Figure 3); this phenomenon can be explained by the presence of proteases in the urine which enzymatically digest cyst-C. So, the measurement must be carried out immediately after thawing the sample or in freshly collected sample.
Two different forms of cyst-C were observed in the Immunoblot SDS-PAGE analysis with dilutions of Cyst-C Human E. Coli (Figure 4), but we have reported only the calibration curve of our interest, for monomeric cyst-C at 13 KDa. It had a good correlation (Figure 5). Cyst-C can form dimers, and our results reflect those of the picture of the SDS-PAGE separation in the product datasheet of Cyst-C Human E. Coli (Biovendor), where bands of dimers and multimers can be seen even under reducing conditions.
The values of cyst-C concentration measured in all urine samples fall in the range of the calibration curve. Samples with optical density values higher than the highest standard point were run again with a 1:5 dilution.
Based on the assay accuracy, test results can be accepted.
The lowest amount of monomeric cyst-C measurable in the urine by the Immunoblot SDS-PAGE analysis was 0.009 ng/ μl, with a CV lower than 10% (Table 2); the present method is very sensitive. Further investigations are needed to calculate the cyst- C contained in the 70 KDa fraction.
The maximum limit of measurable antigen concentration with this method varies depending on the overlap of the cyst-C bands amongst neighbors' wells using Mini-Protean Tetra Cell Biorad system. It was shown that the linearity between optical density measured with the program Image J and ng of cyst-C was observed at any amount including in 0.3 ng/ μl ng of cyst-C.
A recovery ± 10% rate was considered acceptable, and the present study demonstrates that the Immunoblot SDS-PAGE analysis is an accuracy assay. The difference between known and measured values was within the established range (Figure 6).
In conclusion, the urinary cyst-C Immunoblot SDS-PAGE is a specific, sensitive and accurate method and it offers the possibility to obtain qualitative and quantitative analyses at the same time with reasonable costs and without any interference of other factors such as lipemia, hemolysis and hyperbilirubinemia. Therefore, it is a valid alternative to EIA.
None of the authors report a conflict of interest. The data reported in this manuscript have not been published elsewhere, nor are they under consideration by another journal. The process of obtaining informed consent was approved by the appropriate institutional review committee.
We thank Graziana Tiberi, Antonella Montecucco, Francesca Brunori, nurses of neonatal follow-up. This study was supported by “ Fondazione Cassa Risparmio Perugia ” Code Project: 2014.0252.021.
Citation: Grasselli C, Barbati A, Cesarini L, Pellegrino R, Di Renzo GC (2020) Validation of Immunoblot SDS-page as a Qualitative and a Quantitative Method for Determination of Urinary Cystatin C in Neonates. J Clin Chem Lab Med. 3.139. DOI: 10.35248/clinical-chemistrylaboratory- medicine.20.3.139
Received: 21-Apr-2020 Accepted: 05-May-2020 Published: 12-May-2020 , DOI: 10.35248/jcclm.20.3.141
Copyright: © 2020 Grasselli C, et al. This is an open-access article distributed under the terms of the Creative Commons Attribution License, which permits unrestricted use, distribution, and reproduction in any medium, provided the original author and source are credited.